The -ray Strength Function for Thallium Isotopes relevant to
the 205Pb–205Tl Chronometry
Abstract
Photoneutron cross sections were measured for 203Tl and 205Tl at energies between the one- and two-neutron thresholds using quasi-monochromatic -ray beams produced in laser Compton-scattering at the NewSUBARU synchrotron radiation facility. Our new measurement results in cross sections significantly different from the previously reported bremsstrahlung experiment, leading to rather different GDR parameters, in particular to lower GDR peak energies and higher peak cross sections. The photoneutron data are used to constrain the -ray strength function on the basis of the Hartree-Fock-Bogolyubov plus quasi-particle random phase approximation using the Gogny D1M interaction. Supplementing the experimentally constrained -ray strength function with the zero-limit E1 and M1 contributions for the de-excitation mode, we estimate the Maxwellian-averaged cross section for the s-process branching-point nucleus 204Tl in the context of the 205Pb – 205Tl chronometry.
I Introduction
In recent years, one witnesses a rapid growth of experimental and theoretical studies of the -ray strength function (SF) Bartholomew73 ; Lone85 ; RIPL3 across the chart of nuclei. The SF in the de-excitation mode, which is the nuclear statistical quantity equivalent to the transmission coefficient of the -ray emission, is a key quantity to determine radiative neutron capture cross sections that are of direct relevance to the nucleosynthesis of elements heavier than iron. It may be a highlight of the recent development Goriely18a to have reached a recognition that goes beyond the Brink hypothesis Brink ; Axel ; the SF in de-excitation mode differs from that in excitation mode in the zero-limit behavior of both E1 and M1 strengths, the latter of which referred to as upbend was experimentally observed Voin04 ; Gutt05 ; Algi08 and theoretically supported by the shell-model calculation Schw13 ; Brow14 ; Siej17a ; Siej17b ; Kara17 ; Schw17 .
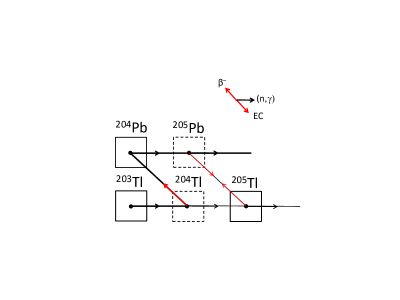
The present research interest in the SF lies in the thallium isotopes in relation to the s-process nucleosynthesis. The s-process in the Tl-Pb region involves a possible astrophysical application called the 205Pb–205Tl chronometry as depicted in Fig. 1. This chronometer relies on the production and survival of a short-lived 205Pb in certain s-process conditions like low-mass Asymptotic Giant Branch stars Mowl89 and massive Wolf-Rayet stars Arno97 and possible isotopic anomalies in meteoritic Tl due to in-situ decay of now extinct 205Pb Ande60 ; Osti69 ; Huey72 . The 205Pb is produced by the s-process only via 204Tl, an s-process branching-point nucleus with a half-life of 3.78 yr. While the 205Pb decays to 205Tl via electron capture with a half-life of 1.7 107 yr in laboratory conditions, the electron capture is accelerated in s-process conditions by the thermal populations of low-lying nuclear excited states Taka83 . Moreover, the 205Tl, when highly ionized, undergoes the so-called bound-state -decay to 205Pb Daud47 ; Bahc61 ; Taka83 ; Yoko85 . With the nuclear physics and astrophysics behind, the 205Pb–205Tl chronometer may determine the time span between the last nucleosynthetic events that modified the composition of the solar nebula and the formation of the solar system solid bodies Yoko85 .
The s-process production of 205Tl and 205Pb depends on the 204Tl radiative neutron capture cross section (Fig. 1). In the absence of possible direct measurements, we present an experimentally constrained estimate of the 204Tl(n,) cross section obtained with the -ray strength function method Utsu10a ; Utsu10b ; Utsu11 ; Utsu13 ; Fili14 ; Nyhu15 . The SF from the Hartree-Fock-Bogolyubov plus quasi-particle random phase approximation (QRPA) based on the Gogny D1M interaction Martini16 ; Goriely16b ; Goriely18a for both E1 and M1 components is constrained to new experimental Tl photoneutron cross sections. In Sect. II, our experimental procedure is described and in Sect. III data are analysed. Our resulting photoneutron cross sections are discussed in Sect. IV and compared with D1M+QRPA calculations. Based on the same nuclear ingredients, the calculated radiative neutron capture of the stable 203Tl and 205Tl are compared with experimental data, before applying the same procedure to the estimate of the 204Tl radiative neutron capture cross section. Finally conclusions are drawn in Sect. V.
II Experimental procedure
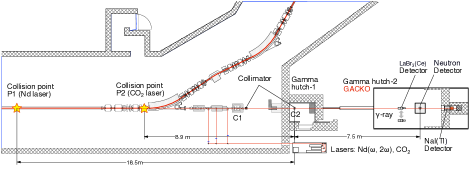
The photo-neutron measurements on 203,205Tl took place at the NewSUBARU synchrotronic radiation facility. Figure 2 shows a schematic illustration of the gamma-ray beam line and experimental set up. Quasi-monochromatic -ray beams were produced through laser Compton scattering (LCS) of 1064 nm photons in head-on collisions with relativistic electrons. Throughout the experiment, the laser was periodically on for 80 ms and off for 20 ms, in order to measure background neutrons and -rays. The electrons were injected from a linear accelerator into the NewSUBARU storage ring with an initial energy of 974 MeV, then subsequently decelerated to nominal energies in the region from 651 and 664 MeV to 882 and 904 MeV, providing LCS -ray beams corresponding to up to for 205Tl and 203Tl respectively. In total, 15 individual beams were produced for both 203Tl and 205Tl. The electron beam energy has been calibrated with the accuracy on the order of 10-5 Utsu14 . The energy is reproduced in every injection of an electron beam from a linear accelerator to the storage ring. The reproducibility of the electron energy is assured in the deceleration down to 0.5 GeV and acceleration up to 1.5 GeV by an automated control of the electron beam-optics parameters.
The energy profiles of the produced -ray beams were measured with a LaBr3:Ce (LaBr3) detector. The measured LaBr3 spectra were reproduced by a GEANT4 code Ioana_thesis ; geant4ref that incorporated the kinematics of the LCS process, including the beam emittance and the interactions between the LCS beam and the LaBr3 detector. In this way we were able to simulate the incoming energy profile of the beams with the maximum energies accurately determined by the calibrated electron beam energy.
The 203,205Tl targets were in metallic form with an areal density of g/cm2 and g/cm2, respectively. The corresponding enrichment of the two isotopes were and . The target material was pressed, thanks to this metal being malleable, into uniform disks and placed inside open cylinders of aluminum. For neutron detection, the high-efficiency detector was used, consisting of 20 proportional counters, arranged in three concentric rings and embedded in a 36 36 50 cm3 polyethylene neutron moderator neutrondet . The ring ratio technique, originally developed by Berman Berman_ring_ratio , was used to determine the average energy of the neutrons from the (,n) reactions. The efficiency of the neutron detector varies with the average neutron energy. The efficiency was measured with a calibrated 252Cf source and the energy dependence was determined by Monte Carlo simulations. The efficiency of the neutron detector was simulated using isotropically distributed, mono-energetic neutrons. The simulation performed for s- and p-wave neutrons shows a strong smearing effect on highly-anisotropic p-wave neutrons due to the thermalization of neutrons in the polyethylene moderator, resulting in a nearly identical efficiency for s- and p-wave neutrons Utsu2017 .
The LCS -ray flux was monitored by a NaI:Tl (NaI) detector during neutron measurement runs with 100 detection efficiency for the beam energies used in this experiment. The number of incoming rays per measurement was estimated using the pile-up/Poisson-fitting technique described in Ref. Kondo2011 ; utsunomiya2018 .
The measured photo-neutron cross section for an incoming beam with maximum -energy is given by the convoluted cross section,
| (1) |
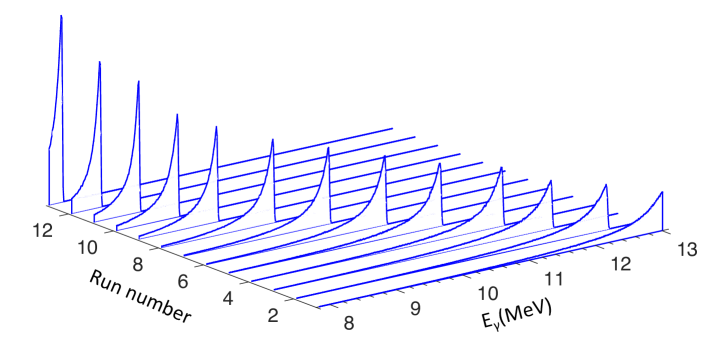
Here, is the normalized,, energy distribution of the -ray beam obtained from GEANT4 simulations. The simulated profiles of the beams, , used to investigate 205Tl are shown in Fig. 3. Furthermore, is the true photo-neutron cross section as a function of energy. The quantity represents the number of neutrons detected, gives the number of target nuclei per unit area, is the number of rays incident on target, represents the neutron detection efficiency, and finally gives a correction factor for self-attenuation in the target. The factor represents the fraction of the flux above .
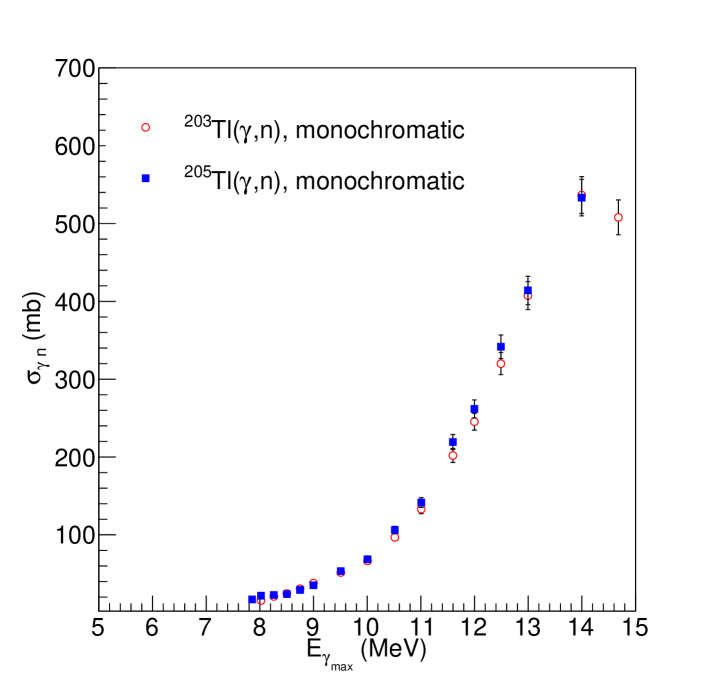
We have determined the convoluted cross sections given by Eq. (1) for beams with maximum energies in the range 13 MeV. The convoluted cross sections are not connected to a specific , and we choose to plot them as a function of . The convoluted cross sections of the two Tl-isotopes, which are often called monochromatic cross sections, are shown in Fig. 4. The error bars in Fig. 4 represent the total uncertainty in the quantities comprising Eq. (1) and consists of from the efficiency of the neutron detector, from the pile-up method that gives the number of -rays, and the statistical uncertainty in the number of detected neutrons. The statistical error ranges between 14 close to neutron threshold and 0.5 for higher energies. Except for the first few data points close to separation energy, the total error is dominated by the uncertainty stemming from the pile-up method and from the simulated efficiency of the neutron detector. For the total uncertainty, we have added these uncorrelated errors quadratically.
III Data analysis
The challenge now is to extract the deconvoluted, dependent, photo-neutron cross section, , from the integral of Eq. (1). Each of the measurements characterized by the beam energy, , correspond to folding of with the measured beam profile, .
By approximating the integral in Eq. (1) with a sum for each -beam profile, we are able to express the problem as a set of linear equations
| (2) |
where is the cross section folded with the beam profile D. The indexes and of the matrix element corresponds to and , respectively. The set of equations is given by
| (3) |
Each row of corresponds to a GEANT4 simulated beam profile belonging to a specific measurement characterized by . See Fig. 3 for a visual representation of the response matrix . It is clear that is highly asymmetrical. As mentioned, we have used beam energies when investigating 205Tl, but the beam profiles above is simulated for energies. As the system of linear equations in Eq. (3) is under-determined, the true vector cannot be extracted by matrix inversion. In order to find , we utilize a folding iteration method. The main features of this method are as follows:
-
1)
As a starting point, we choose for the 0th iteration, a constant trial function . This initial vector is multiplied with , and we get the 0th folded vector .
-
2)
The next trial input function, , can be established by adding the difference of the experimentally measured spectrum, , and the folded spectrum, , to . In order to be able to add the folded and the input vector together, we first perform a spline interpolation on the folded vector, then interpolate so that the two vectors have equal dimensions. Our new input vector is:
(4) -
3)
The steps 1) and 2) are iterated times giving
(5) (6) until convergence is achieved. This means that within the statistical errors. In order to quantitatively check convergence, we calculate the reduced of and after each iteration. Approximately four iterations are usually enough for convergence, which is defined when the reduced value approaches .
We stopped iterating when the started to be lower than unity. In principle, the iteration could continue until the reduced approaches zero, but that results in large unrealistic fluctuations in due to over-fitting to the measured points . To prevent the unfolding from introducing fluctuations that do not reflect nuclear properties, we apply a smoothing factor of 200-300 keV, which corresponds to the average of the full-width half maximum (FWHM) of the beams.
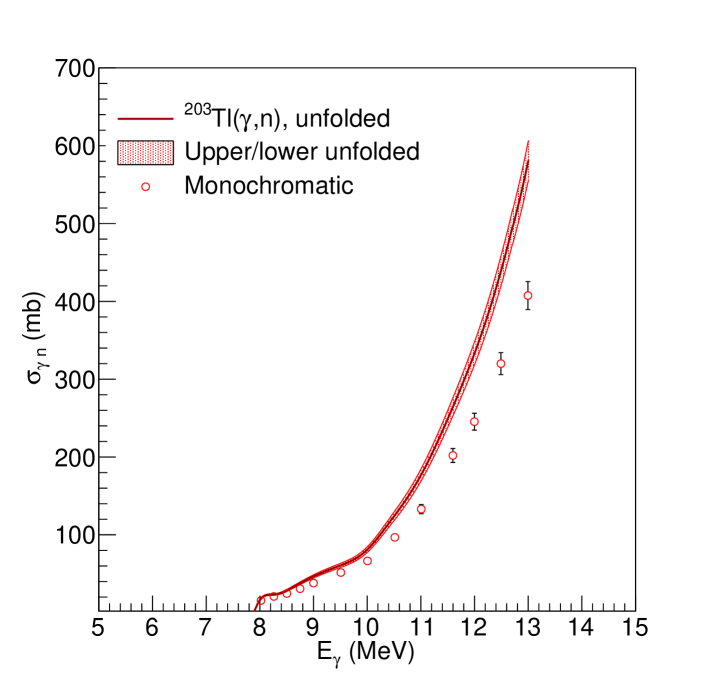
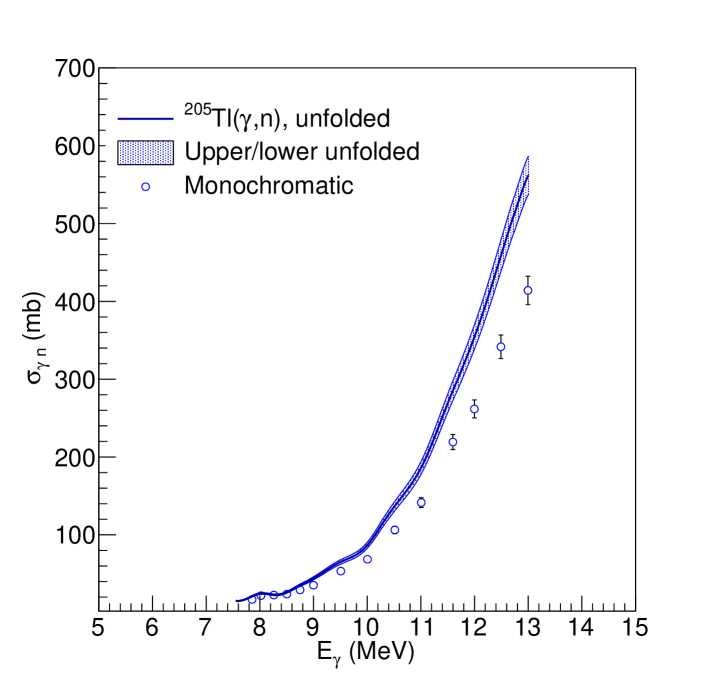
We estimate the total uncertainty in the unfolded cross sections by calculating an upper limit of the monochromatic cross sections from Fig.4 by adding and subtracting the errors to the measured cross section values. This upper and lower limit is then unfolded separately, resulting in the unfolded cross sections shown in Figs. 5 and 6.
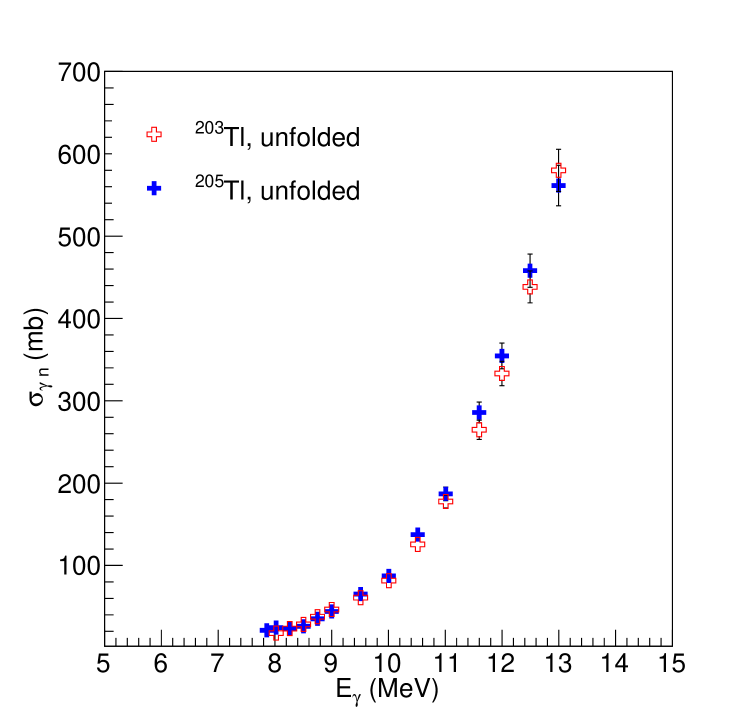
In Fig. 7, the two unfolded cross sections are evaluated at the maximum energies of the incoming beams. The error bars represent the difference between the upper and lower limit of the unfolded cross sections.
IV Discussion

The present experimental results are now analyzed in light of the recent systematics of the SF obtained within the mean field plus QRPA calculations based on the finite-range Gogny D1M interaction Martini16 ; Goriely16b ; Goriely18a . When compared with experimental data and considered for practical applications, the mean field plus QRPA calculations need some phenomenological corrections. These include a broadening of the QRPA strength to take the neglected damping of collective motions into account as well as a shift of the strength to lower energies due to the contribution beyond the 1 particle - 1 hole excitations and the interaction between the single-particle and low-lying collective phonon degrees of freedom. Such phenomenological corrections have been applied to the present Tl isotopes, as described in Ref. Goriely18a . In addition, in order to reproduce the present photoneutron cross section in the low-energy tail of the giant dipole resonance (GDR), we find that a global energy shift of 0.7 MeV of the overall strength and a reduction factor of 2 on the strength are required. Such renormalizations are within the uncertainties affecting the SF predictions Goriely18a and are applied to all the Tl SF studied in the present work.
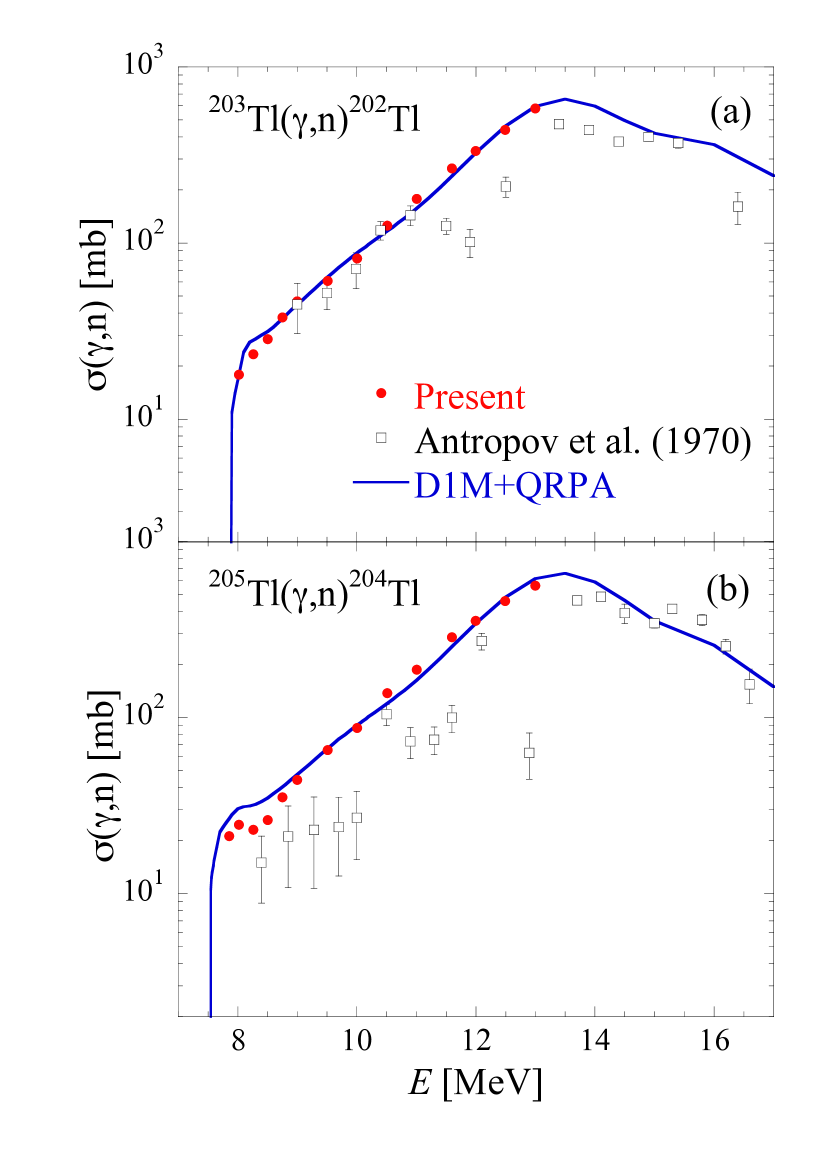
The resulting D1M+QRPA photoneutron cross section calculated with the TALYS reaction code Koning12 is shown in Fig. 8 for both (,n) and (,n). Although the fit is not perfect, D1M+QRPA calculation is seen to reproduce fairly well the dipole strength measured in the present study in the 8–13 MeV region. In contrast, major differences with the previous measurements Antropov70 can be observed, especially in the 11–13 MeV range, where significantly lower cross sections were extracted from this bremsstrahlung experiment. These former data were used to estimate the GDR peak cross section , peak energy , and width at half maximum in photoabsorption studies Plujko18 . For , mb, MeV and MeV were deduced, and for , mb, MeV and MeV. Based on our new measurements (Fig. 8), we find GDR parameters corresponding to mb, MeV, MeV for and mb, MeV and MeV for . Our lower value of the GDR peak energies lead to a SF at low energies significantly larger in comparison with what was extracted from the Antropov et al. data.
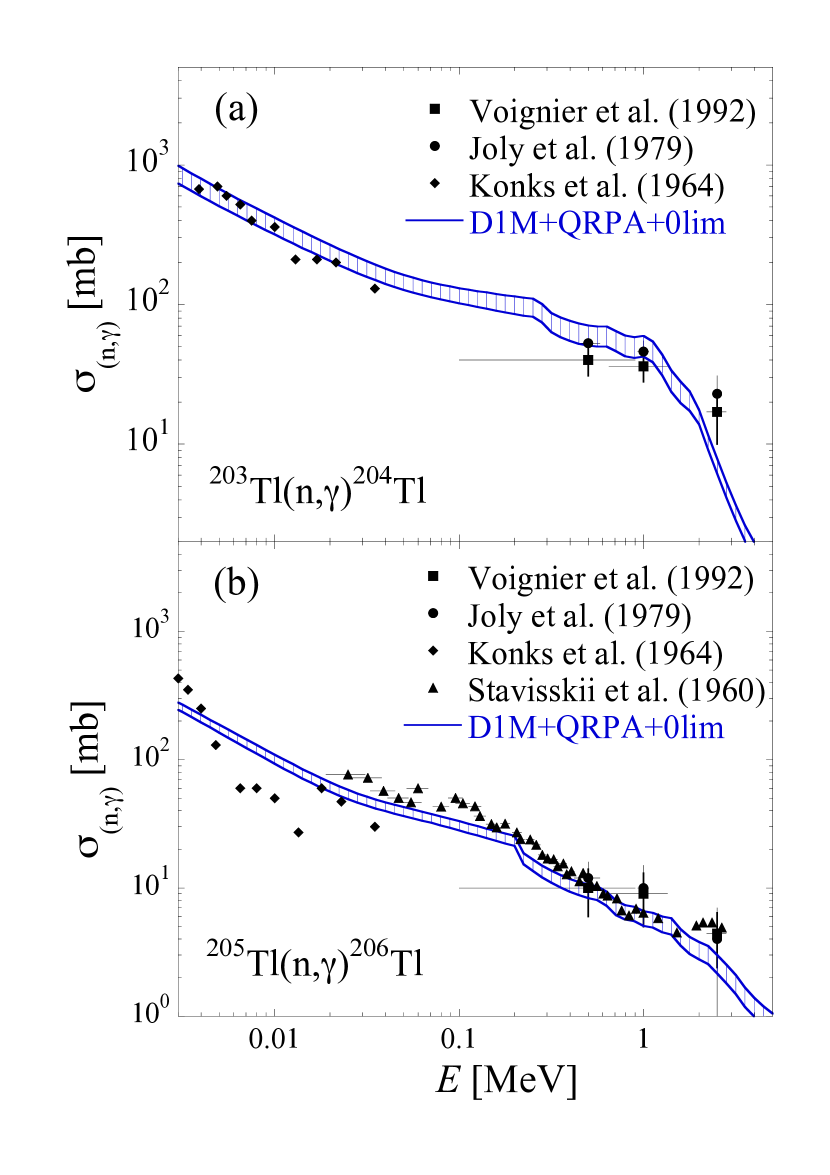
Another way of testing our photoneutron data is to consider the reverse radiative neutron capture cross sections. Those are also available for and , but depend on the de-excitation strength function of the compound nuclei and for which no experimental data exists. Nevertheless, we have considered the D1M+QRPA and strengths renormlaized in the same way as described above and applied to the calculation of the (n,) cross section. We compare in Fig. 9 the (n,) and (n,) measured cross sections with the TALYS Hauser-Feshbach calculation based on the D1M+QRPA+0lim strength functions and different nuclear level density prescriptions. All nuclear level densities Koning08 ; Goriely08 ; Hilaire12 are normalized to the existing s-wave spacing data at the neutron binding energy Capote09 . Also note that the D1M+QRPA photoabsorption strength needs to be complemented by the zero-limit correction when considering the de-excitation of the compound nucleus formed by the neutron capture. Inspired from shell model studies, this low-energy limit has been approximated in Ref. Goriely18a and when complementing the QRPA calculation, the final SF is referred to as D1M+QRPA+0lim. As shown in Fig. 9, the calculated cross sections are in rather good agreement with experimental data in the keV region.
Such a comparison also increases our confidence on the relevance of our new measurements and the corresponding theoretical D1M+QRPA+0lim SF adjustment and allows us to estimate the radiative neutron capture cross section of the s-process branching point . We show in Fig. 10 the Maxwellian-averaged cross section predicted with the D1M+QRPA+0lim strength function (red lines) as a function of the temperature . The hashed area reflects the sensitivity of the predictions with respect to different nuclear density models Koning08 ; Goriely08 ; Hilaire12 . We also compare in Fig. 10 our predictions with the one recommended by the compilation of Bao et al. Bao00 widely used for nucleosynthesis applications. Both calculations are seen to be compatible. Based on our experimentally constrained cross section, we can therefore confirm previous nucleosynthesis predictions using the (n,) rate of Bao et al. Bao00 , hence the possible impact of the branching point on the s-process production of and .
V Conclusion
We presented a new experimental determination of the cross section for 203Tl and 205Tl performed at the NewSUBARU synchrotron radiation facility. Our new measurements cover the low-energy tail of the GDR above the neutron threshold and give significantly different cross sections in comparison with the previous bremsstrahlung experiment of Ref. Antropov70 . The GDR parameters have been re-estimated leading to significantly lower GDR peak energies and larger peak cross sections. The new cross sections have been used to constrain the E1 and M1 strength functions obtained within the D1M+QRPA approach. We have further confirmed the relevance of the experimentally constrained D1M+QRPA dipole -ray strength function by analyzing the radiative neutron capture cross sections for Tl isotopes considering in addition the zero-limit systematics for both the de-excitation E1 and M1 strengths. Finally, the present analysis was used to estimate the Maxwellian-averaged (n,) cross section, which is of direct relevance to the 205Pb – 205Tl chronometry, which can now be considered to be rather reliably determined.
VI Acknowledgments
The authors are grateful to H. Ohgaki of the Institute of Advanced Energy, Kyoto University for making a large volume LaBr3(Ce) detector available for the experiment. H.U. acknowledges the support from the Premier Project of the Konan University. S.G. acknowledges the support from the F.R.S.-FNRS. G.M.T. acknowledges funding from the Research Council of Norway, Project Grant Nos. 262952. A.C.L. acknowledges funding from ERC-STG-2014, grant agreement No. 637686. This work was supported by the IAEA and performed within the IAEA CRP on “Updating the Photonuclear data Library and generating a Reference Database for Photon Strength Functions” (F41032).
References
- (1) G.A. Bartholomew, E.D. Earle, A.J. Fergusson, J.W. Knowles, mad M.A. Lone, Adv. Nucl. Phys. 7, 229 (1973).
- (2) M.A. Lone, Proc. 4th Int. Symp., Smolenice, Czechoslovakia, 1985, J. Kristin, E. Betak (eds.), D. Reidel, Dordrecht, Holland (1986) 238.
- (3) R. Capote, M. Herman, P. Obloz̆inský, P.G. Young, S. Goriely, T. Belgya, A.V. Ignatyuk, A.J. Koning, S. Hilaire, V.A. Plujko, M. Avrigeanu, O. Bersillon, M.B. Chadwick, T. Fukahori, Zhigang Ge, Yinlu Han, S. Kailas, J. Kopecky, V.M. Maslov, G. Reffo, M. Sin, E.Sh. Soukhovistskii, P. Talou, Nuclear Data Sheets 110, 3107 (2009).
- (4) S. Goriely, S. Hilaire, S. Péru, K. Sieja, Phys. Rev. C 98 (2018) 014327.
- (5) D.M. Brink, Ph.D thesis, Oxford University, 1955.
- (6) P. Axel, Phys. Rev. 126, 671 (1962).
- (7) A. Voinov, E. Algin, U. Agvaanluvsan, T. Belgya, R. Chankova, M. Guttormsen, G. E. Mitchell, J. Rekstad, A. Schiller, and S. Siem, Phys. Rev. Lett. 93, 142504 (2004).
- (8) M. Guttormsen, R. Chankova, U. Agvaanluvsan, E. Algin, L. A. Bernstein, F. Ingebretsen, T. Lönnroth, S. Messelt, G. E. Mitchell, J. Rekstad, A. Schiller, S. Siem, A. C. Sunde, A. Voinov, and S. Ødegård, Phys. Rev. C 71, 044307 (2005).
- (9) E. Algin, U. Agvaanluvsan, M. Guttormsen, A. C. Larsen, G. E. Mitchell, J. Rekstad, A. Schiller, S. Siem, and A. Voinov, Phys. Rev. C 78, 054321 (2008).
- (10) R. Schwengner, S. Frauendorf, and A. C. Larsen, Phys. Rev. Lett. 111, 232504 (2013).
- (11) B. A. Brown and A. C. Larsen, Phys. Rev. Lett. 113, 252502 (2014).
- (12) K. Sieja, Phys. Rev. Lett. 119, 052502 (2017).
- (13) K. Sieja, Europhys. J. Web Conf. 146, 05004 (2017).
- (14) S. Karampagia, B. A. Brown, and V. Zelevinsky, Phys. Rev. C 95, 024322 (2017).
- (15) R. Schwengner, S. Frauendorf, and B. A. Brown, Phys. Rev. Lett. 118, 092502 (2017).
- (16) N. Mowlavi, S. Goriely, and M. Arnould, Astron. Astrophys. 330, 206 (1998).
- (17) M. Arnould, G. Paulus, G. Meynet, Astron. Astrophys. 321, 452 (1997).
- (18) E. Anders, C.M. Stevens, J. Geophys. Res. 65, 3043 (1960).
- (19) R.G. Ostic, H.M. El-Badry, T.P. Kohman, Earth Planetary Sci. Letters 7, 72 (1969).
- (20) J.M. Huey, T.P. Kohman, Earth Planetary Sci. Letters 16, 401 (1972).
- (21) K. Takahashi, K. Yokoi, Nucl. Phys. A 404, 578 (1983).
- (22) R. Daudel, P. Benoist, R. Jacques, M. Jean, Compt. rend. 224, 1427 (1947).
- (23) J.N. Bahcall, Phys. Rev. 124, 495 (1961).
- (24) K. Yokoi, K. Takahashi, M. Arnould, Astron. Astrophys. 145, 339 (1985).
- (25) H. Utsunomiya, S. Goriely, H. Akimune, H. Harada, F. Kitatani, S. Goko, H. Toyokawa, K. Yamada, T. Kondo, O. Itoh, M. Kamata, T. Yamagata, Y.-W. Lui, I. Daoutidis, D. P. Arteaga, S. Hilaire, and A. J. Koning, Phys. Rev. C 82, 064610 (2010).
- (26) H. Utsunomiya, S. Goriely, H. Akimune, H. Harada, F. Kitatani, S. Goko, H. Toyokawa, K. Yamada, T. Kondo, O. Itoh, M. Kamata, T. Yamagata, Y.-W. Lui, S. Hilaire, and A. J. Koning, Phys. Rev. C 81, 035801 (2010).
- (27) H. Utsunomiya, S. Goriely, M. Kamata, H. Akimune, T. Kondo, O. Itoh, C. Iwamoto, T. Yamagata, H. Toyokawa, Y.-W. Lui, H. Harada, F. Kitatani, S. Goko, S. Hilaire, and A. J. Koning, Phys. Rev. C 84, 055805 (2011).
- (28) H. Utsunomiya, S. Goriely, T. Kondo, C. Iwamoto, H. Akimune, T. Yamagata, H. Toyokawa, H. Harada, F. Kitatani, Y.-W. Lui, A. C. Larsen, M. Guttormsen, P. E. Koehler, S. Hilaire, S. P?ru, M. Martini, and A. J. Koning, Phys. Rev. C 88, 015805 (2013).
- (29) D. M. Filipescu, I. Gheorghe, H. Utsunomiya, S. Goriely, T. Renstrøm, H.-T. Nyhus, O. Tesileanu, T. Glodariu, T. Shima, K. Takahisa, S. Miyamoto, Y.-W. Lui, S. Hilaire, S. Péru, M. Martini, and A. J. Koning, Phys. Rev. C 90, 064616 (2014).
- (30) H.-T. Nyhus, T. Renstrøm, H. Utsunomiya, S. Goriely, D. M. Filipescu, I. Gheorghe, O. Tesileanu, T. Glodariu, T. Shima, K. Takahisa, S. Miyamoto, Y.-W. Lui, S. Hilaire, S. Péru, M. Martini, L. Siess, and A. J. Koning, Phys. Rev. C 91, 015808 (2015).
- (31) H. Utsunomiya, T. Shima, K. Takahisa, D.M. Filipescu, O. Tesileanu, I. Gheorghe, H.-T. Nyhus, T. Renstrøm, Y.-W. Lui, Y. Kitagawa, S. Amano, S. Miyamoto, IEEE Trans. Nucl. Sci. 61, 1252 (2014).
- (32) A. I. Gheorghe, PhD thesis: Nuclear data obtained with Laser Compton Scattered gamma-ray beams, Ph.D. thesis, University of Bucharest (2017), unpublished.
- (33) J. Allison et al., IEEE T. Nucl. Sci. 53, 270 (2006).
- (34) O. Itoh, H. Utsunomiya, H. Akimune, T. Kondo, M. Kamata, T. Yamagata, H. Toyokawa, H. Harada, F. Kitatani, S. Goko, C. Nair, and Y.-W. Lui, Journal of Nuclear Science and Technology 48, 834 (2011).
- (35) B. L. Berman, J. T. Caldwell, R. R. Harvey, M. A. Kelly, R. L. Bramblett, and S. C. Fultz, Phys. Rev. 162, 1098 (1967).
- (36) H. Utsunomiya, I. Gheorghe, D. M. Filipescu, T. Glodariu, S. Belyshev, K. Stopani, V. Varlamov, B. Ishkhanov, S. Katayama, D. Takenaka, T. Ari-izumi, S. Amano, S. Miyamoto, Nuclear Instruments and Methods in Physics Research Section A 871, 135 (2017).
- (37) T. Kondo, H. Utsunomiya, H. Akimune, T. Yama- gata, A. Okamoto, H. Harada, F. Kitatani, T. Shima, K. Horikawa, and S. Miyamoto, Nuclear Instruments and Methods in Physics Research Section A 659, 462(2011).
- (38) H. Utsunomiya, T. Watanabe, T. Ari-izumi, D. Takenaka, T. Araki, K. Tsuji, I. Gheorghe, D. M. Filipescu, S. Belyshev, K. Stopani, D. Symochko, H. Wang, G. Fan, T. Renstrøm, G. M. Tveten, Y.-W. Lui, K. Sugita, S. Miyamoto, Nuclear Instruments and Methods in Physics Research Section A 896, 103 (2018).
- (39) G. P. Antropov, I. E. Mitrofanov, A. I. Prokofev, V. S. Russkikh Izv. Akad. Nauk SSSR, Ser. Fiz 34 (1970) 116 (Bull. Acad. Sci. USSR, Phys. Ser. 34 (1970) 108).
- (40) J. Voignier, S. Joly, G. Grenier, Nuclear Science and Engineering 112 (1992), 87
- (41) S. Joly, J. Voignier, G. Grenier, D.M. Drake, L. Nilsson, Nuclear Science and Engineering 70 (1979)
- (42) V.A. Konks, F.L. Shapiro, Zhurnal Eksperimental‘noi i Teoret. Fiziki 47 (1964) 795
- (43) Yu.Ya. Stavisskii, V.A. Tolstikov, Atomnaya Energiya 9 (1960) 401
- (44) M. Martini, S. Péru, S. Hilaire, S. Goriely, and F. Lechaftois, Phys. Rev. C 94, 014304 (2016).
- (45) S. Goriely, S. Hilaire, S. Péru, M. Martini, I. Deloncle, and F. Lechaftois, Phys. Rev. C 94, 044306 (2016).
- (46) A.J. Koning, D. Rochman, Nuclear Data Sheets 113, 2841 (2012).
- (47) V.A. Plujko, O.M. Gorbachenko, R. Capote, P. Dimitriou, Atomic Data and Nuclear Data Tables 123 (2018) 1
- (48) A.J. Koning, S. Hilaire, S. Goriely, Nucl. Phys. A 810, 13 (2008).
- (49) S. Goriely, S. Hilaire, and A.J. Koning, Phys. Rev. C 78, 064307 (2008).
- (50) S. Hilaire, M. Girod, S. Goriely, and A.J. Koning, Phys. Rev. C 86, 064317 (2012).
- (51) R. Capote, M. Herman, P. Oblozinsky, et al., Nuclear Data Sheets 110, 3107 (2009).
- (52) Z.Y. Bao, H. Beer, F. Käppeler, F. Voss, K. Wisshak, T. Rauscher, At. Data Nucl. Data Tables 75, 1 (2000).