key
Massive MIMO Forward Link Analysis
for Cellular Networks
Abstract
This paper presents analytical expressions for the signal-to-interference ratio (SIR) and the spectral efficiency in macrocellular networks with massive MIMO conjugate beamforming, both with a uniform and a channel-dependent power allocation. These expressions, which apply to very general network geometries, are asymptotic in the strength of the shadowing. Through Monte-Carlo simulation, we verify their accuracy for relevant network topologies and shadowing strengths. Also, since the analysis does not include pilot contamination, we further gauge through Monte-Carlo simulation the deviation that this phenomenon causes with respect to our results, and hence the scope of the analysis.
I Introduction
The tedious and time-consuming nature of system-level performance evaluations in wireless networks is exacerbated with massive MIMO [1, 2, 3, 4, 5, 6, 7, 8, 9, 10, 11, 12, 13], as the number of active users per cell becomes hefty and the dimensionality of the channels grows very large. This reinforces the interest in analytical solutions, and such is the subject of this paper. To embark upon the analysis of massive MIMO settings, we invoke tools from stochastic geometry that have been successfully applied already in non-MIMO [14, 15, 16, 17, 18, 19, 20] and in MIMO contexts [21, 22, 23, 24].
We present expressions for the forward-link signal-to-interference ratio (SIR) and the spectral efficiency in macrocellular networks with massive MIMO conjugate beamforming, both with a uniform and a channel-dependent power allocation, and for different alternatives concerning the number of users per cell. The derived expressions apply to very general network geometries in the face of shadowing. These expressions allow:
-
•
Testing and calibrating system-level simulators.
-
•
Determining how many cells need to be simulated for some desired accuracy in terms of interference: the analysis subsumes an infinite field of cells whereas simulators necessarily feature a finite number thereof, which, if too small, results in a deficit of interference and in consequently optimistic performance predictions.
-
•
Gauging the impact of parameters such as the path loss exponent.
-
•
Optimizing the number of active users as a function of the number of antennas and the path loss exponent.
-
•
Assessing the benefits of a channel-dependent power allocation.
At the same time, the analysis is not without limitations, chiefly that pilot contamination is not accounted for. We explore this aspect by contrasting our analysis with simulation-based results that include the contamination, thereby delineating the scope of our results.
The paper is organized as follows. The network and channel models are introduced in Section II and the forward-link conjugate beamforming SIRs, for uniform and equalizing power allocations, are derived in Section III. Building on some preliminary analysis presented in Section IV, Sections V–VI subsequently characterize the SIR distributions for fixed and Poisson-distributed numbers of users in each cell. The SIRs then lead to spectral efficiencies in Section VII. The applicability of the results to relevant network geometries is illustrated in Section VIII and the impact of noise and pilot contamination is assessed in Section IX. Finally, Section X concludes the paper.
II Network Modeling
We consider a macrocellular network where each base station (BS) is equipped with antennas while users feature a single antenna.
II-A Large-scale Modeling
The BS positions form a stationary and ergodic point process of density , or a realization thereof, say a lattice network. As a result, the density of BSs within any region converges to as this region’s area grows [25]. In turn, the user positions conform to an independent point process of density , also stationary and ergodic. Altogether, the models encompass virtually every macrocellular scenario of relevance.
Each user is served by the BS from which it has the strongest large-scale channel gain, and we denote by the number of users served by the th BS.
The large-scale channel gain includes path loss with exponent and shadowing that is independent and identically distributed (IID) across the links. Specifically, the large-scale gain between the th BS and the th user served by the th BS is
| (1) |
with the path loss intercept at a unit distance, the link distance, and the shadowing coefficient satisfying , where we have introduced . When expressed in dB, the shadowing coefficients have a standard deviation of . In the absence of shadowing, and .
Without loss of generality, we declare the th BS as the focus of our interest and, for notational compactness, drop its index from the scripting. For the large-channel gains, for instance, this means that:
-
•
relates the BS of interest with the th user served by the th BS.
-
•
relates the th BS with the th user served by the BS of interest.
-
•
relates the BS of interest with its own th user.
-
•
is the number of users served by the BS of interest.
The same scripting and compacting is applied to other quantities.
Let us consider an arbitrary user served by the BS of interest. It is shown in [25, 26, 27] that, as , irrespective of the actual BS positions, the propagation process from that user’s vantage, specified by and seen as a point process on , converges to what the typical user—e.g., at the origin—would observe if the BS locations conformed to a homogeneous PPP on with density . Moreover, by virtue of independent shadowing in each link, as the propagation process from the vantage of each user becomes independent from those of the other users. Relying on these results, we embark on our analysis by regarding the propagation processes
| (2) |
as IID and Poisson, anticipating that the results be applicable under relevant network geometries and realistic values of ; this is validated in Section VIII.
II-B Number of Users per BS
The modeling of is a nontrivial issue. Even in a lattice network with equal-size cells, and let alone in irregular networks, disparities may arise across BSs because of the shadowing and the stochastic nature of the user locations.
In the absence of shadowing, the users served by a BS are those within its Voronoi cell, and their number—conditioned on the cell area—is a random variable with mean times the cell area; for instance, it is a Poisson random variable if is a PPP [16]. Depending on how the cell area is distributed, then, the distribution of the number of users per cell can be computed. For instance, if is PPP, such number in a lattice network is Poisson-distributed with mean while, for an irregular network with PPP-distributed BSs, the corresponding distribution is computed approximately in [28, 29].
With shadowing, a user need not be served by the BS in whose Voronoi cell it is located. Remarkably though, with strong and independent shadowing per link, a Poisson distribution with mean turns out to be a rather precise model—regardless of the BS locations—for the number of users per BS. This is because, as the shadowing strengthens, it comes to dominate over the path loss and, in the limit, all BSs become equally likely to be the serving one. Consider a region of area having BSs and users, all placed arbitrarily. As , the number of users served by each BS becomes binomially distributed, , because each user has equal probability of being served by any of the BSs. Now, letting while keeping constant, the binomial distribution converges to the Poisson distribution [16].
In accordance with the foregoing reasoning, which is formalized in [30], we model as IID Poisson random variables with mean . Noting that the unbounded tail of the Poisson distribution needs to be truncated at , because such is the maximum number of users that can be linearly served by a BS with antennas, our analysis is conducted with Poisson and subsequently we verify the accuracy against simulations where the truncation is effected (see Examples 10 and 12). For the BS of interest specifically, we apply the Poisson PMF (probability mass function)
| (3) |
whose corresponding CDF (cumulative distribution function) is
| (4) |
where is the upper incomplete gamma function.
II-C Small-scale Modeling
Let us focus on the local neighborhood of the th user served by the BS of interest, wherein the large-scale gains apply. Without loss of generality, a system-level analysis can be conducted from the perspective of this user, which becomes the typical user in the network once we uncondition from .
Upon data transmission from the BSs, such th user observes
| (5) |
where is the (normalized) reverse-link channel vector, is its forward-link reciprocal, and is AWGN. The signal vector emitted by the th BS, intended for its users, satisfies where is the per-base transmit power.
III Conjugate Beamforming
III-A Transmit Signal
The signal transmitted by the th BS is
| (6) |
where is the power allocated to the data symbol , which is precoded by and intended for its th user. The power allocation satisfies
| (7) |
and, with conjugate beamforming and an average power constraint,
| (8) |
where are the channel estimates gathered by the th BS from the reverse-link pilots transmitted by its own users.
III-B SIR
We consider receivers reliant on channel hardening [1], whereby user served by the BS of interest regards as its precoded channel, with the expectation taken over the small-scale fading. The fluctuations of the actual precoded channel around this expectation constitute self-interference, such that (9) can be elaborated into
| (10) |
and the SINR is
| (11) |
with
| (12) |
As indicated, the analysis in this paper ignores pilot contamination. It follows that, in interference-limited conditions (), the conjugate beamforming precoders at BS are
| (13) |
from which
| (14) | ||||
| (15) |
and
| (16) | ||||
| (17) | ||||
| (18) |
while, because of independence between user and other users , for both and it holds that
| (19) |
Altogether, in interference-limited conditions,
| (20) |
which, invoking (7), further reduces to
| (21) |
The foregoing ratio of channel gains can be seen to equal
| (22) | ||||
| (23) | ||||
| (24) |
with
| (25) |
being the local-average SIR in single-user transmission [21]. Hence, (21) can be rewritten as
| (26) |
Two different power allocations, meaning two different formulations for , are analyzed in this paper; the corresponding SIRs are presented next.
III-B1 Uniform Power Allocation
With a uniform power allocation, and
| (27) |
III-B2 Equal-SIR Power Allocation
Alternatively, the SIRs can be equalized by setting [31]
| (28) | ||||
| (29) |
Plugged into (26), this power allocation yields an SIR, common to all the users served by the BS of interest, of
| (30) |
Introducing the harmonic mean of , namely
| (31) |
we can rewrite (30) as
| (32) |
Having formulated the SIRs for given large-scale link gains, let us next characterize the system-level performance by releasing the conditioning on those gains.
| 3.5 | 0.571 | -0.672 |
| 3.6 | 0.556 | -0.71 |
| 3.7 | 0.540 | -0.747 |
| 3.8 | 0.526 | -0.783 |
| 3.9 | 0.513 | -0.819 |
| 4 | 0.5 | -0.854 |
| 4.1 | 0.488 | -0.888 |
| 4.2 | 0.476 | -0.922 |
IV Spatial Distribution of
As the SIR formulations in (27) and (30) indicate, a key ingredient is the distribution of . To characterize this distribution, we capitalize on results derived for the typical user in a PPP-distributed network of BSs [21, 20], in accordance with the PPP convergence exposed in Section II-A. Specifically, are regarded as IID with CDF , where is the local-average SIR of the typical user in such a network [21, 20].111Our analysis focuses on the typical cell, rather than the typical user (or, more precisely, the typical location). However, thanks to the Poisson convergence for strong shadowing, the propagation point process as seen from a user in the typical cell is statistically the same as that seen from the typical location in a shadowless PPP. In the sequel, we employ a slightly simplified version of the result in [21, Eq. 18] as presented next.
Lemma 1.
[21] Define as the solution—common values are listed in Table I—to
| (33) |
where is the lower incomplete gamma function. The CDF of satisfies
| (37) |
where ”” indicates asymptotic () equality while
| (38) |
with the Gauss hypergeometric function. Setting
| (39) |
we ensure and the CDF can be taken as constant therewithin.
As an alternative to the foregoing characterization, an exact but integral form can be obtained for .
Lemma 2.
| (40) |
where denotes imaginary part and is the confluent hypergeometric or Kummer function.
Proof.
See Appendix A.
V Spatial SIR Distributions with Fixed
To begin with, let us characterize the SIR distributions for a fixed number of served users. Besides having their own interest, the ensuing results serve as a stepping stone to their counterparts for conforming to the Poisson or to any other desired distribution.
V-A Uniform Power Allocation
Starting from (27), we can determine the CDF of as
| (41) | ||||
| (44) |
which depends on and only through their ratio, .
Now, invoking Lemmas 1–2, we can express the SIR distribution for the typical user in a massive MIMO network with fixed and a uniform power allocation.
Proposition 1.
The CDF of with a fixed satisfies
| (48) |
with constant value within . Alternatively, the CDF can be computed exactly as
| (49) |
With either of these expressions, one can readily compute the percentage of users achieving a certain local-average performance for given and . Furthermore, one can establish minima for given and given some target performance at a desired user percentile.
Example 1.
Let . In order to ensure that no more than of users experience an SIR below dB, it is required that .
V-B Equal-SIR Power Allocation
While an explicit expression such as (48) seems difficult to obtain for , an integral form similar to (49) is forthcoming.
What can be established explicitly is that, as with ratio ,
| (55) |
which follows from
| (56) | ||||
| (57) |
Example 2.
Note from the foregoing example that, for and onwards, over 90% of users have an within dB of its spatial average. Besides confirming the effectiveness of the simple SIR-equalizing power allocation for massive MIMO, this allows establishing rather accurately by directly equating to the desired SIR.
VI Spatial SIR Distribution with Poisson-distributed
Let us now allow to adopt a Poisson distribution, which, as argued, captures well the variabilities caused by network irregularities and shadowing. Similar derivations could be applied to other distributions if, for instance, one wishes to further incorporate activity factors for the users or channel assignment mechanisms.
VI-A Uniform Power Allocation
Proposition 3.
Proof.
See Appendix D.
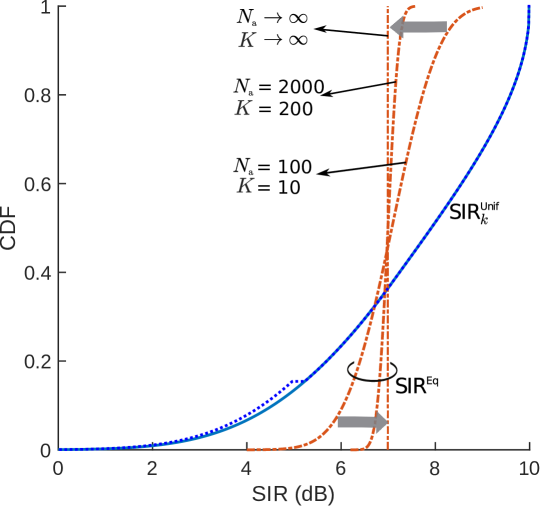
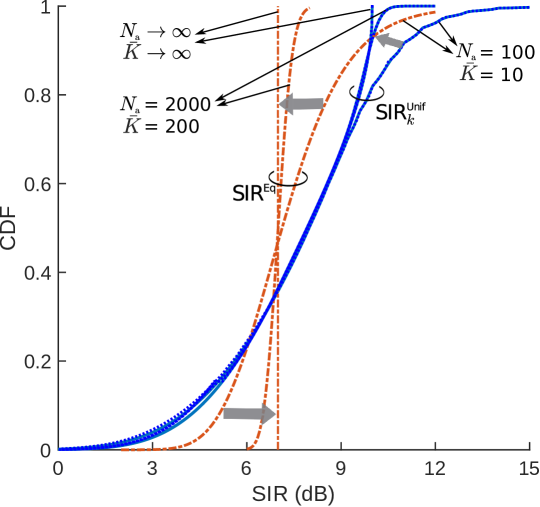
For with fixed , it can be verified that with convergence in the mean-square sense, and therefore in probability. As a consequence, , which depends on and only through their ratio, progressively behaves as if this ratio were fixed at despite the Poisson nature of . This behavior is clearly in display in Fig. 2, where can be seen to approach its value for fixed .
VI-B Equal-SIR Power Allocation
Proposition 4.
Again, because of the convergence for , hardens to its fixed- value with . In this case, this corresponds to as demonstrated in Fig. 2.
VII Spectral Efficiency
With each user’s SIR stable over its local neighborhood thanks to the channel hardening, the spectral efficiency of the typical user is directly
| (64) |
and the spatial distribution thereof can be readily obtained as
| (65) | ||||
| (66) |
for each setting considered in the foregoing sections.
Example 4.
Let , and . The -ile user spectral efficiency, computed by numerically solving for in and , respectively under uniform and equal-SIR power allocations, are b/s/Hz and b/s/Hz.
Example 5.
Reconsidering Example 4, but with being Poisson with mean , the -ile user spectral efficiencies, respectively under uniform and equal-SIR power allocations, are b/s/Hz and b/s/Hz.
From its user spectral efficiencies, the sum spectral efficiency at the BS of interest can be found as
| (67) |
which is zero whenever the BS serves no users.
Explicit expressions for the spatial averages of the user and the sum spectral efficiencies, and with expectation over all possible propagation processes, are presented next.
VII-A Average Spectral Efficiency: Uniform Power Allocation
Proposition 5.
With a uniform power allocation and a fixed , the spatially averaged user spectral efficiency equals
| (68) |
and the spatially averaged sum spectral efficiency is .
Proof.
See Appendix E.
For the special case of , i.e., for , Prop. 5 reduces to
| (69) |
thanks to , an equivalence that is further applicable in the characterizations that follow.
Since the denominator of the integral’s argument in (69), and more generally in (68), is strictly positive for , we can deduce by inspection that shrinks if we increase with a fixed , i.e., if we add more users with a fixed number of antennas. However, this reduction is sublinear in and thus grows as we add more users. Thus, should be set to the largest possible value that ensures an acceptable performance for the individual users—recall Example 1—and the corresponding average performance for both individual users and cells can then be readily computed by means of (68) or (69).
Example 6.
VII-B Average Spectral Efficiency: Equal-SIR Power Allocation
Proposition 6.
With an equal-SIR power allocation and a fixed , the spatially averaged user spectral efficiency equals
| (74) |
and the spatially averaged sum spectral efficiency is .
Proof.
See Appendix E.
For , recalling how the SIR hardens to , we have that hardens to
Expecting (74) over , via (3), gives
| (75) | ||||
| (76) |
In turn, the average sum spectral efficiency with expectation over (3) becomes
| (77) | ||||
| (78) |
Example 8.
| Poisson with | |||
|---|---|---|---|
| -ile b/s/Hz per user | 1.60 | 1.51 | |
| 2.20 | 1.94 | ||
| Average b/s/Hz per user | 2.76 | 2.84 | |
| 2.61 | 2.69 | ||
| Average b/s/Hz per BS | 27.6 | 27.08 | |
| 26.1 | 25.56 | ||
For the reader’s convenience, the results from Examples 7–8 are brought together in Table II, alongside the -ile user spectral efficiencies from Examples 4–5. Not surprisingly, with an equal-SIR power allocation, the -ile user spectral efficiency improves significantly, but the spatial average slips relative to a uniform power allocation. These results also corroborate the observation [31, Remark 4.1] that the sum spectral efficiency with a uniform power allocation is higher than with an equal-SIR power allocation. Fairness does come at a price.
VIII Application to Relevant Network Geometries
Let us proceed to verify, via Monte-Carlo, that the analytical results in the foregoing sections closely abstract the performance of network geometries of interest with practical values for the shadowing standard deviation. The number of network snapshots is chosen to ensure a % confidence interval of (absolute value) in the CDFs, which at the median corresponds to at most dB in SIR.
VIII-A Hexagonal Lattice Networks
Let the BS locations conform to a hexagonal lattice. In the following examples, Monte-Carlo results are generated for the users served by the BS at the center of a lattice of 499 hexagonal cells. The shadowing is lognormal.
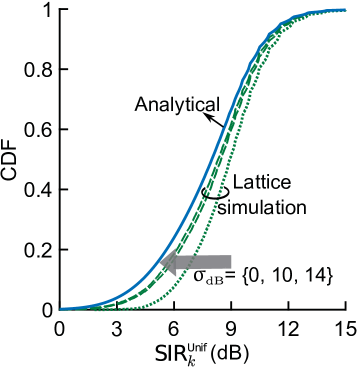
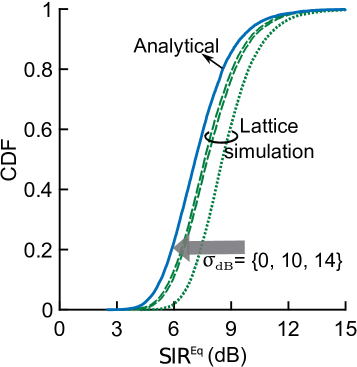
Example 9.
Let , and . To ensure a fixed , for every network snapshot users are dropped uniformly over the entire network until are being served by the central BS. Figs. 3a–3b demonstrate the convergence of the SIR CDFs to our characterizations of and in Props. 1–2, respectively. The dotted and dashed curves are respectively without ( dB) and with ( dB and dB) shadowing in the hexagonal network, while the solid curves correspond to our analytical characterizations.
Example 10.
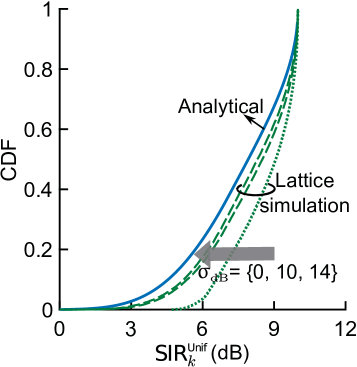
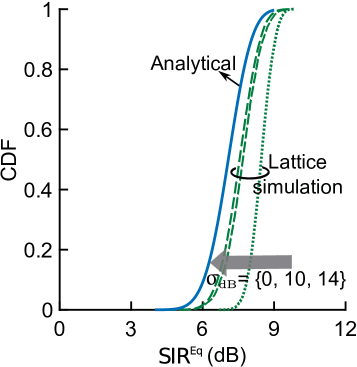
Still on a hexagonal network, let the users now conform to a PPP with density while , and . For each snapshot, the SIRs are computed for the users served by the central BS. (If there are over such users, a truncation takes place and of them are selected uniformly at random.) In Figs. 4a–4b we illustrate how, as the shadowing strengthens, the SIR CDFs obtained via simulation in this hexagonal network tend to the corresponding characterizations of and in Props. 3–4, respectively.
The closeness of our analytical abstractions (which correspond to ) to the behaviors with typical outdoor values of is conspicuous, similar to the corresponding observation made in the context of nonmassive single-user communication [21]. For dB, with either power allocation and regardless of whether is fixed or a truncated Poisson random quantity, the performance in a hexagonal network is within dB of our analytical characterizations. Furthermore, recalling that depends on and only via , the examples for a uniform power allocation correspond verbatim to any and related by a factor of .
We further note that Example 10 confirms the negligible loss in accuracy incurred by conducting the analysis with a pure Poisson distribution for , rather than the actual truncated distribution.
VIII-B PPP Networks
For an irregular deployment of BSs and the ensuing variability in cell sizes, let us consider a network where the BS locations are themselves Poisson distributed. Specifically, we consider , where is a homogeneous PPP and denotes the origin [33]. Then, by Slivnyak’s theorem, the central BS becomes the typical BS under expectation over . In the Monte-Carlo examples that follow, we drop BSs (500 on average) around the central BS and, as in the previous section, our focus is on the users associated with this central BS. The shadowing is lognormal.
Before proceeding, a relevant observation made in the absence of shadowing (whereby the users are confined to the serving BS’s Voronoi cell) is worth reproducing [33]: the BS-to-user link distances as perceived by user in the typical cell are distributed significantly differently from those seen from the typical location on , which underpin in our analysis. This effect manifests in the following examples, although only as a very slight deviation from the SIR CDF characterizations, and the convergence with shadowing is rather immediate.
Example 11.
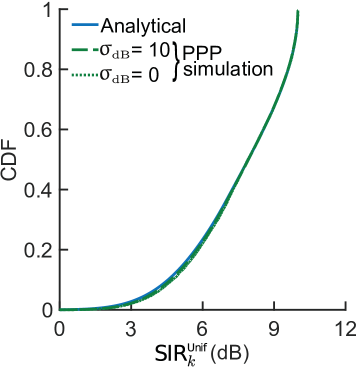
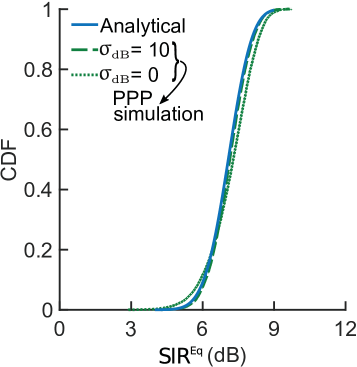
In the next example, where is allowed to be random, we validate the applicability of our results for a Poisson-distributed (Props. 3–4). As advanced in Section II-B, and expounded in more detail in [30], the simulated acquires its Poisson nature only as the shadowing intensifies. This causes a gap between analysis and simulation in the absence of shadowing, but this gap closes quickly as shadowing makes its appearance (cf. Figs. 6a–6b).
Example 12.
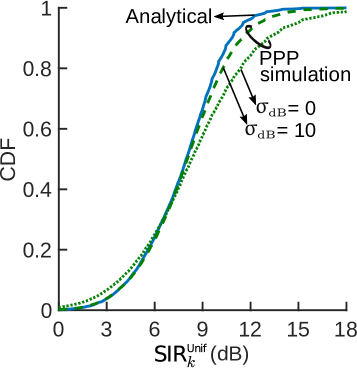
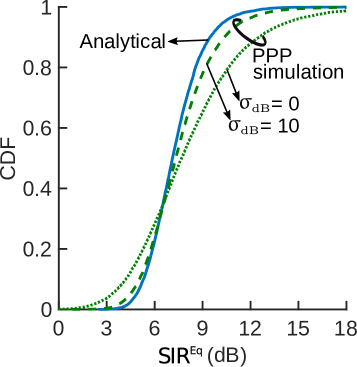
Consider again a PPP network of BSs, with the users conforming also to a PPP of density , and with , and . For each snapshot, the PPPs of BSs and users are realized over the whole network region and the SIRs are computed for the users served by the central BS with their number again truncated at . In Figs. 6a–6b we show how, as the shadowing strengthens, the SIR CDFs obtained via Monte-Carlo quickly tend to the corresponding characterizations in Props. 3–4, respectively for and .
IX Impact of Noise and Pilot Contamination
IX-A Noise
The interference-limited regime reflects well the operating conditions of mature systems, justifying our SIR-based analysis with thermal noise neglected. Nevertheless, for the sake of completeness, we herein corroborate that noise does not significantly alter the applicability of our expressions.
The signal-to-interference-plus-noise ratio (SINR) at the th user can be formulated as [13, Sec. 10.5.1]
| (79) |
where is the ratio between the forward- and reverse-link signal-to-noise ratios and the reverse-link pilots are assumed not to be power-controlled. With a uniform power allocation, the SINR specializes to
| (80) |
where, recall, . In turn, with an equal-SINR power allocation,
| (81) |
Example 13.
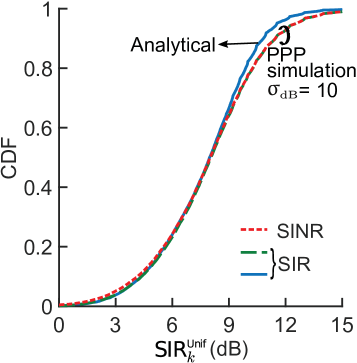
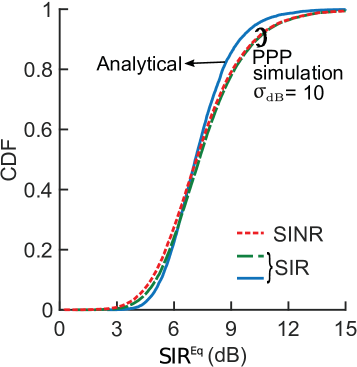
Reconsider Example 12 with BS. The path loss intercept is dB at km, which is a reasonable value for such BS density at around GHz. Each BS emits dBm on the forward link, the reverse-link pilot power is dB lower, and the noise figures at the user and BS receivers are and dB, respectively, such that dB. The bandwidth is the standard MHz of LTE, the noise power spectral density is dBm/Hz, and the BS antennas feature dBi of vertical gain, which adds to . The CDFs of and , respectively simulated via (80) and (81) with shadowing (), are plotted in Fig. 7 alongside their SIR counterparts replotted from Fig. 6.
As in the foregoing example, an excellent match between the SINRs and SIRs is observed for all other cases reported in the paper.
IX-B Pilot Contamination
Finally, in order to gauge the deviations that pilot contamination may bring about, we contrast our solutions with simulations that do incorporate contamination. Denoting by the set of indices of the BSs reusing the pilots of the th user of interest, when the LMMSE (linear minimum mean-square error) channel estimation incorporates the ensuing contamination [13, Sec. 10.5.1]
| (82) |
where the reverse-link pilots are again assumed not to be power-controlled. With a uniform power allocation, and with a fixed in all the contaminating cells, the above expression specializes to
| (83) |
while, with an equal-SIR power allocation,
| (84) |
IX-B1 Hexagonal Lattice Networks
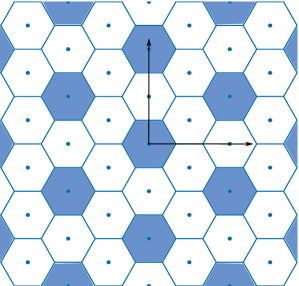
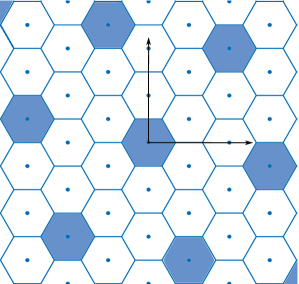
In lattice networks, regular pilot reuse patterns can be established. Precisely, we consider pilot reuse patterns whereby each pilot is used in only one cell within every cluster of adjacent cells. Such reuse patterns, illustrated in Fig. 8 for a hexagonal network with and , are implementationally convenient. And they are suboptimum in the face of shadowing, meaning that they are a conservative choice for our assessment; with a dynamic pilot assignment, the impact of contamination would abate even further.
Example 14.
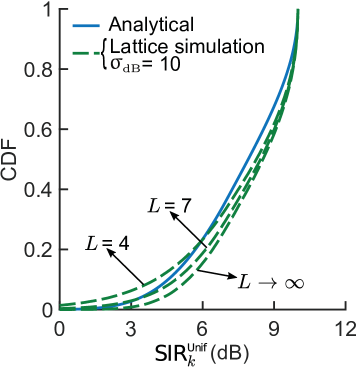
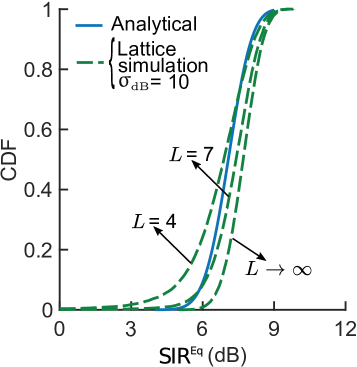
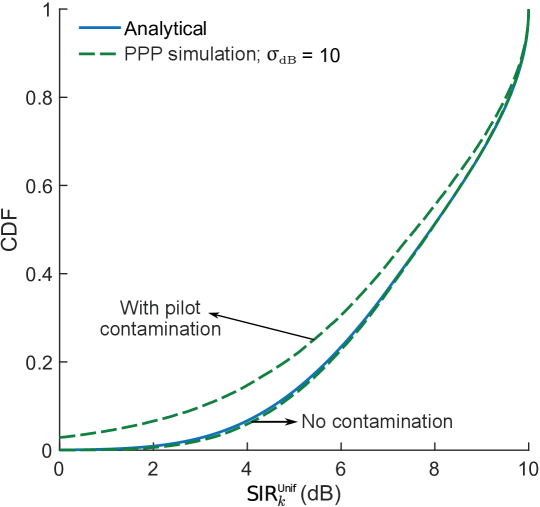
Consider again , and . CDFs of and with pilot contamination accounted for, respectively through (83) and (84), and computed via Monte-Carlo for a hexagonal network with shadowing ( = 10 dB) are plotted in Figs. 9a–9b. The results for pilot reuse factors and are plotted alongside their counterparts that forgo contamination (replotted from Fig. 3), namely the hexagonal simulation result with and the analytical curve.
For , and even for , the contamination is seen to have a minor effect. Our analysis is therefore applicable provided these reuse factors are feasible, and that is indeed the case over a broad operating range. For a fading coherence of symbols, which is a reasonably low value,222This value is obtained as with a wavelength of m, a coherence bandwidth of kHz, and a velocity of km/h. the pilot overhead equals . For and , and with the values of corresponding to or even antennas, such overhead is perfectly acceptable. For a condition determining the combinations of , , and under which the contamination has a minor effect with tighter pilot reuse patterns ( or even ), readers are referred to [13, Example 10.4].
IX-B2 PPP Networks
In nonlattice networks, the establishment of pilot reuse patterns requires site-specific planning on the part of the operator, or else some clustering algorithm [34]. As such schemes are well beyond the scope of our paper, the next example abstracts them and gauges the impact of contamination in a manner that is not specific to any pilot allocation approach.
Example 15.
Consider again a PPP network with , , and . For each network realization, out of 500 random pilot allocations (wherein each interfering BS belongs to with probability 1/7), we select the one minimizing the average contamination power per BS, computed as
| (85) |
where is the set of all mutually contaminating BSs including the central BS while is its cardinality. The effective pilot reuse factor becomes on average.
X Conclusion
While formally derived for interference-limited networks devoid of pilot contamination and asymptotic in the shadowing strength, the expressions presented in this paper for conjugate beamforming are broadly applicable, as confirmed by a multitude of examples. This broad applicability of the analysis makes its extension to other transmit and receive strategies, power allocations, user association policies, and even channel conditions, highly desirable.
Acknowledgment
The efficient editorial handling by Prof. Kaibin Huang and the excellent feedback provided by the reviewers are gratefully acknowledged.
Appendix A Proof of Lemma 2
Appendix B CDF via Numerical Inversion of Laplace Transform
Lemma 3.
[37, Prop. 1] The CDF of can be computed as
| (95) |
where while and for , and recall that is in (94). In turn, the parameters , and control the accuracy of the approximation. Suggested values for numerical Laplace transform inversions with many digits of precision are , and [38]. Following the recommendations of [39] for a 4-digit accuracy, a more relaxed—but still plentiful for our purposes—precision target, we obtain and , with as large as possible; as it turns out, moderate values of suffice to yield error levels that are negligible.
Appendix C Proof of Proposition 2
Appendix D Proof of Proposition 3
Appendix E Proof of Propositions 5 and 6
References
- [1] T. L. Marzetta, “Noncooperative cellular wireless with unlimited numbers of base station antennas,” IEEE Trans. Wireless Commun., vol. 9, no. 11, pp. 3590–3600, Nov. 2010.
- [2] E. G. Larsson, O. Edfors, F. Tufvesson, and T. L. Marzetta, “Massive MIMO for next generation wireless systems,” IEEE Commun. Mag., vol. 52, no. 2, pp. 186–195, Feb. 2014.
- [3] T. L. Marzetta, E. G. Larsson, H. Yang, and H. Q. Ngo, Fundamentals of Massive MIMO. Cambridge University Press, 2016.
- [4] L. Lu, G. Y. Li, A. L. Swindlehurst, A. Ashikhmin, and R. Zhang, “An overview of massive MIMO: Benefits and challenges,” IEEE J. Select. Topics Signal Processing, vol. 8, no. 5, pp. 742–758, Oct. 2014.
- [5] F. Rusek, D. Persson, B. K. Lau, E. G. Larsson, T. L. Marzetta, O. Edfors, and F. Tufvesson, “Scaling up MIMO: Opportunities and challenges with very large arrays,” IEEE Trans. Signal Processing, vol. 30, no. 1, pp. 40–60, Jan. 2013.
- [6] E. Björnson, L. Sanguinetti, J. Hoydis, and M. Debbah, “Optimal design of energy-efficient multi-user MIMO systems: Is massive MIMO the answer?” IEEE Trans. Wireless Commun., vol. 14, no. 6, pp. 3059–3075, Jun. 2015.
- [7] E. Björnson, J. Hoydis, and L. Sanguinetti, “Massive MIMO networks: Spectral, energy, and hardware efficiency,” Foundations and Trends in Signal Processing, vol. 11, no. 3-4, pp. 154–655, 2017.
- [8] J. Hoydis, S. ten Brink, and M. Debbah, “Massive MIMO in the UL/DL of cellular networks: How many antennas do we need?” IEEE J. Select. Areas Commun., vol. 31, no. 2, pp. 160–171, Feb. 2013.
- [9] K. T. Truong, A. Lozano, and R. W. Heath, “Optimal training in continuous flat-fading massive MIMO systems,” in European Wireless Conference, May 2014, pp. 1–6.
- [10] H. Q. Ngo and E. G. Larsson, “No downlink pilots are needed in TDD massive MIMO,” IEEE Trans. Wireless Commun., vol. 16, no. 5, pp. 2921–2935, May 2017.
- [11] E. Björnson, J. Hoydis, and L. Sanguinetti, “Massive MIMO has unlimited capacity,” IEEE Trans. Wireless Commun., vol. 17, no. 1, pp. 574–590, 2018.
- [12] K. Upadhya, S. A. Vorobyov, and M. Vehkaperä, “Downlink performance of superimposed pilots in massive MIMO systems,” IEEE Trans. Wireless Commun., vol. 17, no. 10, pp. 6630–6644, 2018.
- [13] R. W. Heath and A. Lozano, Foundations of MIMO Communication. Cambridge University Press, 2019.
- [14] J. G. Andrews, F. Baccelli, and R. K. Ganti, “A tractable approach to coverage and rate in cellular networks,” IEEE Trans. Commun., vol. 59, no. 11, pp. 3122–3134, Nov. 2011.
- [15] M. Haenggi, J. G. Andrews, F. Baccelli, O. Dousse, and M. Franceschetti, “Stochastic geometry and random graphs for the analysis and design of wireless networks,” IEEE J. Select. Areas Commun., vol. 27, no. 7, pp. 1029–1046, May 2009.
- [16] M. Haenggi, Stochastic Geometry for Wireless Networks. Cambridge, UK: Cambridge University Press, 2012.
- [17] J. S. Gomez, A. Vasseur, A. Vergne, P. Martins, L. Decreusefond, and W. Chen, “A case study on regularity in cellular network deployment,” IEEE Wireless Commun. Lett., vol. 4, pp. 421–424, Aug. 2015.
- [18] S. Mukherjee, “Distribution of downlink SINR in heterogeneous cellular networks,” IEEE J. Select. Areas Commun., vol. 30, no. 3, pp. 575–585, Apr. 2012.
- [19] H. ElSawy, E. Hossain, and M. Haenggi, “Stochastic geometry for modeling, analysis, and design of multi-tier and cognitive cellular wireless networks: A survey,” IEEE Commun. Surveys Tuts., vol. 15, no. 3, pp. 996–1019, Third Quarter 2013.
- [20] B. Błaszczyszyn and M. K. Karray, “Spatial distribution of the SINR in Poisson cellular networks with sector antennas,” IEEE Trans. Wireless Commun., vol. 15, no. 1, pp. 581–593, 2016.
- [21] G. George, R. K. Mungara, A. Lozano, and M. Haenggi, “Ergodic spectral efficiency in MIMO cellular networks,” IEEE Trans. Wireless Commun., vol. 16, no. 5, pp. 2835–2849, May 2017.
- [22] M. D. Renzo and P. Guan, “Stochastic geometry modeling and system-level analysis of uplink heterogeneous cellular networks with multi-antenna base stations,” IEEE Trans. Commun., vol. 64, pp. 2453–2476, Jun. 2016.
- [23] M. D. Renzo and W. Lu, “Stochastic geometry modeling and performance evaluation of MIMO cellular networks using the equivalent-in-distribution (EiD)-based approach,” IEEE Trans. Commun., vol. 63, pp. 977–996, Mar. 2015.
- [24] H. S. Dhillon, M. Kountouris, and J. G. Andrews, “Downlink MIMO HetNets: Modeling, ordering results and performance analysis,” IEEE Trans. Wireless Commun., vol. 12, pp. 5208–5222, Oct. 2013.
- [25] B. Błaszczyszyn, M. K. Karray, and H. P. Keeler, “Wireless networks appear Poissonian due to strong shadowing,” IEEE Trans. Wireless Commun., vol. 14, no. 8, pp. 4379–4390, Aug. 2015.
- [26] H. P. Keeler, N. Ross, and A. Xia, “When do wireless network signals appear Poisson?” Bernoulli, vol. 24, no. 3, pp. 1973–1994, Aug. 2018.
- [27] N. Ross and D. Schuhmacher, “Wireless network signals with moderately correlated shadowing still appear Poisson,” IEEE Trans. Inform. Theory, vol. 63, no. 2, pp. 1177–1198, Feb. 2017.
- [28] H. ElSawy, A. Sultan-Salem, M. S. Alouini, and M. Z. Win, “Modeling and analysis of cellular networks using stochastic geometry: A tutorial,” IEEE Communications Surveys Tutorials, vol. 19, no. 1, pp. 167–203, Firstquarter 2017.
- [29] H. ElSawy and E. Hossain, “Two-tier HetNets with cognitive femtocells: Downlink performance modeling and analysis in a multichannel environment,” IEEE Transactions on Mobile Computing, vol. 13, no. 3, pp. 649–663, Mar. 2014.
- [30] G. George, A. Lozano, and M. Haenggi, “Distribution of the number of users per base station in cellular networks,” IEEE Wireless Commun. Lett., vol. 8, no. 2, pp. 520–523, Apr. 2019.
- [31] H. Yang and T. L. Marzetta, “A macro cellular wireless network with uniformly high user throughputs,” in IEEE Veh. Techn. Conf. (VTC’14), Sep. 2014, pp. 1–5.
- [32] M. Haenggi, “The mean interference-to-signal ratio and its key role in cellular and amorphous networks,” IEEE Wireless Commun. Lett., vol. 3, no. 6, pp. 597–600, Dec. 2014.
- [33] Y. Wang, M. Haenggi, and Z. Tan, “The meta distribution of the SIR for cellular networks with power control,” IEEE Trans. Commun., vol. 66, no. 04, pp. 1745–1757, Apr. 2018.
- [34] M. Attarifar, A. Abbasfar, and A. Lozano, “Random vs structured pilot assignment in cell-free massive MIMO wireless networks,” IEEE Int’l Conf. on Commun. Workshops (ICCW’18), pp. 1–6, 2018.
- [35] J. Gil-Pelaez, “Note on the inversion theorem,” Biometrika, vol. 38, no. 3-4, pp. 481–482, 1951. [Online]. Available: http://dx.doi.org/10.1093/biomet/38.3-4.481
- [36] R. K. Ganti and M. Haenggi, “SIR asymptotics in Poisson cellular networks without fading and with partial fading,” in Proc. IEEE Int. Conf. Commun., May 2016.
- [37] R. K. Mungara, I. Thibault, and A. Lozano, “Full-duplex MIMO in cellular networks: System-level performance,” IEEE Trans. Wireless Commun., vol. 16, no. 5, pp. 3124–3137, May 2017.
- [38] J. Abate and W. Whitt, “Numerical inversion of Laplace transforms of probability distributions,” ORSA J. Compt., vol. 7, no. 1, pp. 36–43, 1995.
- [39] C. A. O'Cinneide, “Euler summation for Fourier series and Laplace transform inversion,” Commun. Statist. -Stochastic Models, vol. 13, no. 2, pp. 315–337, 1997.
- [40] K. A. Hamdi, “A useful lemma for capacity analysis of fading interference channels,” IEEE Trans. Wireless Commun., vol. 58, no. 2, pp. 411–416, Feb. 2010.