GBT Memo #301
The GBT Gain Curve at High Frequency
David T. Frayer, Frank Ghigo, & Ronald J. Maddalena (Green Bank Observatory)
2018 October 31
Abstract
Recent measurements at Q-band (43 GHz) have verified the improved performance of the GBT provided by the updated gravity model that was deployed in the fall of 2014. The measured gain curve is indistinguishable from 1.0 over an elevation range from 15∘ to 80∘. This represents a significant improvement on the previous gain curve from 2009 that showed decreasing efficiencies below 40∘ and above 65∘ elevation. The current estimated surface errors, under good conditions, is 230 m for the GBT.
1 Background
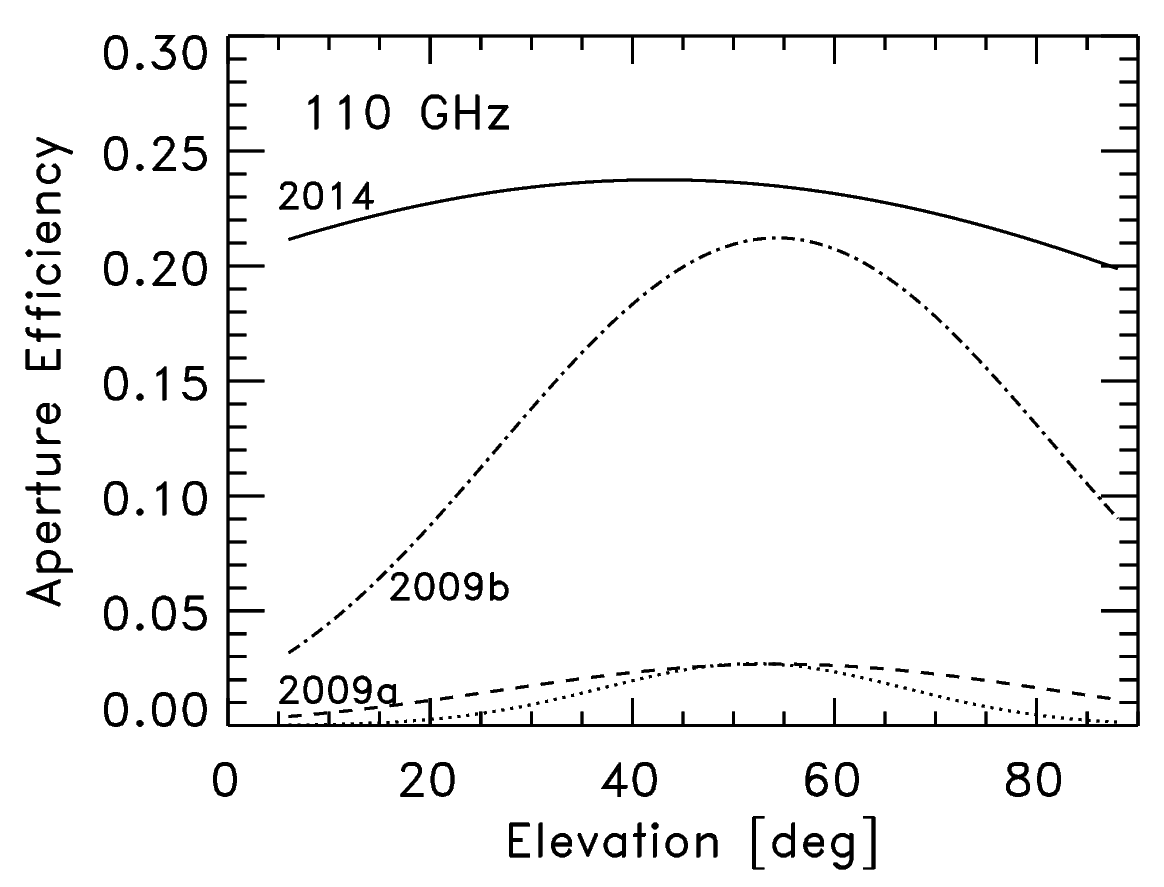
The performance of the Robert C. Byrd Green Bank Telescope (GBT)111The Green Bank Observatory is a facility of the National Science Foundation under cooperative agreement by Associated Universities, Inc. has improved significantly over the years with updates to the active surface model. Using only the GBT finite element model (FEM) for the surface, the aperture efficiency falls off from the peak efficiency value at an elevation of about due to large-scale gravitation deformations (Condon 2003; Balser, Prestage, & Nikolic 2005) [see dotted-line in Fig. 1]. Using the FEM model in combination with a Zernike-gravity model derived from out-of-focus holography (OOF) measurements of astronomical sources (Nikolic, Balser, & Prestage 2006; Nikolic et al. 2007) has vastly improved the performance of the GBT. After making the appropriate mechanical corrections to many of the 2209 surface actuators based on data from the 12 GHz holography system installed on the GBT (Schwab 2008), the effective surface error was improved from about 390 m to 240 m (Hunter et al. 2011). Before 2009, the GBT surface was not accurate enough for efficient observations at 3mm wavelengths, but after the implementation of Zernike-gravity model and using OOF measurements to derive residual “Thermal” Zernike coefficients for the current conditions of the telescope, aperture efficiencies of about 40% are obtainable.
After the improvements in 2009, the measured Q-band gain curve of the GBT was still not optimal (2009b dashed line in Figure 1). The 2009 gain curve is based on the 2005WinterV2 Gravity model. This model was replaced by the 2010WinterV1 model, but an updated Q-band gain curve was not derived for this model, and the results from the 2009 gain curve have continued to be used. After finishing the replacement of the sub-reflector actuators in 2013, a updated Zernike-gravity model (2014FallV1) was derived based on all AutoOOF observations after the actuator replacements (from Nov. 2013 through the the fall of 2014, Maddalena et al. 2014). The advantage of this model is that it was derived from many sets of observations which effectively averaged over a range of temperatures and conditions for the GBT. The 2014FallV1 model has proven successful during the 2015 through 2018 high-frequency observing seasons. The typical residual AutoOOF surface rms corrections have been small (100–250m) indicating the appropriateness of the model. In this memo, we derive a new Q-band gain curve for the GBT based on measurements using the updated 2014 gravity model.
2 Results
2.1 Q-band Gain Curve
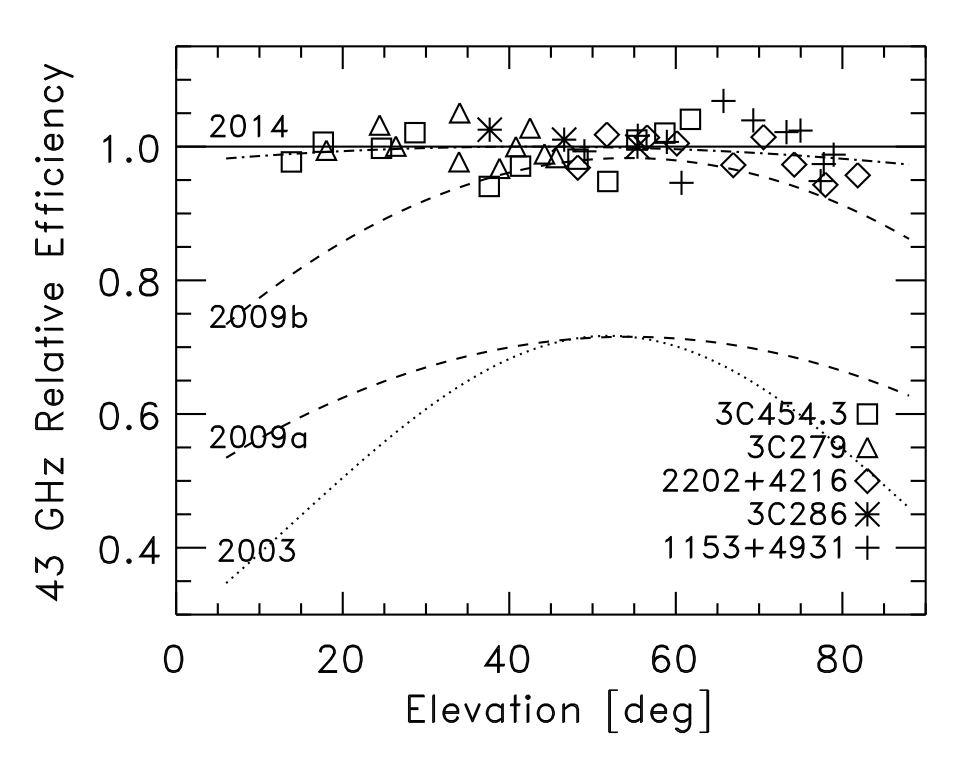
Figure 1 shows the results of the Q-band (43 GHz) gain-curve observations as a function of elevation. The data for 3C454.3 (2253+1608), 3C286, and 2202+4216 were taken as part of the Q-band program TGBT18A_503_01 observed 2018 May 25. All data have been corrected for the atmosphere and placed on the temperature scale.
| (1) |
where is the observed antenna temperature of the source, is the zenith opacity derived from the local weather database, and El is the elevation of the source. To avoid uncertainties associated with absolute flux calibration, the measurements for each source were normalized to the average value observed within the intermediate elevation range of 45∘–60∘ where the gain of the telescope is expected to be optimal. We found no significant drop in telescope efficiency at low elevation as previously seen in the 2009 gain curve. The results are consistent with a flat gain curve from 15∘ to 80∘ elevation. We do not have sufficient data to derive the gain curve above 80∘ or below 15∘. To confirm these results, we collected archival Q-band observations of 3C279 and 1153+4931 which are also plotted in Figure 1.
To facilitate comparisons with previous results, the data were fitted with a 2nd order polynomial as a function of zenith angle.
| (2) |
where ZD is the zenith angle in degrees, and A0, A1, and A2 are the fitted polynomial coefficients. Table 1 gives the fitted parameters along with their errors for the 2014 Zernike-gravity model. The gain curve has been normalized to a maximum value of 1.0. For comparison the previous 2009 coefficients are also tabulated. The gain-curves based on these coefficients are shown in Figure 1.
| A0 | A1 | A2 | |
|---|---|---|---|
| 2009 | 0.8618 | ||
| 2014 | 0.9710.020 | ( |
The average for all data plotted in Figure 1 is 0.997 with standard-deviation scatter of 0.030 (which implies a 3% uncertainty for an individual data point). The observational uncertainties derived here are less than those found for previous GBT Q-band gain-curve analyses (e.g., see gain-curve plot presented in Hunter et al. 2011, and the GBT PTCS wiki pages which typical report 15% observational errors). Each point plotted in Figure 1 represents an average of the two polarizations and for two peak scans. The normalization of values per source and per observing session also reduced the observational scatter significantly. The derived gain curve is independent of the absolute calibration of the source and aperture efficiency of the telescope at the time of observation.
| Surface Error | Aperture Efficiency | |||||
|---|---|---|---|---|---|---|
| [m] | 10 GHz | 30 GHz | 43 GHz | 80 GHz | 110 GHz | |
| 2003 | 390 | 69% | 56% | 43% | 13% | 3% |
| 2009a | 390 | 69% | 56% | 43% | 13% | 3% |
| 2009b | 240 | 70% | 65% | 59% | 37% | 21% |
| 2014 | 230 | 70% | 65% | 60% | 39% | 23% |
2.2 GBT Aperture Efficiency
The derived gain curve at 43 GHz can be used to predict the performance of the telescope at other frequencies as a function of elevation. Based on observations of sources with known flux density (), the derived aperture efficiency () for the GBT is
| (3) |
The aperture efficiency is related to the surface errors using the Ruze equation:
| (4) |
where the coefficient 0.71 is the aperture efficiency at long wavelengths for the GBT and is the rms uncertainty of the surface. Based on 43 GHz observations, Table 2 shows the derived aperture efficiency and corresponding surface errors for the telescope over time for the GBT. The Ruze equation was used to scale the 43 GHz results to other frequencies (Table 2).
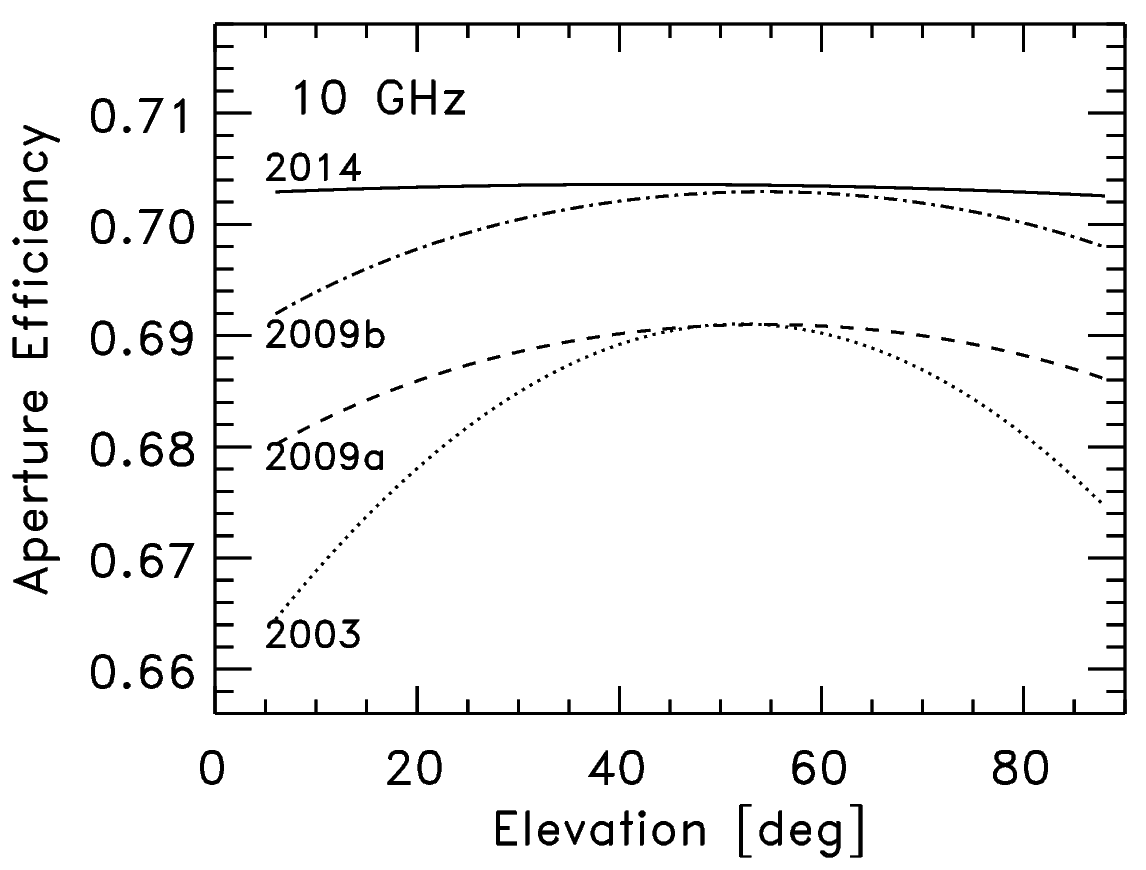
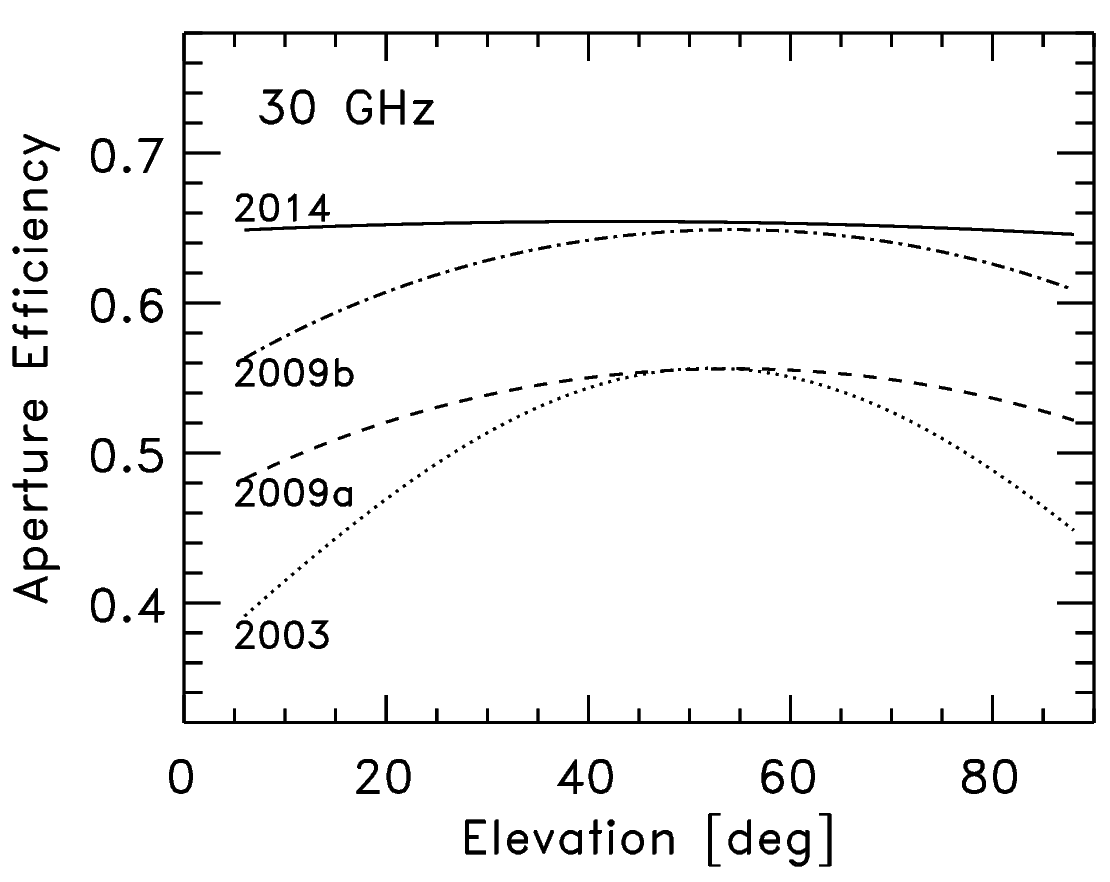
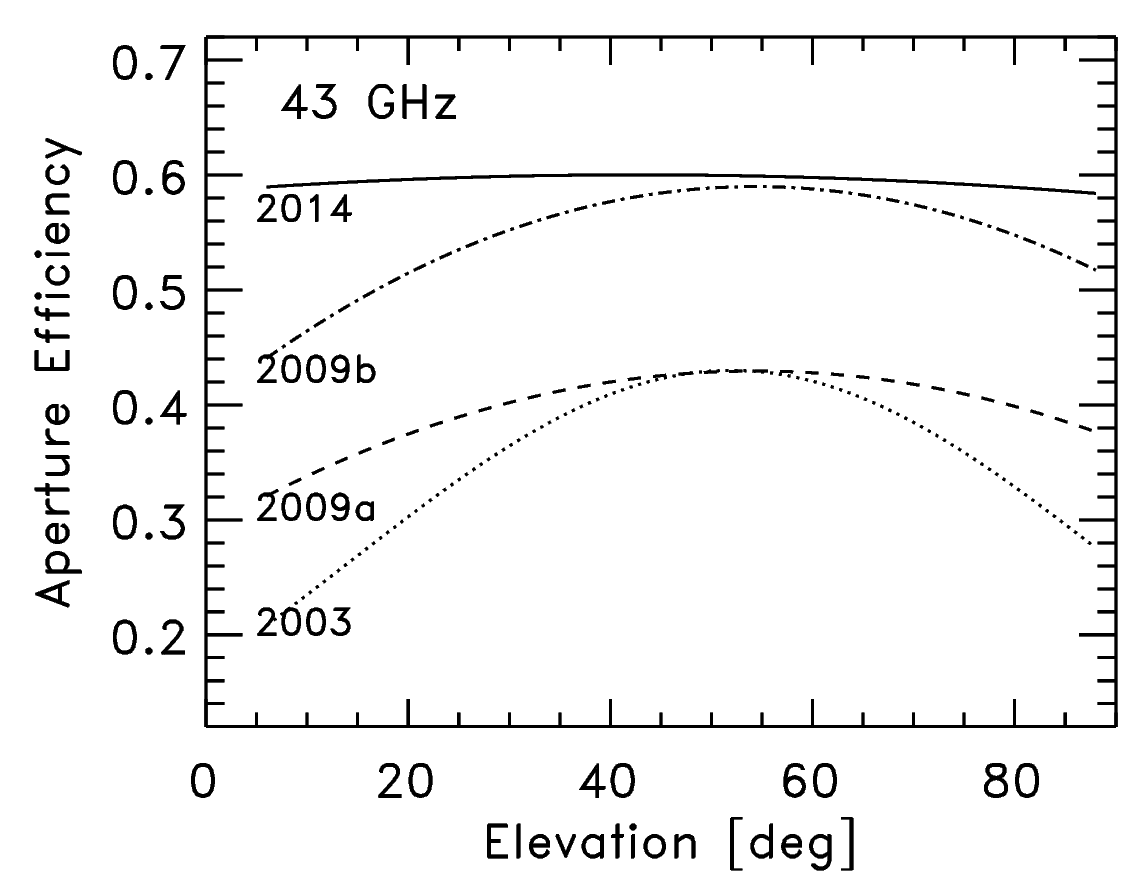
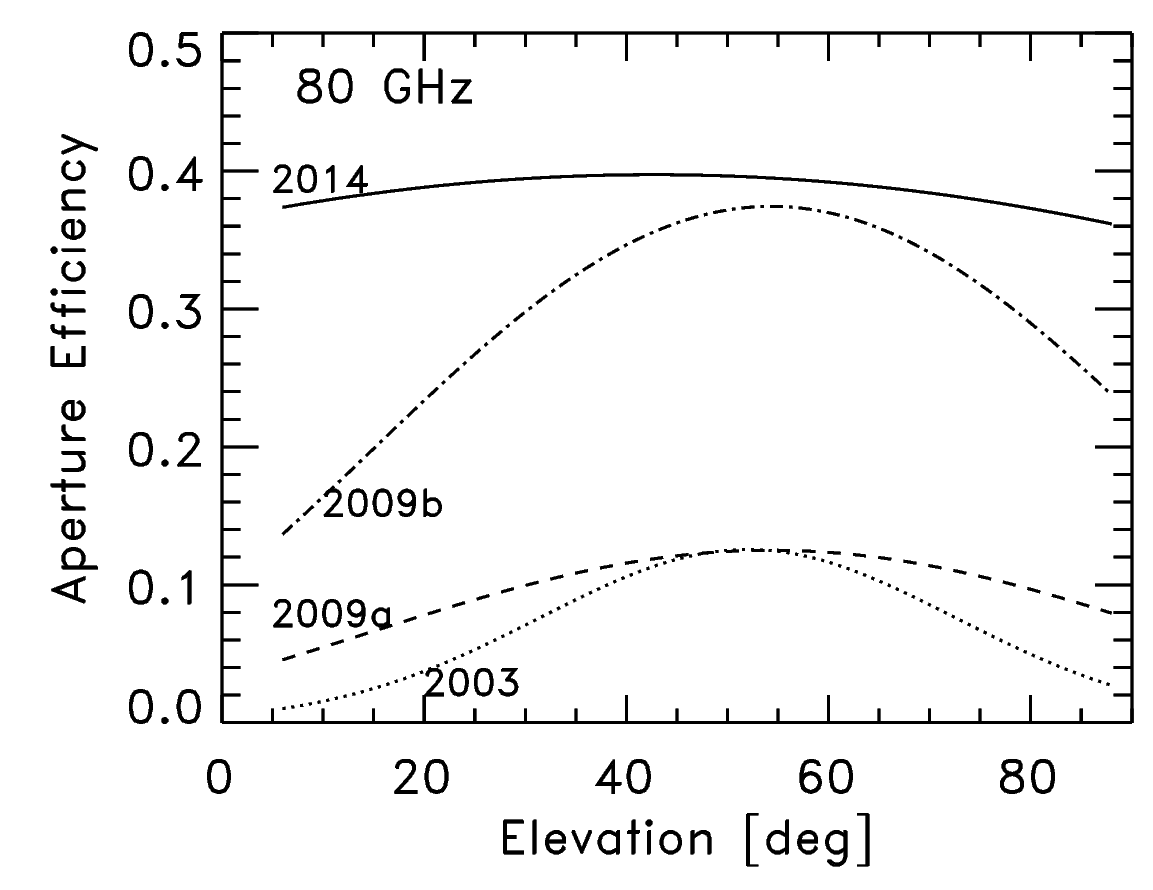
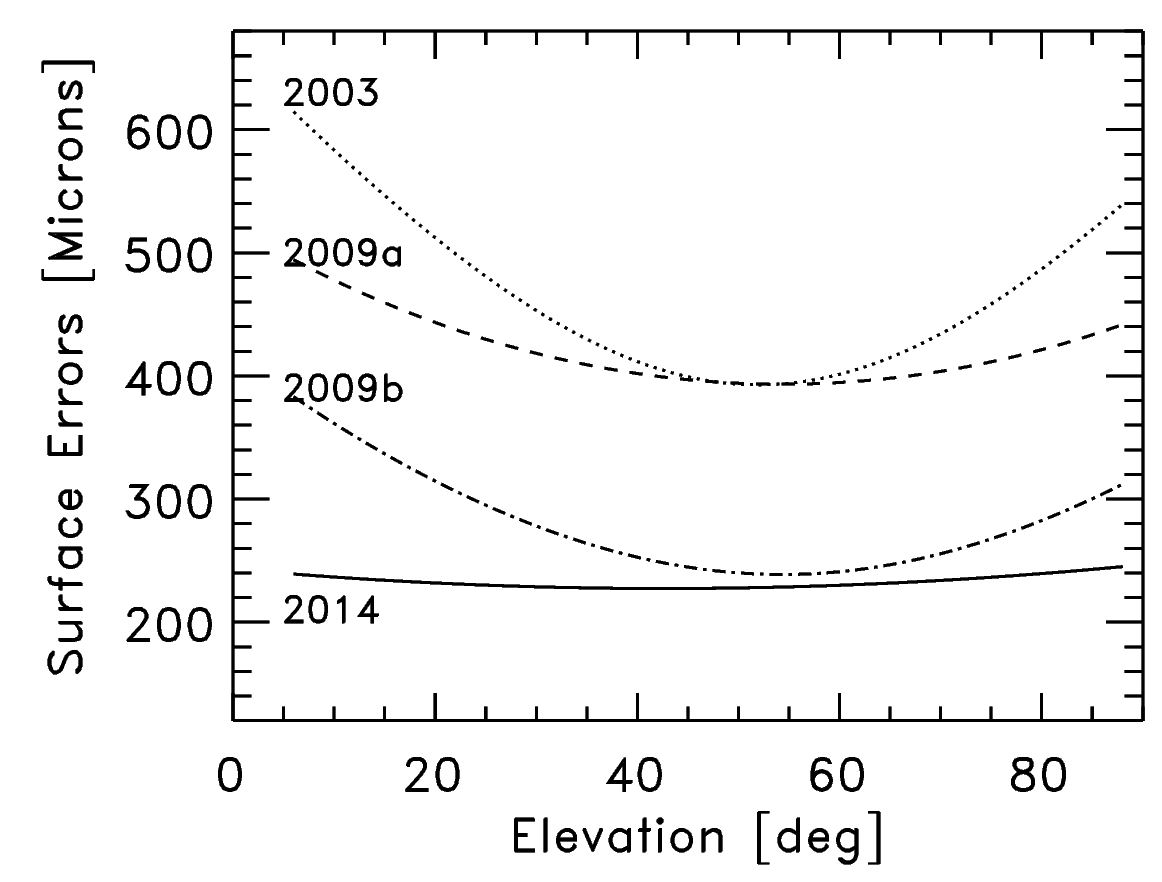
The efficiencies given in Table 2 are for the optimal elevation. The gain curves shown in Figure 1 have been used to derive the effective surface errors as a function of elevation (Figure 2), which are then used to derive the aperture efficiency as a function of elevation and frequency using the Ruze equation. These results are plotted in Figures 3-7.
3 Discussion
Previously, there were concerns that the AutoOOF solutions may not be applicable when observing sources at different elevations due to inadequacies of the Zernike-gravity model (see comments within the PTCS wiki pages over the last decade). The AutoOOF associated with the recent Q-band gain-curve observations (TGBT18A_503_01) was done at high elevation (80 deg), and we found no decrease in efficiency at low elevation. These results imply that the surface corrections from an AutoOOF at one elevation are applicable at other elevations, when using a good Zernike-gravity model.
The 2014FallV1 Zernike-gravity model used for this memo is vastly superior to the 2005WinterV2 Zernike-gravity model that was used for the 2009 gain-curve derivation. Unfortunately, the performance provided by the 2010WinterV1 Zernike-gravity model was never quantified with an accurate Q-band gain curve. However, based on archival data its performance is much closer to the the 2014FallV1 model than the 2005WinterV2 model. The deprecated 2014WinterV1 model should be avoided, since this model had poor performance.
4 Concluding Remarks
The observed 43 GHz gain curve is flat a function of elevation which validates the 2014FallV1 Zernike-gravity model. The performance of the GBT over the years has continued to be improved as refinements have been made to the active surface model. These improvements have made observations more efficient and have enabled 3mm observations with the GBT, which has motivated the development of new instrumentation on the GBT that operates within this band (e.g., Argus, Mustang-2, and the 4mm Receiver).
The observatory has recently received funding for an optical laser scanner that would permit more rapid monitoring of the surface (Green Bank Observatory News 2018). Once implemented this should help to maintained an accurate surface during long sets of observations and potentially permit efficient day-time observing for 3mm observations.
5 References
-
1.
Condon, J. 2003, GBT Efficiency at 43 GHz, GBT PTCS Project Note#31
-
2.
Balser, D., Prestage, R. M., & Nikolic, B. 2005, GBT Aperture Efficiency at Q-band (43 GHz), GBT PTCS Project Note#43
-
3.
Hunter, T. R., Schwab, F. R., White, S. D., et al. 2011, Holographic Measurement and Improvement of the Green Bank Telescope Surface, PASP, 123, 108
-
4.
Maddalena, R. J., Frayer, D. T., Lashley-Colhirst, N. & Norris, T. 2014, The Updated 2014 Gravity Model, GBT PTCS Project Note#76
-
5.
Nikolic, B., Balser, D. S., & Prestage, R. M. 2006, Out-Of-Focus Holography at the Green Bank Telescope, The Gain-Elevation Curve and Absolute Efficiency, GBT PTCS Project Note#47
-
6.
Nikolic, B., Prestage, R. M., Balser, D. S., Chandler, C. J., & Hills, R. E 2007, Out-of-Focus Holography at the Green Bank Telescope, A&A, 465, 685
-
7.
Schwab, F. R. 2008, Summer/Autumn 2006 GBT Panel Corner Setting Measurements, GBT PTCS Project Note#61