The radio-bright accreting millisecond X-ray pulsar IGR J175912342
Abstract
IGR J175912342 is a 527-Hz accreting millisecond X-ray pulsar that was discovered in outburst in 2018 August. In this paper, we present quasi-simultaneous radio and X-ray monitoring of this source during the early part of the outburst. IGR J175912342 is highly absorbed in X-rays, with an equivalent hydrogen absorption along the line of sight, , of 4.41022 cm-2, where the Galactic column density is expected to be 1 – 21022 cm-2. The high absorption suggests that the source is either relatively distant (6 kpc), or the X-ray emission is strongly absorbed by material local to the system. Radio emission detected by the Australia Telescope Compact Array shows that, for a given X-ray luminosity and for distances greater than 3 kpc, this source was exceptionally radio loud when compared to other accreting neutron stars in outburst ( erg s-1). For most reasonable distances, IGR J175912342 appeared as radio luminous as actively accreting, stellar-mass black hole X-ray binaries.
1 Introduction
Accreting millisecond X-ray pulsars (AMXPs) are binary systems in which a neutron star (NS) primary accretes material — often only sporadically — from a low-mass companion star. However, in contrast to the majority of known neutron star X-ray binaries (NSXRBs), these objects show X-ray pulsations as material is channelled from the disk onto the magnetic poles of the rotating NS (e.g. Wijnands & van der Klis, 1998). These objects are thought to be the link between accreting low-mass X-ray binaries (XRBs) and millisecond pulsars (MSPs; see Wijnands & van der Klis 1998; Patruno & Watts 2012, for review) where the transfer of angular momentum during the accreting XRB phase can spin up the NS to millisecond periods (e.g. Alpar et al. 1982; Radhakrishnan & Srinivasan 1982). This link has been exemplified, e.g., by the systems PSR J1023+0038 and M28I (IGR J18245-2452), which have been observed to transition between radio MSP and AMXP states on relatively short timescales (Archibald et al., 2009; Papitto et al., 2013; Stappers et al., 2014). Such transitional MSPs (tMSPs) are also thought to switch between accretion-powered and rotation-powered pulsar states.
AMXPs are typically transient, going through cycles of outburst and quiescence (e.g. in ’t Zand et al. 1998). During outburst, radio emission with a flat or inverted spectrum (, where the flux density, , scales with the frequency, , such that ) is observed (e.g. Tudor et al., 2017), indicative of a partially self-absorbed, compact jet (e.g. Blandford & Königl, 1979).
In their hard X-ray states at the beginning and end of a typical outburst, black hole (BH) XRBs exhibit a tight, non-linear relationship between their radio () and X-ray () luminosities that extends over several decades in luminosity (e.g. Gallo et al. 2012; Corbel et al. 2013). The observed empirical relationship is generally described by two distinct power-law tracks in the radio/X-ray luminosity plane; an upper ‘radio-loud’ track with a best fitting slope of and a lower, steeper, ‘radio-quiet’ track with a best fitting slope of (Gallo et al., 2012). However, recently the statistical significance of the two separate tracks has been questioned (Gallo et al., 2014; Gallo et al., 2018). Also, individual systems have shown significant deviation over luminosity ranges spanning 2 orders of magnitude (e.g. Corbel et al., 2013).
For accreting NSs the picture is even less clear. Not only is the connection complicated by the presence of a stellar surface/magnetosphere (e.g. Maccarone, 2008), but also NSs appear fainter in the radio than their BH counterparts (e.g. Fender & Kuulkers 2001; Migliari & Fender 2006), meaning that their / behaviour has generally been measured across a smaller dynamic range (and with lower detection significance) than their BH counterparts. Initially, a steep 1.4 correlation was suggested (Migliari & Fender, 2006). However, individual systems appear to show varying correlation indices and normalisations, and not all follow similar, or even well-defined tracks (e.g. Tudor et al., 2017). To try to account for the restricted luminosity ranges typically measured for NS systems, regression analysis of a large sample of NS systems showed that they as a whole appear to be a factor of 22 fainter than the population of hard state BHs, but with a similar correlation slope (Gallo et al., 2018).
The differences in both normalisation and slope for individual systems could be driven by a number of factors, such as jet power, primary mass, spin, magnetic field, and jet launching mechanism. Recent results showing faint radio jets being launched from a slowly-spinning high-magnetic field (1012 G) accreting NS indicate that the magnetic field or spin of the NS could be playing an important role in the radio brightness (van den Eijnden et al., 2018b).
1.1 IGR J175912342
IGR J175912342 was discovered in outburst by the INTErnational Gamma-Ray Astrophysics Laboratory (INTEGRAL) on 2018 August 10–11 (MJD 58340–58341), during monitoring of the Galactic center (Ducci et al., 2018). Archival all-sky Neil Gehrels Swift Observatory (Swift) Burst Alert Telescope (BAT) observations indicate that the outburst rose above detection threshold around 2018 July 22 (MJD 58321), 20 days earlier (Krimm et al., 2018). We observed the source at radio wavelengths using the Australia Telescope Compact Array (ATCA), detecting bright radio emission, leading to our initial suggestion that the source may be a BH candidate (Russell et al., 2018). However, coherent X-ray pulsations at 527.4 Hz (1.9 ms) detected using the Nuclear Spectroscopic Telescope Array (NuSTAR) and the Neutron star Interior Composition Explorer (NICER) identified this source as an AMXP (Sanna et al., 2018), with an orbital period of 8.8 hours and a companion mass of 0.42 M⊙. Assuming a 1.4 M⊙ NS mass and typical AMXP parameters, the spin frequency derivative implies a magnetic field of 1.410 B 8109 G (Sanna et al., 2018). After discovery, the source stayed active for 80 days, exhibiting some long term variability, including multiple re-brightenings.
In this paper, we discuss quasi-simultaneous radio and X-ray observations taken in the early stages of the outburst (spanning MJDs 58344–58356). The high X-ray absorption suggests that the source is relatively distant and therefore much more radio luminous than that from other known NS systems. We investigate the implications of this radio brightness in the context of other known XRBs.
2 Observations
2.1 ATCA radio observations
| Date | MJD | Frequency | Flux density | |
|---|---|---|---|---|
| (GHz) | (mJy) | |||
| 2018 Aug 14 | 58344.560.12 | 5.5 | 1.090.02 | 0.10.3 |
| 9.0 | 1.120.02 | |||
| 2018 Aug 19 | 58349.260.07 | 5.5 | 1.000.05 | 0.300.25 |
| 9.0 | 0.850.05 | |||
| 2018 Aug 25 | 58355.280.12 | 5.5 | 1.180.04 | 0.250.1 |
| 9.0 | 1.210.04 | |||
| 58355.280.10 | 17.0 | 1.540.10 | ||
| 19.0 | 1.600.09 |
We conducted DDT radio observations (project ID: CX413) with the Australia Telescope Compact Array (ATCA). IGR J175912342 was observed three times early in its outburst, on 2018 August 14, 19, and 25 (MJDs 58344, 58349, and 58355, respectively; see Table 1). The observations were taken at central frequencies of 5.5 and 9 GHz. The August 25 observations had additional frequencies of 17 and 19 GHz. Each frequency pair was taken simultaneously. All bands were recorded with a bandwidth of 2 GHz. PKS 1934638 was used for flux calibration, while phase calibration was carried out using 1817-254 on August 14 and with 1752-225 on August 19 and 25. The data were flagged and calibrated following standard procedures within the Common Astronomy Software Applications (CASA v4.7; McMullin et al. 2007).
For the August 14 observation the telescope was in a relatively extended (1.5D) configuration. Imaging was carried out with Briggs weighting (robust=0), minimising effects from diffuse emission in the field due to its location towards the Galactic center, providing angular resolutions of 6.8′′1.4′′at 5.5 GHz and 3.9′′0.9′′at 9 GHz (with a position angle 15 degrees North of East). The flux density was determined by fitting for a point source in the image plane using IMFIT. We measure a (9 GHz) right ascension (R.A.) and declination (Dec.) of:
R.A. (J2000) =17h59m02s.86 +/- 0.04,
Dec. (J2000) = -23∘43m08s.3 +/- 0.1,
where the uncertainties are from the fitted position of the point source, which are larger than the theoretical statistical error from beam centroiding.
For our August 19 and 25 observations, ATCA was in a compact (H75) configuration, where five of the six antennas are located within 75 meters of each other. Due to significant diffuse emission, imaging was not trivial. However, ATCA’s sixth antenna is located 6 km from the array core. Using only the longest baselines out to antenna six to eliminate issues from diffuse emission, we determined the flux by fitting for all sources in the field in the uv-plane using UVMULTIFIT (Martí-Vidal et al., 2014).
See Table 1 for source flux densities.
2.2 Swift X-ray observations
The Swift X-ray Telescope (XRT) observed IGR J175912342 every few days during the outburst (target IDs: 10803 and 10804). Observations closest in time to our ATCA monitoring (within 1 day) were extracted with the Swift-XRT online pipeline (Evans et al., 2009). We used the Swift-XRT online pipeline to create the lightcurve. The observations were conducted in photon counting (PC) mode.
To determine the X-ray flux of IGR J175912342 for epochs that were closest to the radio observation, we analysed the 0.5–10 keV spectra with XSPEC version 12.9 (Arnaud, 1996). The data were best fit with an absorbed (Wilms et al., 2000) powerlaw model; Tbabspowerlaw (C-stat/degrees of freedom = 269/240). The addition of a thermal component did not improve the fits, or change the results. X-ray fluxes were determined using the XSPEC convolution model cflux. Results are shown in Table 2. The equivalent hydrogen column density, , was tied between epochs (determined by jointly fitting all 17 Swift observations between MJDs 58342–58403). Leaving free gave similar results for all but the August 18 observation, where the low count-rate meant poor model constraints. Fixing to significantly different values produced poor fits and unphysical results.
| Absorbed | Unabsorbed | ||||
|---|---|---|---|---|---|
| Date | MJD | Obs ID | 1–10 keV Flux | 1–10 keV Flux | |
| (10-10) erg s-1 cm-2 | (10-10) erg s-1 cm-2 | ||||
| 2018 Aug 14 | 58344.6880.002 | 00010804002 | 1.550.15 | 1.98 | 2.96 |
| 2018 Aug 18 | 58348.2230.003 | 00010804004 | 2.10.3 | 0.79 | 1.43 |
| 2018 Aug 25 | 58355.5590.033 | 00010804006 | 2.00.15 | 1.840.09 | 3.300.13 |
3 Results and discussion
3.1 Radio and X-ray lightcurves
Following its initial X-ray detection, IGR J175912342 first brightened for a few days reaching an initial X-ray peak around August 14 (MJD 58344), around the time of the first Swift-XRT observation. IGR J175912342 then faded steadily over the next 5 days (Figure 1). The source then re-brightened, returning to a similar X-ray count rate as its initial X-ray peak, following which it remained detectable for the next 80 days.
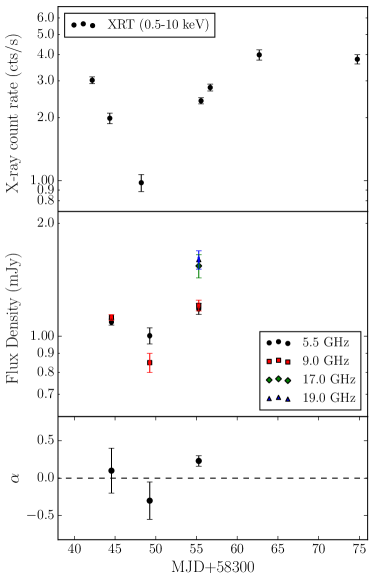
A few days after the initial X-ray peak, we conducted our first radio observation, detecting the source. Over the next 2 weeks, we observed IGR J175912342 a further two times. During these observations, the source showed a similar evolution as the X-rays, where the radio flux faded briefly, before re-brightening (Figure 1).
During our first ATCA observation the radio spectrum was consistent with flat (Figure 1 and Table 1). The spectrum steepened slightly at the time of our second radio observation, although signal to noise and frequency coverage meant poor constraints on the spectrum. During our final radio observation, we observed a significantly inverted radio spectrum. These observations imply partially self-absorbed synchrotron emission from a compact jet (e.g. Fender, 2001).
3.2 Location on the radio/X-ray plane
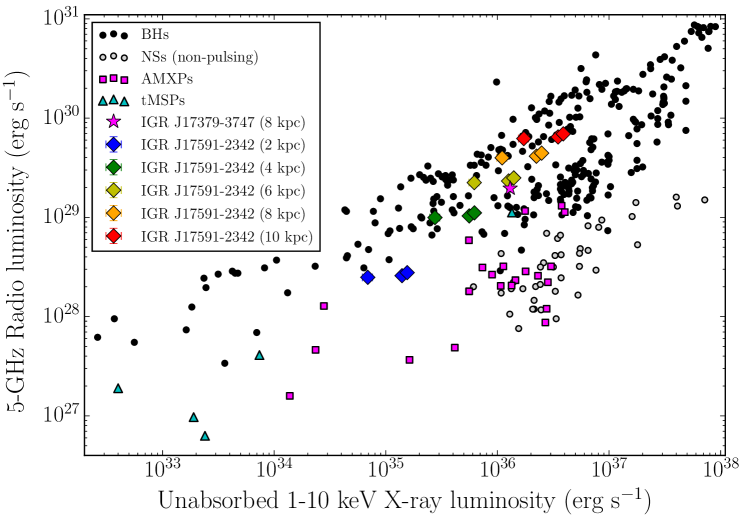
To investigate the and of IGR J175912342, we place the 5 GHz radio and 1-10 keV X-ray luminosities on the radio/X-ray plane using several assumed distances (Figure 2). Unfortunately, our contemporaneous observations sample only a very limited range of and (factors of only 1.1 and 2, respectively). Therefore, while we are unable to determine the specific scaling between the and with this monitoring, the radio brightness is interesting.
In terms of its radio and X-ray luminosities, for distances greater than 3 kpc, IGR J175912342 would be brighter in the radio than the majority of other accreting NS systems (Figure 2). At a such distances, its / ratio places IGR J175912342 in the region of parameter space occupied by BHXRBs. These results imply that IGR J175912342 was either considerably radio-loud during the early stages of its 2018 outburst, or it is closer than 3 kpc.
Comparing the observed radio emission from IGR J175912342 to the sample of AMXPs with reported radio detections (Figure 2, magenta squares), we see that IGR J175912342 appears to be more radio bright than all other NS systems for distances greater than 5 kpc, where this reduces to 3 kpc without the inclusion of the AMXP IGR J173793747. The recent radio detection of IGR J173793747 (van den Eijnden et al., 2018a) indicate this as another potentially radio bright AMXP (Figure 2, magenta star), where an 8 kpc distance upper-limit was estimated from type I X-ray bursts, assuming the peak flux of the bursts reached the empirical NS Eddington limit.
3.3 Absorption along the line of sight
The soft X-ray emission observed from IGR J175912342 is highly absorbed. Using ISM abundances from Wilms et al. (2000), we find a best fit from Swift-XRT data of =(4.40.3)1022 cm-2. This is consistent with results presented by Sanna et al. (2018), where the was determined to be (3.61.1)1022 cm-2 from INTEGRAL, NuSTAR, and Swift-XRT observations taken at similar times. Our result is marginally higher than that found using the NICER data taken on similar dates (August 15 and August 18), which gave (3.45)1022 cm-2 and (3.59)1022 cm-2, respectively (Sanna et al., 2018), agreeing at the 2- level. Chandra observations taken on August 23 find =(4.90.2)1022 cm-2 (Nowak et al., 2018), consistent within the errors of our measured value.
IGR J175912342 lies in the direction of the Galactic center (Ducci et al., 2018), with an unknown distance to the source. However, our modelled , which traces the interstellar gas along the line of sight, is 3–4 times higher than the expected Galactic contribution of Gal=1.12–1.441022 cm-2 (Dickey & Lockman, 1990; Kalberla et al., 2005; Willingale et al., 2013). While a difference between the measured and expected does not indicate the distance to the source, and the results may be dependent on the spectral model, it suggests that the source is not nearby. Converting between and optical extinction (Bahramian et al., 2015), we can also compare against higher resolution three-dimensional optical reddening maps (Green et al., 2018). From these maps we also find that the measured absorption is significantly higher than the expected line of sight Galactic reddening, where the total Galactic contribution from reddening maps corresponds to 2.21022 cm-2. In fact, along this line of sight, for a distance of 6 kpc, the Galactic contribution is expected to only be 71021 cm-2.
To further test the relationship with source distance, we compared the Gal (Dickey & Lockman, 1990; Kalberla et al., 2005; Willingale et al., 2013) to the published111To be consistent, when possible, from the literature were determined with Tbabs. for the 28 BH and NS XRBs with well estimated source distances222To test for differences between nearby and more distant objects. (Gandhi et al., 2018; Miller-Jones, 2014, and references therein). We find that in all cases but two (GRS 1915+105 and V4641 Sgr) the measured was either below or comparable to the expected Galactic line-of-sight absorption for these systems.
GRS 1915105 and V4641 Sgr are both atypical and relatively distant BHXRBs (6 kpc), where the measured X-ray absorption exceeds the expected line of sight absorption by a factor of 4–8 due to anomalously high elemental abundances (Orosz et al., 2001; Lee et al., 2002). For these systems, the overabundances are thought to be related to material in or near the local environment of the source (e.g. Mirabel et al., 1996; Martí et al., 2000; Lee et al., 2002). Other systems with unknown distances also exhibit higher than expected absorption, however, this is generally ascribed to their close proximity to the Galactic center (estimated from the high absorption; e.g. Miller et al. 2006), or are high-inclination ‘dipping’ sources (e.g. Parmar et al., 2002), where disk material or the donor star passes through the line of sight. However, IGR J175912342 does not display X-ray dips (Sanna et al., 2018), which are observed from high inclination systems, implying inclination is not the cause for the high .
There is some debate over the origin of the dominant X-ray absorber for XRBs, whether it be the ISM (even with highly ionized winds from the XRB; (e.g. Miller et al., 2009), or from gas intrinsic to the XRB (e.g. Luo & Fang, 2014). However, from the absorption, we favour the scenario in which IGR J175912342 is not nearby (6 kpc), likely close to the Galactic center (where the high absorption may arise from within the Galactic bulge). At such a distance IGR J175912342 is very radio-loud, with an comparable to those observed from BHXRBs. This result identifies limitations when classifying XRBs from their / ratio. It is important to note that the a some of the may arise from absorbing material local to the system, similar to what has been proposed for GRS 1915+105 and V4641 Sgr. While this would allow IGR J175912342 to be more nearby, we do not expect it closer than 3 kpc, making this a radio-loud NS. High-resolution X-ray spectroscopy is needed to identify element overabundances from absorption local to the source (Nowak et al., 2018).
3.4 Why is IGR J175912342 radio bright?
While flaring from a transient jet or possibly a propeller mechanism could enhance the observed radio emission (e.g. Tudor et al., 2017), our observations suggest that the radio emission originated from a steady, compact jet.
Our first and third radio epochs showed a flat-to-inverted radio spectrum, inconsistent with emission from a transient jet (which would produce a steep spectrum). While the radio spectrum may have been steep during our second epoch, the flux remained stable over the three epochs arguing against significant flaring. Additionally, during the first epoch333Which was the only epoch we could test (Section 2.1). we did not detect significant intra-observation variability.
Furthermore, using system parameters determined by Sanna et al. (2018) and typical AMXP values, we expect a magnetic propeller regime to occur at an 81034 erg s-1 (Tsygankov et al., 2017). Therefore, IGR J175912342 would need to be at distances 1.5 kpc for the observed radio emission to be propeller driven, which we find unlikely (Section 3.3).
There is thought to be some dependence between jet emission and spin for an accreting NS (Parfrey et al., 2016). IGR J175912342 is one of the more rapidly spinning AMXPs (527.4 Hz; Sanna et al. 2018). However, comparing its spin and radio luminosity with other AMXPs, there does not appear to be a clear relationship between these two properties. Therefore, while the NS spin may play some part in enhancing the jet emission in IGR J175912342, other characteristics, such as the magnetic field, NS mass, inclination, jet velocity, or launching mechanism, must play an important role in the observed jet emission of other systems (although the magnetic field of IGR J175912342 is typical of AMXP systems; Sanna et al. 2018).
4 Conclusions
Using quasi-simultaneous observations, we explore the / of IGR J175912342 during the early stages of its 2018 outburst. We find that the source is highly absorbed in the soft X-ray band. Therefore, either IGR J175912342 is relatively distant and exceptionally radio-loud, or the source is more nearby with a significant contribution to the absorption from material local to the source, similar to the BHXRBs GRS 1915+105 and V4641 Sgr. If IGR J175912342 is at 3 kpc, then our observations place it at radio luminosities more similar to those observed from BHXRBs than NS systems, which could mean that such radio-loud NSs would be a source of confusion when classifying XRBs from their /.
References
- Alpar et al. (1982) Alpar, M. A., Cheng, A. F., Ruderman, M. A., & Shaham, J. 1982, Nature, 300, 728
- Archibald et al. (2009) Archibald, A. M., et al. 2009, Science, 324, 1411
- Arnaud (1996) Arnaud, K. A. 1996, in Astronomical Society of the Pacific Conference Series, Vol. 101, Astronomical Data Analysis Software and Systems V, ed. G. H. Jacoby & J. Barnes, 17
- Bahramian et al. (2015) Bahramian, A., Heinke, C. O., Degenaar, N., Chomiuk, L., Wijnands, R., Strader, J., Ho, W. C. G., & Pooley, D. 2015, MNRAS, 452, 3475
- Bahramian et al. (2018) Bahramian, A., et al. 2018, Radio/X-ray correlation database for X-ray binaries
- Blandford & Königl (1979) Blandford, R. D., & Königl, A. 1979, ApJ, 232, 34
- Corbel et al. (2013) Corbel, S., Coriat, M., Brocksopp, C., Tzioumis, A. K., Fender, R. P., Tomsick, J. A., Buxton, M. M., & Bailyn, C. D. 2013, MNRAS, 428, 2500
- Dickey & Lockman (1990) Dickey, J. M., & Lockman, F. J. 1990, ARA&A, 28, 215
- Ducci et al. (2018) Ducci, L., Kuulkers, E., Grinberg, V., Paizis, A., Sidoli, L., Bozzo, E., Ferrigno, C., & Savchenko, V. 2018, The Astronomer’s Telegram, 11941
- Evans et al. (2009) Evans, P. A., et al. 2009, MNRAS, 397, 1177
- Fender (2001) Fender, R. P. 2001, MNRAS, 322, 31
- Fender & Kuulkers (2001) Fender, R. P., & Kuulkers, E. 2001, MNRAS, 324, 923
- Gallo et al. (2018) Gallo, E., Degenaar, N., & van den Eijnden, J. 2018, MNRAS, 478, L132
- Gallo et al. (2012) Gallo, E., Miller, B. P., & Fender, R. 2012, MNRAS, 423, 590
- Gallo et al. (2014) Gallo, E., et al. 2014, MNRAS, 445, 290
- Gandhi et al. (2018) Gandhi, P., Rao, A., Johnson, M. A. C., Paice, J. A., & Maccarone, T. J. 2018, ArXiv e-prints
- Green et al. (2018) Green, G. M., et al. 2018, MNRAS, 478, 651
- in ’t Zand et al. (1998) in ’t Zand, J. J. M., Heise, J., Muller, J. M., Bazzano, A., Cocchi, M., Natalucci, L., & Ubertini, P. 1998, A&A, 331, L25
- Kalberla et al. (2005) Kalberla, P. M. W., Burton, W. B., Hartmann, D., Arnal, E. M., Bajaja, E., Morras, R., & Pöppel, W. G. L. 2005, A&A, 440, 775
- Krimm et al. (2018) Krimm, H. A., et al. 2018, The Astronomer’s Telegram, 11981
- Lee et al. (2002) Lee, J. C., Reynolds, C. S., Remillard, R., Schulz, N. S., Blackman, E. G., & Fabian, A. C. 2002, ApJ, 567, 1102
- Luo & Fang (2014) Luo, Y., & Fang, T. 2014, ApJ, 780, 170
- Maccarone (2008) Maccarone, T. J. 2008, in Astronomical Society of the Pacific Conference Series, Vol. 401, RS Ophiuchi (2006) and the Recurrent Nova Phenomenon, ed. A. Evans, M. F. Bode, T. J. O’Brien, & M. J. Darnley, 191
- Martí et al. (2000) Martí, J., Mirabel, I. F., Chaty, S., & Rodríguez, L. F. 2000, A&A, 356, 943
- Martí-Vidal et al. (2014) Martí-Vidal, I., Vlemmings, W. H. T., Muller, S., & Casey, S. 2014, A&A, 563, A136
- McMullin et al. (2007) McMullin, J. P., Waters, B., Schiebel, D., Young, W., & Golap, K. 2007, in Astronomical Society of the Pacific Conference Series, Vol. 376, Astronomical Data Analysis Software and Systems XVI, ed. R. A. Shaw, F. Hill, & D. J. Bell, 127
- Migliari & Fender (2006) Migliari, S., & Fender, R. P. 2006, MNRAS, 366, 79
- Miller et al. (2009) Miller, J. M., Cackett, E. M., & Reis, R. C. 2009, ApJ, 707, L77
- Miller et al. (2006) Miller, J. M., et al. 2006, ApJ, 646, 394
- Miller-Jones (2014) Miller-Jones, J. C. A. 2014, PASA, 31, e016
- Mirabel et al. (1996) Mirabel, I. F., Rodriguez, L. F., Chaty, S., Sauvage, M., Gerard, E., Duc, P.-A., Castro-Tirado, A., & Callanan, P. 1996, ApJ, 472, L111
- Nowak et al. (2018) Nowak, M., Paizis, A., Chenevez, J., Chaty, S., Wilms, J., & Rodriguez, J. 2018, The Astronomer’s Telegram, 11988
- Orosz et al. (2001) Orosz, J. A., et al. 2001, ApJ, 555, 489
- Papitto et al. (2013) Papitto, A., et al. 2013, Nature, 501, 517
- Parfrey et al. (2016) Parfrey, K., Spitkovsky, A., & Beloborodov, A. M. 2016, ApJ, 822, 33
- Parmar et al. (2002) Parmar, A. N., Oosterbroek, T., Boirin, L., & Lumb, D. 2002, A&A, 386, 910
- Patruno & Watts (2012) Patruno, A., & Watts, A. L. 2012, ArXiv e-prints
- Radhakrishnan & Srinivasan (1982) Radhakrishnan, V., & Srinivasan, G. 1982, Current Science, 51, 1096
- Russell et al. (2018) Russell, T., Degenaar, N., Wijnands, R., & van den Eijnden, J. 2018, The Astronomer’s Telegram, 11954
- Sanna et al. (2018) Sanna, A., et al. 2018, A&A, 617, L8
- Stappers et al. (2014) Stappers, B. W., et al. 2014, ApJ, 790, 39
- Tsygankov et al. (2017) Tsygankov, S. S., Mushtukov, A. A., Suleimanov, V. F., Doroshenko, V., Abolmasov, P. K., Lutovinov, A. A., & Poutanen, J. 2017, A&A, 608, A17
- Tudor et al. (2017) Tudor, V., et al. 2017, MNRAS, 470, 324
- van den Eijnden et al. (2018a) van den Eijnden, J., et al. 2018a, The Astronomer’s Telegram, 11487
- van den Eijnden et al. (2018b) van den Eijnden, J., Degenaar, N., Russell, T. D., Wijnands, R., Miller-Jones, J. C. A., Sivakoff, G. R., & Hernández Santisteban, J. V. 2018b, ArXiv e-prints
- Wijnands & van der Klis (1998) Wijnands, R., & van der Klis, M. 1998, Nature, 394, 344
- Willingale et al. (2013) Willingale, R., Starling, R. L. C., Beardmore, A. P., Tanvir, N. R., & O’Brien, P. T. 2013, MNRAS, 431, 394
- Wilms et al. (2000) Wilms, J., Allen, A., & McCray, R. 2000, ApJ, 542, 914