The Stellar Contents of Intermediate Mass Disk Galaxies in the Virgo Cluster. I. GMOS Spectra 11affiliation: Based on observations obtained at the Gemini Observatory, which is operated by the Association of Universities for Research in Astronomy, Inc., under a cooperative agreement with the NSF on behalf of the Gemini partnership: the National Science Foundation (United States), the National Research Council (Canada), CONICYT (Chile), Ministério da Ciência, Tecnologia e Inovação (Brazil) and Ministerio de Ciencia, Tecnología e Innovación Productiva (Argentina). 22affiliation: This research has made use of the NASA/IPAC Infrared Science Archive, which is operated by the Jet Propulsion Laboratory, California Institute of Technology, under contract with the National Aeronautics and Space Administration. 33affiliation: This research makes use of the Virgo cluster galaxy database of McDonald et al. (2011).
Abstract
The stellar contents of six intermediate mass early-type disk galaxies in the Virgo cluster are examined using deep long slit spectra. The isophotal and photometric properties of the galaxies at near- and mid-infrared wavelengths are also examined. Characteristic ages and metallicities are found by making comparisons with the strengths of lines measured from model spectra. The light from the central regions of these galaxies at visible/red wavelengths is not dominated by old populations. Rather, the central regions of four galaxies (NGC 4305, NGC 4306, NGC 4497, and NGC 4620) are dominated by populations with ages Gyr. Centrally-concentrated line emission is found in two of the galaxies (NGC 4491 and NGC 4584), and the relative strengths of H and [SII]6746 are consistent with this emission originating in star-forming regions. The disks of these galaxies are dominated by populations that are at least 1 Gyr older than those near the centers, indicating that the quenching of star formation progressed from large radii inwards, and did not occur over a short timescale. NGC 4497 has the oldest disk, with a luminosity-weighted age of 10 Gyr. The metallicities of the galaxies in this sample are consistent with their integrated brightnesses, suggesting that they have not been subjected to large-scale stellar stripping. [Mg/Fe] is roughly solar, suggesting that these systems retained and enriched gas over time scales of at least 1 Gyr. The progenitors of these galaxies were likely late-type galaxies that were accreted by Virgo during intermediate or early epochs, and have since been depleted of gas and dust.
Subject headings:
galaxies:stellar contents – galaxies:evolution1. INTRODUCTION
The Virgo cluster is the nearest large concentration of galaxies, and so is an important laboratory for exploring galaxy evolution in dense environments. Understanding the stellar content of Virgo galaxies is fundamental to developing a picture of how the cluster formed and evolved. The analysis of integrated light is the primary means of studying the stellar contents of galaxies and star clusters in Virgo, as even the most luminous stars can only be resolved in the lowest density regions of its member galaxies. Spectroscopic observations at visible wavelengths are of particular importance for examining stellar content as there are numerous well-calibrated atomic and molecular transitions at these wavelengths (e.g. Worthey et al. 1994). For example, features at visible wavelengths such as H and the G-band ease the age-metallicity degeneracy (e.g. Worthey 1994). However, spectra at visible wavelengths do not sample the full range of stellar content. While stars near the MSTO in old and intermediate age systems may contribute significantly to integrated light at visible wavelengths, the contribution from stars that have effective temperatures (Teff) K, such as young MS stars, BHB and PAGB stars, or from stars that have T a few times K (e.g. RGB-tip and AGB stars) may be modest. Extending the wavelength coverage can thus contribute additional information for probing stellar content in Virgo galaxies, such as finding evidence for very low levels of recent star formation that may be missed at visible wavelengths (e.g. Vazdekis et al. 2016). Obscuration by dust will also complicate efforts to examine integrated light at visible wavelengths.
This is the first of two papers that examines the spectra of six intermediate mass disk galaxies in the Virgo cluster. Long slit spectra covering wavelengths from m to m and that sample angular offsets out to 15 arcsec from the galaxy centers have been obtained for these galaxies. This wavelength interval contains a mix of classic stellar population diagnostics at blue/visible wavelengths, such as H and lines of Mg and Fe. It also samples spectroscopic signatures of the reddest evolved stars that contribute a significant amount of the light at red and near-infrared (NIR) wavelengths, such as the Ca triplet near m and the first and second overtone CO bands between 1.5 and m. Signatures of C stars may also be detected at the long wavelength end of these observations. Even though the rapid pace of evolution on the upper AGB makes C stars relatively rare, spectroscopic signatures of C stars have been found in the integrated light from star clusters (Mouhcine et al. 2002; Davidge 2018) and nearby galaxies (Miner et al. 2011; Davidge et al. 2015; Davidge 2016).
All six galaxies are of type dE(di), as defined by Lisker et al. (2006a). Galaxies of this type show evidence of a disk in the form of structures like spiral arms, bars, lenses, and/or a flattening of the light profile that is consistent with rotational support. dE(di)s account for of the dE population in Virgo, and tend to inhabit the bright end of the dE luminosity function, where they account for of all objects (Lisker et al. 2006a). That dE(di)s populate the bright end of the dE LF may indicate that there is a minimum mass threshold to sustain organized disk structures like bars and spiral arms (Lisker et al. 2008). Many properties of dE(di)s differ from those of ‘classical’ dEs, suggesting that they are a distinct class of objects (Lisker er al. 2006a).
Five of the galaxies (NGC 4305, NGC 4491, NGC 4497, NGC 4584, and NGC 4620) form the sub-sample of dE(di) galaxies classified as ‘dwarfish S0/Sa’ by Lisker et al. (2006a). These are among the brightest dE(di)s, and lack the large bulge seen in more massive classical early-type disk galaxies. Galaxies of this nature may serve as a bridge between fainter dE(di) galaxies and larger disk systems. Various properties of the target galaxies are listed in Table 1, and the absolute brightnesses of these galaxies are similar to those of the LMC and M33 (M).
The sixth galaxy is NGC 4306, which is close to NGC 4305 on the sky and could be observed at the same time as NGC 4305 as the GMOS slit can sample both systems at once. The close proximity of NGC 4306 to NGC 4305 is fortuitous, as NGC 4306 is one of only a handful of Virgo dEs that Lisker et al. (2006a) identify as having a ‘certain disk’, and kinematic measurements made by Toloba et al. (2011) confirm that NGC 4306 is rotationally supported. NGC 4306 thus is a bona fide dE(di), having a morphological kinship with the other five galaxies examined in this paper. As such, NGC 4306 serves as a link to fainter dE(di)s.
| NGC # | VCC # | aa brightness from SDSS data release 6 (Adelman-McCarthy et al. 2008). | bbFrom 2MASS Extended Object catalogue, except for NGC 4491, where is from the 2MASS Large Galaxy Atlas (Jarrett et al. 2003). | MKccBased on a distance modulus of 31.3 (Mei et al. 2007). | re ddHalf light radius in arcsec from McDonald et al. (2011). | eeAngular offset from M87 in arc minutes. | Morphology ffFrom Binggeli et al. (1985). |
|---|---|---|---|---|---|---|---|
| (mag) | (mag) | (mag) | (arcsec) | (arcmin) | |||
| 4305 | 0522 | 12.7 | 10.2 | –20.9 | 29.0 | 133.5 | Sa |
| 4306 | 0523 | 13.1 | 10.9 | –20.2 | 16.9 | 130.3 | d:SB0(s),N |
| 4491 | 1326 | 12.6 | 9.8 | –21.3 | 25.3 | 54.5 | SBa(s) |
| 4497 | 1368 | 12.5 | 9.9 | –21.2 | 35.2 | 47.2 | SB0(s)/SBa |
| 4584 | 1757 | 13.1 | 10.9 | –20.2 | 19.6 | 117.8 | Sa(s) pec |
| 4620 | 1902 | 12.6 | 10.4 | –20.7 | 18.2 | 166.8 | S0/Sa |
All six galaxies have red colors, with and . To the extent that dust does not define the photometric properties of Virgo galaxies (e.g. Roediger et al. 2011) then these galaxies might then be expected to harbor large intermediate age and old populations, with negligible contributions to the light from recent star formation. While this is shown to be the case for four of the galaxies, recent star formation dominates the light from the central regions of two others. The visible/red colors of these systems are thus not faithful indicators of age, and this is likely due to dust.
In the present paper spectra of the galaxies obtained with the Gemini Multi-Object Spectrographs (GMOSs) on Gemini North (GN) and Gemini South (GS) are discussed. Spectra from GS that span the m wavelength interval were recorded for all six galaxies. Two galaxies (NGC 4305 and NGC 4620) were also observed from GN, and those spectra extend to m. The spectra sample the galaxy nuclei and the surrounding disk, allowing stellar content to be examined over a range of radii. Luminosity-weighted ages and metallicities are estimated through comparisons with model spectra. Spectra of these galaxies at longer wavelengths obtained with the Flamingos-2 spectrograph on GS will be the subject of a separate paper (Davidge 2018, in preparation).
The spectra are used to estimate the ages and metallicities of these systems, including a search for radial trends within the galaxies. The age of these systems is of particular interest for probing their origins – if their light is dominated by a uniformly old population then they are probably long-time residents of the Virgo cluster. The use of spectra allows ages to be estimated that are free of the age-metallicity degeneracy that plagues estimates made from visible broad-band photometry alone. Spectra can also be used to identify young stellar components that may be reddened by dust, thereby making their detection difficult with broad-band photometry alone. Finally, the radial colors of dE(di)s suggest that there are radial population gradients (Lisker et al. 2008). Age gradients in the galaxies might provide insights into the timescale of the removal of the interstellar mediums from the galaxies. The absence of an age gradient would indicate that star formation was shut down throughout the galaxy over a narrow time frame, whereas a large age gradient would indicate that the quenching of star formation was the result of a process that affected some parts of the galaxy more quickly than others.
Three of the galaxies (NGC 4305, NGC 4491, and NGC 4584) are in the Herschel Reference Survey (HRS; Boselli et al. 2010), and there are HRS spectra for these galaxies that cover wavelengths from 0.39 to 0.70m. However, HRS spectra were obtained via drift-scanning, and so do not contain spatial information. While spectra of this nature are useful for assessing the stellar content of a galaxy in its entirety, it will be shown later in this paper that all three galaxies contain population gradients, and two of these (NGC 4491 and NGC 4584) have a prominent centrally-concentrated young component.
Details of the observations and a description of the processing that was applied to extract the spectra are presented in Section 2. The photometric and isophotal properties of the galaxies provide supplemental insights into their past histories, and measurements made from archival NIR and mid-infrared (MIR) wavelengths are discussed in Section 3. The characteristics of the spectra, including line strength measurements and radial variations in spectroscopic properties, are the subject of Sections 4 and 5. Comparisons are made with model spectra in Section 6, where luminosity-weighted ages and metallicities are estimated. A summary and discussion of the results follows in Section 7.
2. OBSERVATIONS AND REDUCTION PROCEDURES
2.1. GMOS-S Spectra
Spectra of all six galaxies were recorded with GMOS (Hook et al. 2004) on GS as part of program GS-2017A-Q-81 (PI: Davidge). The detector in GMOS-S is a mosaic of three Hamamatsu CCDs, the general characteristics of which are discussed by Hardy et al. (2012). Each CCD is made up of m square pixels in a 2048 4176 pixel format, with an on sky angular sampling of 0.08 arcsec pixel-1. The Hamamatsu CCDs have a higher quantum efficiency over a broader wavelength range than the EEV CCDs that made up the previous GMOS detector, and are also less susceptible to fringing.
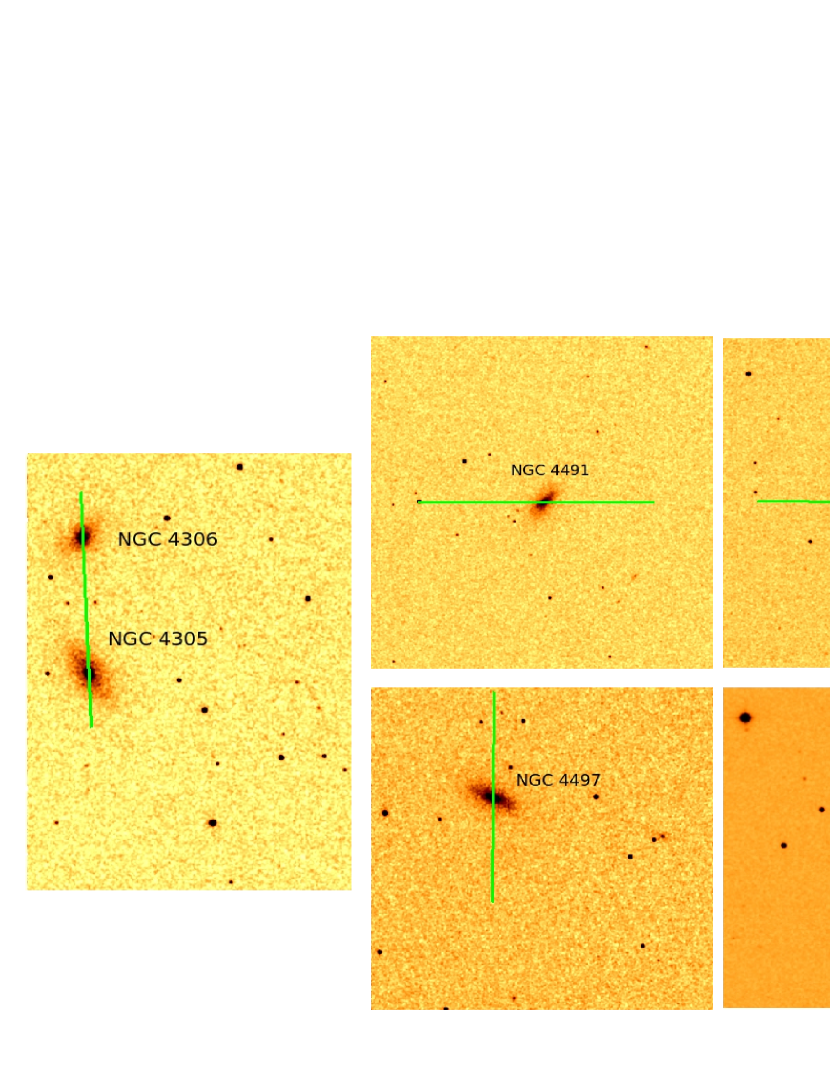
Light was dispersed with the R150 grating (150 l/mm; m), with a GG451 filter deployed to block signal from higher orders. While second order light is then present at wavelengths longward of m, contamination is likely to be minor given the red colors of the galaxies and the dispersed nature of the second order light. A 2 arcsec wide slit was used for all observations, and the spectral resolution of a source that uniformly fills the slit is at the blaze wavelength. Spectra were recorded with two wavelengths at the center of the detector array (m and m) so that breaks in spectral coverage caused by gaps between CCDs could be filled. The detectors were binned during readout. The dates when galaxies were observed are listed in Table 2, while the orientation of the slit for each galaxy is shown in Figure 1. Aside from NGC 4305 and NGC 4306, the slit orientations were selected based on the availability of guide stars that could be acquired by the on-instrument wavefront sensor in GMOS, and the need to sample the galaxies in a manner that ensured clean sky subtraction when stepping along the slit (see below).
| Telescope | Galaxy | Date (2017, UT) | Grating |
|---|---|---|---|
| GS | NGC 4305 | April 13 | R150 |
| NGC 4606 | April 13 | R150 | |
| NGC 4491 | April 24 | R150 | |
| NGC 4497 | April 23 | R150 | |
| NGC 4584 | April 13 | R150 | |
| NGC 4620 | April 13 | R150 | |
| GN | NGC 4305 | May 27 | B600 |
| … | June 26 | B600 | |
| … | June 26 | R400 | |
| NGC 4620 | June 27 | B600 | |
| … | June 28 | R400 |
The suppression of the numerous bright telluric emission bands at wavelengths longward of m can be a challenge for observations of faint, extended objects. To facilitate sky subtraction, NGC 4491, 4497, 4584, and 4620 were nodded between two locations on the 5.5 arcmin slit at each wavelength setting. Each nodded pair of observations could then be subtracted, thus providing an efficient means of removing sky emission lines. Interference fringes are also suppressed. Two 300 sec exposures were obtained at each pointing and wavelength setting, with the result that eight 300 sec exposures were recorded for each galaxy.
The angular separation between NGC 4305 and NGC 4306 is such that both can be observed with GMOS at the same time, and this was done here. The total exposure time is the same as for the other galaxies, with four 300 sec exposures recorded at each wavelength setting. While saving time, the separation between the galaxies is such that on-slit nodding is not possible. While the sky level can be measured in the space between the two galaxies, uncertainties in the flat-field correction and optical distortions within GMOS are such that the suppression of sky lines proved not to be as good as for the other galaxies. This limits the radial extent of the NGC 4306 spectra, which has the faintest surface brightnesses at a given angular offset from the galaxy center in the six galaxy sample. Comparisons with nodded spectra recorded from GN (Section 2.2) indicate that line strengths in the NGC 4305 GS spectra are not affected by sky line residuals.
Calibration data were also recorded. These include (1) spectra of an early-type white dwarf (EG 81) to monitor telluric absorption features and the wavelength response of the atmosphere, telescope, and instrument; (2) flat-field frames, constructed from observations of dispersed light from a continuum source in the Gemini Facility Calibration Unit (GCAL); (3) exposures that monitor the detector bias level; and (4) spectra of the GCAL CuAr arc lamp. Following standard observing procedures for queue-scheduled GMOS observations, the flat field frames were recorded midway through the observing sequence for each galaxy, while the bias and arc exposures were recorded on the days following nights when program targets were observed.
2.2. GMOS-N Spectra
Spectra of NGC 4305 and NGC 4620 were recorded with GMOS on GN as part of program GN-2017A-Q-78 (PI Davidge). The detector in GMOS-N is a mosaic of Hamamatsu CCDs that is similar to its GMOS-S counterpart. The GN data were recorded with pixel binning during read-out.
The GN spectra have a higher spectral resolution than the GS spectra. Two sets of spectra were recorded for each galaxy: one with the B600 (600 l/mm; m) grating, and the other with the R400 (400 l/mm; m) grating. The B600 spectra were recorded with central wavelengths of 0.54 and m, while the R400 spectra have central wavelengths of 0.75 and m. Together these spectra cover wavelengths from 0.38 to m. The spectra were recorded using a 1 arcsec slit, with a GG455 filter deployed for the R400 observations to block light from higher orders.
It was decided not to observe NGC 4306 with NGC 4305, making it possible to nod NGC 4305 along the slit to facilitate the removal of telluric emission lines. The processed GN spectra of NGC 4305 then provide a means of gauging if there are systematic effects in sky subtraction in the GS spectra of this galaxy. The spectra of NGC 4620 were also recorded with on-slit nodding. Calibration images that parallel those obtained on GS were also recorded. The DA white dwarf EG 131 was observed to monitor telluric absorption features and system throughput.
Two 900 second exposures were recorded at each central wavelength for NGC 4305, while four 600 sec exposures were recorded of NGC 4620. The total exposure times are then 3600 sec for NGC 4305 and 4800 sec for NGC 4620. The dates when the GN spectra were recorded are listed in Table 2. The observations of NGC 4305 with the B600 grating were recorded over two nights.
2.3. Reduction
The processing of the spectra was carried out in two stages, and the various steps in each stage are described below.
2.3.1 Removal of instrument signatures and the sky
To begin, the overscan level of each CCD was measured and subtracted on an exposure-by-exposure basis, and a nightly bias frame was subtracted from the results. Cosmetic defects and cosmic rays were repaired through interpolation. Exposures of each galaxy at the same nod position and with the same central wavelength were then averaged together, and the results were divided by a processed flat-field frame.
Geometric distortions produced by the GMOS optics bow the signal along the spatial direction, distorting spectra of extended objects. Distortion maps were constructed by tracing emission lines perpendicular to the dispersion direction in the arc spectra, and using the results to construct warping functions that linearized these features. With the exception of the GS observations of NGC 4305 and NGC 4306 (see below), the sky was then removed by differencing spectra of each galaxy recorded at the same central wavelength but at different nod locations. The sky line residuals are small in the reduced data (Section 4), indicating that the sky brightness was stable on time scales in excess of the many hundreds of seconds during which nodded pairs were recorded.
A different sky subtraction procedure was applied to the GS observations of NGC 4305 and NGC 4306, as these data were recorded without slit nodding (Section 2.1). The sky level for these observations was measured by taking the mean signal midway between the galaxies and near the ends of the slit. The results were then subtracted on a column-by-column basis. The residuals at wavelengths near sky emission lines are larger than those in spectra in which nodding was employed, and this is most noticeable in the low surface brightness outer regions of NGC 4306. The larger residuals are a consequence of modest (%) uncertainties in flat-fielding and the optical distortion corrections, both of which are negated when nodded spectra are subtracted.
2.3.2 Extraction of spectra, wavelength calibration, and correction of throughput variations.
Mean spectra covering various radial intervals were extracted from the sky-subtracted two-dimensional spectra of each galaxy. A central spectrum (Region 1) was extracted within arcsec of the nucleus to more-or-less sample the angular resolution defined by the seeing, and progressively wider radial gathers (Regions 2 – 5) were defined to maintain a roughly constant galaxy light level in each interval. Spectra on both sides of the nucleus were combined, and the radial extraction intervals are listed in Table 3. Efforts to conserve total signal notwithstanding, the S/N ratio of the extracted spectra drops as progressively larger angular offsets from the galaxy center are sampled, since the contribution from sky noise grows when spectra are combined over wider and wider angular intervals in the low surface brightness outer regions of a galaxy.
| Region # | Radial extent | Projected spatial extentaaBased on a distance modulus of 31.3 (Mei et al. 2007). |
|---|---|---|
| (arcsec) | (pc) | |
| 1 | 0 – 0.55 | 0 – 50 |
| 2 | 0.55 – 1.75 | 50 – 150 |
| 3 | 1.75 – 3.90 | 150 – 340 |
| 4 | 3.90 – 8.40 | 340 – 740 |
| 5 | 8.40 - 15.90 | 740 – 1400 |
The extracted spectra were wavelength calibrated by applying a dispersion solution obtained from the CuAr arcs. The spectral response at this point in the processing contains contributions from the system optics (telescope instrument), the detector, the atmosphere, and the flat-field source. These were suppressed by ratioing the extracted spectra with the spectrum of a reference star that had been processed using the same procedures as those applied to the galaxy data. A low-order continuum function was then fit to and divided out of each spectrum. Doppler-corrections were applied to place the spectra in the rest frame.
It should be noted that Gemini’s baseline calibration policy is to record one reference star spectrum for each science program. While this typically works well for suppressing O2 absorption at 0.69 and m, there can be issues suppressing H2O bands near m, m and m. These H2O bands are not saturated, and their depths vary with atmospheric water content. GN is typically very dry, and the night-to-night variation in the depths of the H2O bands is usually modest. However, GS is at a lower altitude than GN, and night-to-night variations in H2O content can be significant. Four of the galaxies observed from GS were observed on the same night (April 13) as the reference star, and the H2O bands are suppressed in the reduced spectra. However, NGC 4491 and NGC 4497 were not observed on the same night as the reference star, and deep residual H2O absorption between 0.9 and m remained in the NGC 4497 spectrum after division by the reference star. To correct for this, a template was constructed that forced the wavelength intervals containing H2O in the NGC 4497 spectrum to match the mean of the other five galaxies at these wavelengths, but that did not alter individual atomic absorption or emission features. There are CN and TiO band heads near m, and this procedure forces the depths of these bands in NGC 4497 to match those in the other galaxies.
3. ISOPHOTAL PROPERTIES
The isophotal properties of galaxies form part of the fossil record that can be mined to explore their evolution. In the current study, the isophotal characteristics of the six galaxies are examined using images from the 2MASS and WISE All Sky surveys. McDonald et al. (2011) examined the light profiles of these galaxies, fitting models that include a nucleus, a Sersic bulge, and a disk. The Sersic indices measured for the central regions of NGC 4305, NGC 4306, NGC 4491, and NGC 4497 are consistent with those found in late-type spirals and dEs (Table 2 of McDonald et al. 2011). However, the Sersic indices for the centers of NGC 4584 and NGC 4620 are consistent with those found in Sa and Sb galaxies, suggesting that classical bulges may be present.
We do not attempt to duplicate the McDonald et al. (2011) structural analysis. Rather, the current discussion is restricted to isophote shape and color profiles. The isophotal measurements were made with the STSDAS routine , which applies the iterative method described by Jedrzejewski (1987). With the exception of extreme cases such as dust-enshrouded starburst systems, the light in and traces stellar mass, and is less susceptible to stochastic variations that influence isophotes at shorter wavelengths when very young populations are present. The angular resolution of the 2MASS data measured directly from stellar profiles in the images is arcsec, which is broader than the arcsec FWHM resolution of the GMOS observations. Measurements were also made from WISE All Sky Survey (Wright et al. 2010) W2 (m) images. Light in this filter is of potential interest for determining if there is a contribution from hot (logT 2.0) dust emission, such as might originate in circumstellar envelopes, young star-forming regions, and/or near AGN.
Bars are seen in some massive lenticulars (e.g. Dullo et al. 2016), and similar structures will complicate the isophotal analysis if present in these galaxies. While some of the galaxies are classified as barred, the residual images produced by subtracting the isophotal fit from the original images do not contain obvious large-scale residuals, indicating that the isophotal fits have faithfully tracked these structures. The angular resolution of the 2MASS and WISE images is such that bars with angular sizes arcsec will go undetected.
The profiles obtained from the 2MASS images are shown in Figure 2. Residual images suggest that the jitter in the profiles is likely not a result of spiral structure, but may instead be due to noise. The central colors of the galaxies differ by magnitudes, suggesting that differences in the central spectroscopic properties of the galaxies might be expected. NGC 4491 has the reddest central (), while NGC 4306 and NGC 4497 are at the other extreme, with . McDonald et al. (2011) determined the half light radius of bulge light for each galaxy, and the result is marked in the top row of Figure 2. The bulge radius coincides with features in the color profiles of NGC 4305, NGC 4497, and NGC 4584.
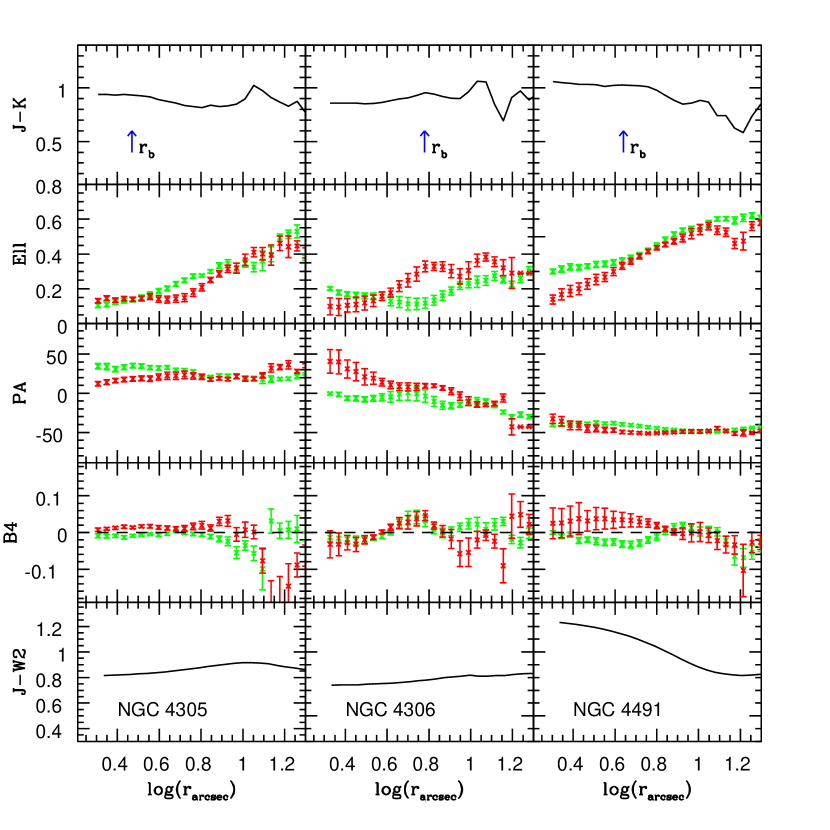
Bulges that are redder than the surrounding disk are a common feature in larger S0s (e.g. Xiao et al. 2016). Neglecting the color measurements in the outermost bins, which are susceptible to errors in sky subtraction and noise, then there are systematic gradients in NGC 4305, NGC 4491, and NGC 4584, in the sense that becomes smaller towards larger radii. There may also be a shallow gradient in NGC 4497. In contrast, NGC 4306 and NGC 4620 appear to have a more-or-less constant color.
In the absence of dust obscuration, gradients in intermediate age and older systems are typically interpreted as being due to metallicity-driven changes to the effective temperatures of giants. Radial changes in the strengths of lines that trace metallicity might then be expected in the spectra of NGC 4305, NGC 4491, NGC 4497, and NGC 4584. In contrast, the radial spectroscopic properties of NGC 4306 and NGC 4620 might be expected not to change with radius given the profiles of these galaxies. These predictions are broadly consistent with the trends in the spectra that are discussed in Section 5.
McDonald et al. (2011) estimate the ratio of bulge to total light (B/T) in and , and these measurements provide additional clues into the radial distribution of stellar content in these galaxies. The B/T ratios in span a large range, amounting to only a few percent for NGC 4305, NGC 4491, and NGC 4497, while B/T = 0.10 for NGC 4306 and 0.20 for NGC 4584 and NGC 4620. McDonald et al. (2011) also find that B/T in can be up to a factor of ten larger than in . This difference between B/T in and suggests that there is a larger fractional contribution from blue stars to the visible light from the central regions of these galaxies than in the surroundings. This is additional evidence that stellar content varies with radius in some of these systems, and this is confirmed with the spectra.
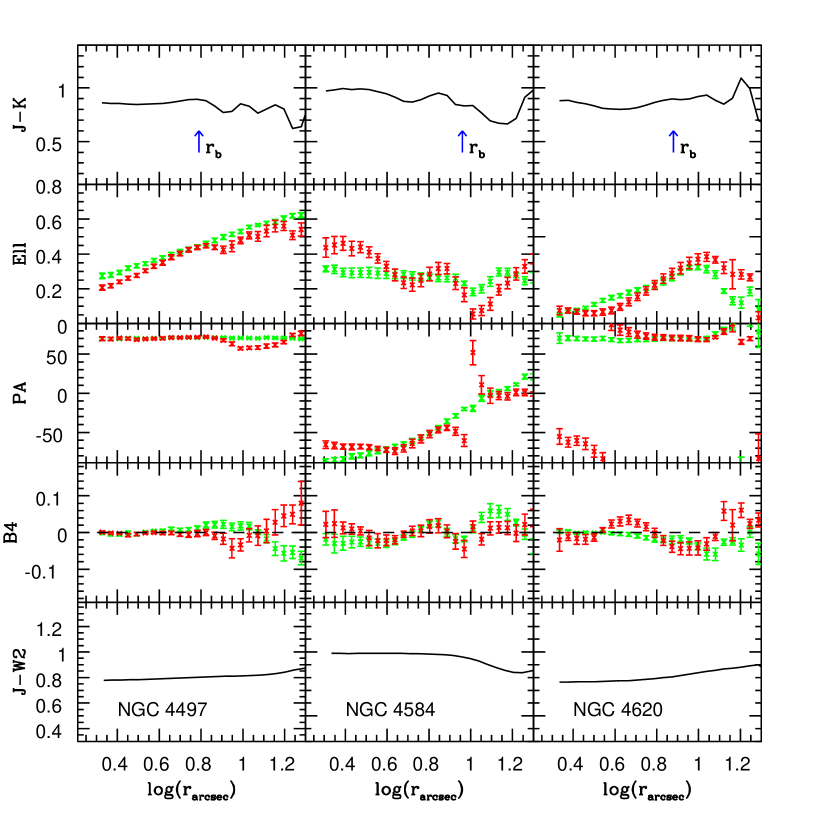
The ellipticity and position angle profiles in Figure 2 point to a mix of structural characteristics, and NGC 4584 stands out in two ways. First, the isophote position angle stays more-or-less constant in most of the galaxies, indicating that there is no large-scale twisting of the isophotes. An exception is NGC 4584, where the position angle measurements change markedly with radius in both filters. Second, there is a tendency for ellipticity to increase with radius in almost all of the galaxies. Again, an exception is NGC 4584. Such a radial variation in ellipticity could occur if there is a radial change in the light contribution made by a (presumably) round nucleus/bulge and the surroundings. The galaxies that McDonald et al. (2011) find have the smallest B/T ratio also have the steepest ellipticity gradients in Figure 2, as would be expected if the ellipticity profile is due to a radial transition from a round nucleus to a disk viewed at an oblique angle.
performs a Fourier analysis of isophotes. The coefficient of the fourth order cosine term – B4 – measures departures from pure ellipticity (e.g. Carter 1978), that could be attributed to a disk, distortions caused by tidal interactions, and/or isolated concentrations of light from large star-forming complexes. Isophotes with B4 are ‘disky’, while those with B4 are ‘boxy’. The agreement between the B4 coefficients measured in both filters in each galaxy in Figure 2 is far from perfect, highlighting the susceptibility of B4 measurements to noise. Filter-to-filter disagreements in B4 within the seeing disk (i.e. log(r) ) are likely due to distortions in the point spread function (PSF) that are filter and field specific.
Given the uncertainties in the B4 measurements, we only consider trends in B4 outside of the seeing disk that are detected in both filters. For NGC 4305, NGC 4306, NGC 4497, and NGC 4620 B4 within the errorbars. There is no evidence of isophotal twisting in the position angles of these galaxies, suggesting that they probably have not experienced interactions within the last few disk crossing times. However, the situation is different for NGC 4491 and NGC 4584, both of which have prominent emission lines in their spectra (Section 4). Focusing on radii log(r) then systematic departures of B4 from zero in both bandpasses are seen in NGC 4491, where B4 tends to be negative, and NGC 4584 where B4 tends to be positive between log(r) = 1 and 1.3. Despite having different isophote shapes at large radii, both galaxies show evidence of isophote twisting in their position angle profiles.
The light profiles of bright field stars in the W2 images of these galaxies indicate that the angular resolution is arcsec FWHM 111For comparison, the angular resolution delivered by the satellite optics is 6.4 arcsec FWHM for W2 (Wright et al. 2010), which is markedly broader than the FWHM of stars in the 2MASS images. Examining isophote properties on arcsec angular scales in the W2 images is thus problematic, and the W2 images are used only to compute colors. Colors were measured using 2MASS images that had been convolved with a Gaussian to match the angular resolution of the W2 data. The resulting profiles are shown in the bottom row of Figure 2.
For four of the six galaxies (NGC 4305, NGC 4306, NGC 4497, and NGC 4620) there is a tendency for to increase slightly with increasing radius. This could occur if the dominant signal in the W2 observations at the largest radii shown in Figure 2 is not photospheric in origin. There are no polyaromatic hydrocarbon (PAH) emission bands in the wavelength region sampled by the W2 filter, and non-photospheric light might then originate in circumstellar envelopes associated with a large population of hot stars or a dominant intermediate age population at large radii. However, this is unlikely. In Section 6 it is shown that while the disks are older than the galaxy centers, the central regions tend to have ages where the contribution from AGB stars with solar metallicities is expected to peak (e.g. Figure 13 of Maraston 2005); the amount of thermal emission from circumstellar envelopes might then be expected to decrease as one moves to larger radii. The slight gradients in NGC 4305, NGC 4306, NGC 4497, and NGC 4620 may be due to subtle systematic errors in the sky background measurements.
near the centers of NGC 4491 and NGC 4584 is much higher than in the outer regions of these galaxies. The colors of young and intermediate age systems constructed from the Bressan et al. (2012) isochrones are a few tenths of a magnitude smaller than those found near the centers of these two galaxies, but agree with what is seen in their outer regions, as well as throughout the other four galaxies. The red central colors of NGC 4491 and NGC 4584 are thus likely due to thermal emission from hot dust.
NGC 4491 has the reddest central color in Figure 2. Using Herschel Virgo Cluster Survey measurements, Auld et al. (2013) compute a dust temperature of K, which is the highest temperature of any object in that survey. The presence of hot dust in NGC 4491 is thus not surprising. In the next section it is shown that the line emission in NGC 4491 and NGC 4584 is powered by star formation, and so dust near the centers of these galaxies is probably heated by luminous young stars.
4. OVERVIEW OF THE CENTRAL SPECTRA
4.1. GMOS-S
The Region 1 spectrum of each galaxy is shown in Figures 3 - 5. The discussion is restricted to the galaxy centers for this initial reconnaisance of spectral features, as this is where the S/N ratio is highest. Many of the galaxies show gradients in spectroscopic properties, and the emission lines that dominate the spectra of NGC 4491 and NGC 4584 disappear at the largest angular offsets sampled with GMOS. The wavelength coverage is divided over multiple figures to allow the identification of individual lines and facilitate galaxy-to-galaxy comparisons.


In the absence of emission, H and H are basic probes of age. The Balmer lines are deepest in the spectrum of NGC 4620. However, the depths of these lines can be skewed by line emission, and H and H are both in emission in NGC 4491. H is also in emission in NGC 4584, and the weak nature of H absorption in the NGC 4584 spectrum suggests that emission fills that line. It is unlikely that low-level H emission lurks in the spectra of the other galaxies, as ages that are estimated for these galaxies from H agree with those found from H (Section 6).
Emission from [SII]6746, [SIII]9069, and [SIII]9532 is seen in the NGC 4491 and NGC 4584 spectra, but neither [OIII] 4959 nor 5007 is detected. The ratio of [SII]6746 to H provides insights into the source that powers this emission. Kewley et al. (2001) model emission from star-forming systems, and their Figure 6 indicates that when [OIII]/H is small – as is the case here – then emission from systems in which log([SII]/H is powered by radiation from hot stars, rather than from a LINER or an AGN. As log([SII]/H in both NGC 4491 and NGC 4584, then the emission from the central regions of these galaxies is likely powered by photons from luminous hot stars. GALEX images of both galaxies reveal bright cores in the FUV and NUV channels.
Absorption lines that are familiar probes of metallicity and chemical mixture are present in Figures 3 – 5. Metallic lines tend to be weakest in the spectra of NGC 4491 and NGC 4584, likely due to the presence of luminous young stars and veiling by continuum emission. The deepest Fe line at 5270Å is found in the spectra of NGC 4305 and NGC 4497. The lines of the Ca triplet are among the strongest features in the red spectra of early-type galaxies, and these trace metallicity in systems that have intermediate and old ages (e.g. Armandroff & Zinn 1988). Deep Ca lines are evident in all the galaxy spectra in Figure 5.
The NaD doublet blends to form a single feature at the resolution of the GMOS-S spectra. NaD is deepest in NGC 4305 and NGC 4497, and is shallowest in NGC 4491. NaD absorption may originate not only in stellar photospheres but also in interstellar material along the line of sight. While it is likely that NaD is dominated by the photospheric component in most of the spectra, an exception might be NGC 4491, the central regions of which may contain significant amounts of dust (Section 3). Assuming that the red central colors of NGC 4491 are due to dust and that the intrinsic of this galaxy is the same as in the other systems, then the color measurements in Figure 2 suggest that E(J–K) magnitudes. This corresponds to E(B–V) magnitudes if the Cardelli et al. (1989) extinction law is applied. Poznanski et al. (2012) calibrate the relation between the equivalent width of NaD and using Galactic stars, and a color excess E(B–V) = 0.4 corresponds to a NaD equivalent width of Å . This is roughly consistent with the equivalent width of NaD in the central spectrum of NGC 4491, hinting that at least some of the NaD absorption may be interstellar in origin.
Comparisons with model spectra are made in Section 6 and – aside from the central regions of NGC 4491 and NGC 4584 – these comparisons indicate that the bulk of the light from the centers of these galaxies originates from stars with ages Gyr. This is an age range where C stars may contribute significantly to the total light output (e.g. Maraston 2005). Indeed, Davidge (2018) examined the spectrum of the 2 Gyr old LMC cluster NGC 1978, and found that C stars produce a significant m CN feature in the integrated cluster spectrum. This feature is not an unambiguous C star indicator, as it is also present in the spectrum of evolved oxygen-rich stars, including RSGs (Davidge 2018). This CN band is detected in all six galaxies.
4.2. GMOS-N
The spectra recorded with GMOS-N have a higher resolution and extend to shorter wavelengths than the GMOS-S spectra, and so contain information that is complementary to the GMOS-S spectra. The GN and GS spectra of the central regions of NGC 4305 and NGC 4620 are compared in Figures 6 and 7. Absorption lines in the GN spectra are deeper and sharper than in their GS counterparts, reflecting the higher wavelength resolution of the GMOS-N spectra.
There are obvious similarities between the two sets of spectra in Figures 6 and 7. This similarity is of particular importance for NGC 4305, as the GMOS-N spectra of this galaxy were acquired by stepping the galaxy between two locations on the slit, allowing for better suppression of telluric emission features than was the case for the GMOS-S spectra of this same galaxy. The comparisons in Figure 7 validate the GMOS-S spectrum of NGC 4305. Residuals from telluric emission lines do not skew line strengths in the GS spectrum of NGC 4305, and this is confirmed in the next section where the line indices obtained from the GMOS-N and GMOS-S spectra are compared.


The higher resolution of the GN spectra should facilitate the detection of low level emission in the Balmer lines, and no evidence for emission is seen in H and H in the GN spectra. The higher resolution of the GN spectra also makes it easier to identify weak features, or those that are blended with other lines at lower resolution. However, line identifications can be ambiguous. For example, there is a C2 band head near 8750Å , and a feature near this wavelength is present in the GMOS-N spectra of NGC 4305 and NGC 4620. However, a Paschen series line also occurs at this wavelength. Given the prominent Balmer lines in the spectra of these galaxies, it is likely that the feature in question is due to hydrogen, and not C2.
5. LINE INDICES AND GRADIENTS
Spectral indices are one means of quantifying the depths of absorption and emission features in galaxy spectra. The majority of the indices used in the present study are in the Lick system, as summarized by Worthey et al. (1994). The Lick indices sample prominent features at visible wavelengths that are sensitive to metallicity, chemical mixture, and age. As noted by Worthey et al. (1994), these indices typically do not measure signal from a single element or molecule. While the targeted wavelength range contains a dominant atomic or molecular feature by definition, there are inevitably transitions from other species present. Likewise, wavelength intervals defined to measure the continuum are also subject to contamination. The indices discussed here are in an instrumental system, and most were selected for study because they have been shown to have a low sensitivity to spectral resolution. Indices in the same instrumental system are measured from model spectra, and compared with the observations in Section 6.
Puzia et al. (2013) examine the transformation of indices measured from GMOS spectra using the B600 grating into the Lick system. The B600 grating was used for the GMOS-N spectra of NGC 4305 and NGC 4620, thereby allowing a body of internally consistent indices to be selected from those examined by Puzia et al. (2013) that enable reliable galaxy-to-galaxy and intergalaxy (i.e. line gradient) comparisons. Indices measured for NGC 4305 and NGC 4620 in this internal system can then be used to calibrate measurements in the GMOS-S spectra (Section 5.2).
The transformation coefficients listed in Tables 4 ( pixel binning; 0.75 arcsec slit) and 5 ( binning; 0.5 arcsec slit) of Puzia et al. (2013) can be used to identify indices that have a low sensitivity to spectral resolution. The GMOS-N spectra of NGC 4305 and NGC 4620 were recorded with a 1 arcsec slit, and thus have a lower resolution than those used to construct Table 4 of Puzia et al. (2013). This difference notwithstanding, the resolution of the NGC 4305 and NGC 4620 spectra is closer to that of the native Lick system than the configuration used to produce the entries in Table 4 of Puzia et al. (2013).
A comparison of the entries in Tables 4 and 5 of Puzia et al. (2013) allows indices to be identified that (1) have transformation coefficients that agree at the level, and (2) monitor features that provide metallicity and age information. The indices that are measured in the GMOS-N spectra are: CN2, G4300, H, Mg2, Fe5270, Fe5335, NaD, and TiO2. A sub-set of these are measured in the GS spectra (Section 5.2). Three of the indices sample broad molecular features, and thus have a wide wavelength coverage that makes them largely immune to changes in spectral resolution. The other indices measure some of the strongest atomic features in galaxy spectra at visible wavelengths.
Other indices were also measured. The CaT index defined by Cenarro et al. (2001) probes metallicity in intermediate age and old populations. Smoothing experiments discussed by Cenarro et al. (2001) and Davidge (2018) show that the CaT index varies slowly with respect to changes in spectral resolution. The Ca triplet has been found to be most sensitive as a metallicity indicator among systems with [M/H] , although the metallicity sensitivity continues to higher metallicities among SSPs with ages Gyr (Figure 5 of Vazdekis et al. 2003). Still, the utility of the Ca triplet as a metallicity tracer in complex stellar systems may be subject to uncertainties in the chemical enrichment history of Ca. There is only a modest galaxy-to-galaxy dispersion in the depths of the Ca triplet lines when systems with a range of masses are compared. This could reflect a fixed [Ca/H] among the galaxies (e.g. Thomas et al. 2003a), and/or saturation in the metallicity sensitivity of Ca triplet lines among old, metal-rich populations.
Jones & Worthey (1995) and Worthey and Ottaviani (1997) discuss indices that measure the depths of H and H. These provide an independent measure of age, and so can be used to assess the influence of line emission on ages estimated from lower order Balmer lines. The entries in Tables 4 and 5 of Puzia et al. (2013) indicate that H is a relatively robust index in terms of spectral resolution, and so it is measured in the GMOS-N spectra of NGC 4305 and NGC 4620.
Two indices that are not in a standard system but that monitor the strengths of astrophysically interesting features are also discussed. One of these features is H, which has the potential to constrain age, with the caveat that H is more susceptible to contamination from line emission than higher order Balmer lines. In this study, the depth of H is measured in the wavelength interval 6540 to 6590Å . The continuum is measured in the intervals 6510 to 6540Å and 6590 to 6620Å .
Another index measures the depth of the CN band near 7900Å , which Davidge (2018) found is sensitive to the presence of C stars in the integrated light of intermediate age simple stellar systems. This CN band has been used in the past to distinguish between M giants and C stars in narrow-band photometric surveys (e.g. Richer, Crabtree, & Pritchet 1984; Cook, Aaronson, & Norris 1986). The CN7900 index is measured with continua in the wavelength intervals 7800 – 7875Å and 8005 – 8070Å, while the depth of the CN band is measured between 7875 and 7975Å. As with the other molecular indices discussed in this study, CN7900 measurements are in magnitude units.
5.1. Indices measured from the GMOS-N spectra of NGC 4305 and NGC 4620
The radial behaviour of the indices in NGC 4305 and NGC 4620 measured from the GMOS-N spectra is examined in Figures 8 – 10. Indices were measured from mean spectra of each galaxy in the 5 regions listed in Table 3. Figure 8 shows indices that are sensitive to age, while Figures 9 and 10 show indices that monitor metallicity and chemical mixture. Molecular indices are shown in Figure 9, and atomic indices in Figure 10. The Fe5270 and Fe5335 indices are summed in Figure 10 to increase the S/N ratio. Thomas et al. (2003b) define the hybrid [MgFe]’ index as a measure of total metallicity, and this is plotted for each galaxy in the lower panel of Figure 10. The error bars show random errors deduced from the scatter in the index measurements, and do not include systematic effects.


5.1.1 Age Sensitive Indices
The radial behaviours of H, G4300, H, and H are examined in Figure 8. The G4300 and Balmer indices monitor (at least in part) the spectral type of stars near the main sequence turn-off (MSTO), and so provide age information. If metallicity remains fixed then as one moves to progressively younger ages the temperature of stars near the MSTO increases, and the spectral type moves to earlier values. This results in a strengthening of the Balmer lines, and a decrease in the depth of the G-band. The sensitivity of G4300 to age is thus in the opposite sense to that of the Balmer lines: whereas the Balmer lines weaken as age increases, G4300 strengthens with increasing age (e.g. Figure 42 of Worthey 1994). G4300 and H are of special interest as they are less susceptible to contamination from emission than H and H.
Considering the uncertainties in the indices, G4300 is more-or-less constant with radius in NGC 4305, and this is consistent with the behaviour of the three Balmer indices. As for NGC 4620, G4300 strengthens with increasing radius while H and H weaken with increasing distance from the galaxy center. H also weakens with increasing radius when log(r) , which is the part of the galaxy that is dominated by bulge light, although it jumps to higher values in the last bin. To the extent that these indices track age then – with the exception of the H measurement in the outer most regions of NGC 4620 – the central regions of NGC 4620 may be younger than the surroundings.
5.1.2 Indices that Probe Metallicity
In Section 3 it was shown that decreases with increasing radius in NGC 4305, but not in NGC 4620. If tracks metallicity in these galaxies then the metallicity indices in NGC 4305 and NGC 4620 might show different radial behaviours. Molecular indices measured from the NGC 4305 and NGC 4620 GMOS-N spectra are shown in Figure 9. There is a tendency for CN2, Mg2, and TiO2 to remain more-or-less constant with radius in both galaxies, although Mg2 drops at large radii in NGC 4620. CN7900 is the only molecular index in Figure 9 that shows a systematic gradient in both galaxies, and there is remarkable agreement between the CN7900 measurements in both galaxies at all radii. This agreement is consistent with the modest dispersion in CN7900 obtained from the GS spectra of galaxies that do not show line emission, and this is discussed further in Section 5.2.
Indices that examine the strengths of atomic metal lines are shown in Figure 10. The Mgb and CaT indices define similar radial trends in each galaxy. There is not a systematic radial gradient in the Mgb and CaT indices in NGC 4305, and this is consistent with the behaviour of the Mg2 index. The Mgb and CaT indices drop at large radii in NGC 4620, and a similar dip is seen in the Mg2 index of this galaxy in Figure 9.
There is a tendency for Fe to weaken towards larger radii in NGC 4305, although the significance of this result is not clear given the error bars. As for NGC 4620, Fe stays more-or-less constant or may even rise with increasing radius, before dropping at larger radii. Similar behaviour is seen in the NGC 4620 Mgb measurements. The hybrid [MgFe]’ index stays constant throughout NGC 4305, while [MgFe]’ appears to climb with increasing radius in NGC 4620 before dropping in the outermost regions. This parallels the radial behaviour of the Mgb and Fe indices.
NaD was found to show steep, well-defined, gradients in the spectra of the early-type galaxies examined by Davidge (1992). NaD noticeably weakens with increasing radius in both NGC 4305 and NGC 4620. Given that other indices do not change with radius in NGC 4305, and may even climb with increasing radius in NGC 4620, then either the Na abundance in stellar photospheres does not track the abundances of other elements, and/or the depth of NaD may be affected by interstellar absorption. As the colors of these galaxies are not peculiar then the first explanation is favored. La Barbera et al. (2017) investigate the behaviour of multiple Na lines over a wide wavelength interval in the spectra of two moderately massive early-type galaxies. They find that while [Na/Fe] is more-or-less constant near the center of one galaxy, it drops at larger radii. They also find that NaD is more sensitive to [Na/Fe] than other Na I features at red and NIR wavelengths. Hence, [Na/Fe] may change with radius in NGC 4305 and NGC 4620.
In summary, with the exception of NaD and CN7900, there is no evidence for gradients in metallic features in NGC 4305. As for NGC 4620, metallic indices appear to stay constant or possibly even rise with increasing radius, before dropping at log(r) . The age-sensitive indices in the spectra of NGC 4305 reveal no hint of a gradient. However, there is evidence for a gradient in NGC 4620, in the sense that the center has deeper Balmer lines than the surroundings. An age gradient may complicate the interpretation of the metallic features in NGC 4620, and might even explain the negative atomic line gradients that are present when log(r) in this galaxy.
5.2. Indices measured from the GMOS-S Spectra
The GMOS-S spectra have a lower wavelength resolution than the GMOS-N spectra, and this compromises the ability to measure the depths of even moderately strong atomic features. Here, emphasis is placed on measuring indices from the GMOS-S spectra that have a wide wavelength coverage and/or that sample deep, isolated features. Metallicity in the GMOS-S spectra is then probed using the Mg2, TiO2, CN7900, and CaT indices. The NaD index is also measured as this traces a deep, isolated feature that exhibits well-defined gradients in other galaxies (Davidge 1992). Finally, the H and H indices are also examined to allow age to be examined.
The indices measured from the GMOS-S spectra are placed into the instrumental system defined by the GMOS-N spectra by comparing the indices obtained for NGC 4305 and NGC 4620 from both telescopes, computing an average offset for each index, and then applying the result to the GS index. While this is the simplest transformation possible, it is justified given that the spectroscopic properties of NGC 4305 and NGC 4620 are similar to those of NGC 4306 and NGC 4497 at all radii, as well as in the outer regions of NGC 4491 and NGC 4584. The Mg2, TiO2, and CN7900 indices for NGC 4305 and NGC 4620 measured from GMOS-N and GMOS-S agree to within a few thousandths of a magnitude. This excellent agreement is not surprising given the expected low sensitivity to spectral resolution for indices that span a broad wavelength range. As for the NaD and H indices, the differences between the GMOS-N and GMOS-S measurements is 0.3Å, in the sense that the GMOS-N indices are larger. The difference between the GN and GS CaT and H indices are 2.0Å (CaT) and 1.4Å (H).
The radial behaviour of indices measured in the GMOS-S spectra are examined in Figures 11, 12, and 13. Figures 11 and 12 show indices for the galaxies that do not have line emission, while Figure 13 shows indices for NGC 4491 and NGC 4584. Indices measured from the GMOS-N spectra of NGC 4305 and NGC 4620 are also plotted in Figures 11 and 12, and there is good agreement with the GMOS-S indices.
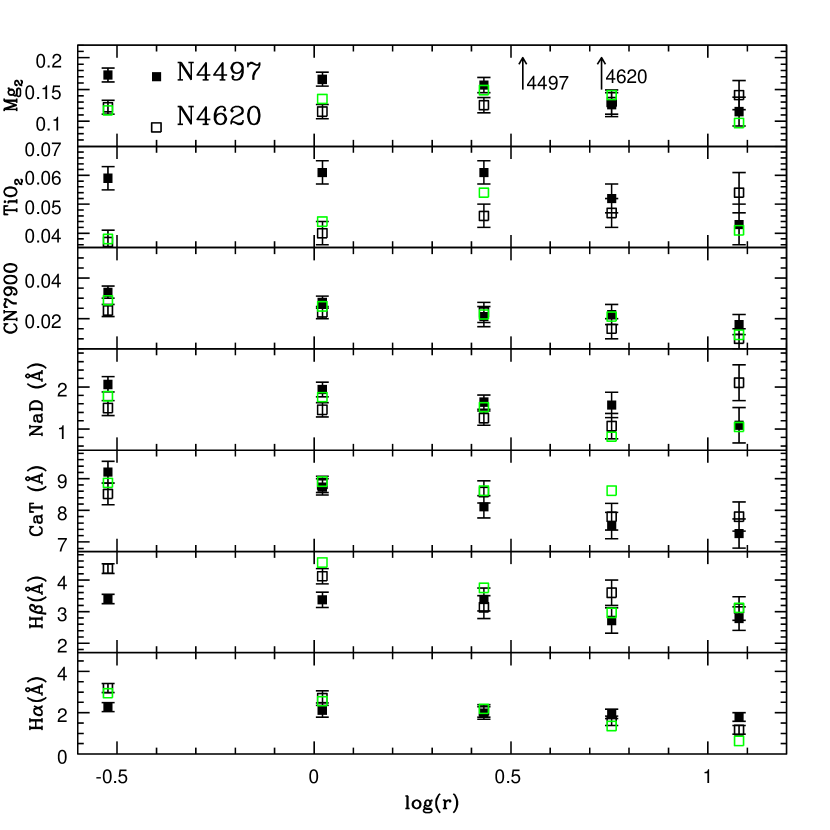

5.2.1 Mg2, TiO2, and CaT
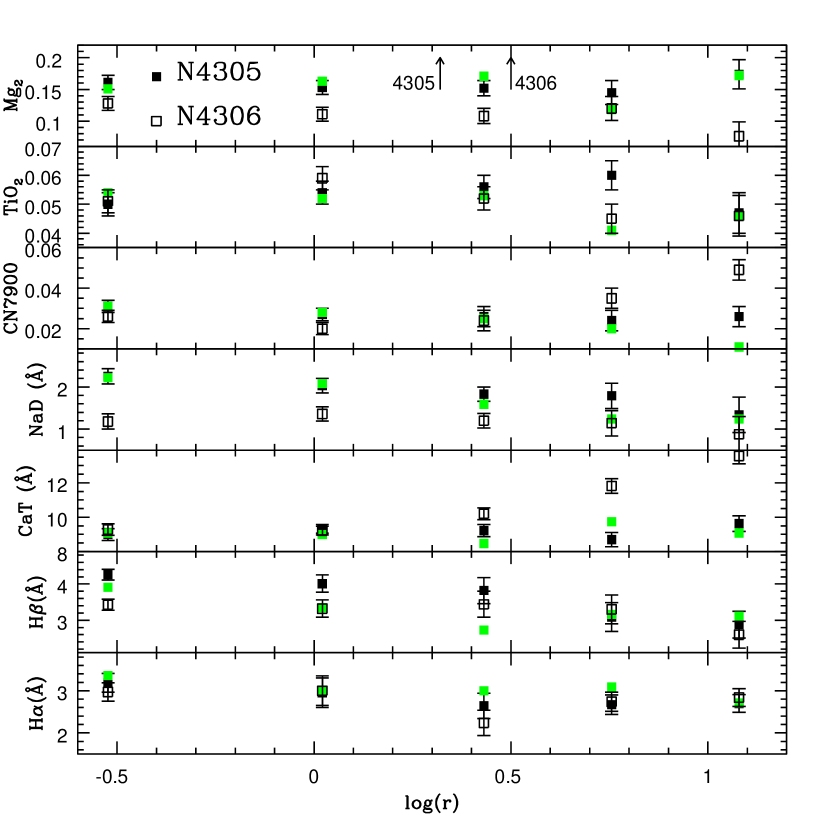
Mg2 is more-or-less constant with radius in the GMOS-S spectra of NGC 4305 and NGC 4620, in agreement with the measurements made from the GMOS-N spectra. There is a pronounced Mg2 gradient in NGC 4497, which also has the largest central Mg2 index of the six galaxies. NGC 4491 and NGC 4584 have the weakest central Mg2 indices, due to veiling by the blue continuum associated with the young stars that power the line emission at small radii in these galaxies. The negative Mg2 gradients in NGC 4491 and NGC 4584 reflect the changing radial contributions made by continuum emission.
The radial trends in the TiO2 indices more-or-less parallel those in Mg2, albeit with smaller radial variations than defined by Mg2. NGC 4620 appears to be an exception, as the GMOS-S TiO2 index in that galaxy has a negative gradient. Similar behaviour can be seen in some of the atomic indices measured in the GMOS-N spectra of that galaxy.
CaT is more-or-less constant with radius in NGC 4305, matching the behaviour of Mg2 and TiO2. There are CaT gradients in both NGC 4497 and NGC 4620. CaT stays more-or-less constant with radius in the emission line galaxies NGC 4491 and NGC 4584. This behaviour differs from that defined by Mg2 and TiO2 in these galaxies, but is similar to the radial behaviour of the NaD index. Finally, the tendency for CaT to strengthen with radius in NGC 4306 is likely a consequence of imperfect suppression of sky emission lines, which are plentiful at wavelengths near the Ca triplet.
The CaT indices in NGC 4491 and NGC 4584 are similar to those in the other galaxies. This is surprising given that other metallic indices in the spectra of these galaxies are veiled by a young stellar continuum. The Ca triplet is at redder wavelengths than the other features considered here, and so is less affected by a blue continuum. Still, the Ca lines in the central spectra of these galaxies likely do not originate in the RGB and AGB stars that dominate the spectra of the other galaxies. Instead, the Ca triplet lines near the centers of NGC 4491 and NGC 4584 likely reflect a significant contribution from RSGs, which will be present if there has been star-forming activity during the past few tens of Myr. Models suggest that the equivalent width of the Ca triplet in populations with an age 10 Myr may be 2 - 3Å higher than in populations with ages 100+ Myr (e.g. Figure 97 of Leitherer et al. 1999), and veiling by a featureless continuum will weaken these lines. A fortuitous amount of veiling is then required to produce CaT indices that match those in the galaxies with no line emission.
5.2.2 Indices that Probe Age: H and H
There is a tendency for H to weaken towards larger radii in NGC 4305, NGC 4306, NGC 4497, and NGC 4620. In contrast, H is either constant or changes only slightly with radius in these galaxies. Despite this seeming discrepancy between the behaviour of H and H, which could occur if H is partly filled by line emission in the central few arcsec of these galaxies, ages estimated from H and H are in reasonable agreement (Section 6), arguing that emission does not skew the H measurements in these four galaxies. As for NGC 4491 and NGC 4584, the H indices of these galaxies are skewed by line emission at small radii, and so do not track Balmer line absorption in the stars that make up the main body of these galaxies. The negative gradients in the H and H indices in those galaxies track the diminishing fractional contribution made by line emission towards progressively larger radii.
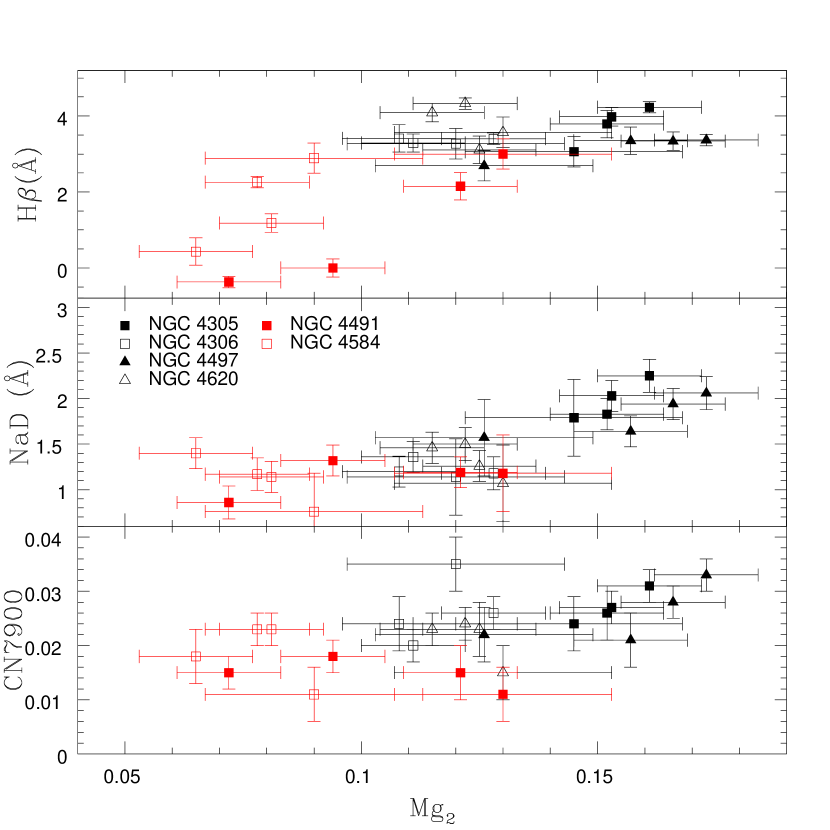
The behaviour of H with respect to Mg2 and CaT is investigated in the top panels of Figures 14 and 15. NGC 4491 and NGC 4584 follow trends in the H – Mg2 plane that differ from those defined by galaxies that do not have an emission spectrum. Still, the agreement between the emission-free and emission line galaxies improves when Mg, as line emission is greatly reduced in the parts of NGC 4491 and NGC 4584 that have larger Mg2 indices (i.e. at larger radii). This agreement suggests that the spectra at offsets arcsec from the centers of NGC 4491 and NGC 4584, where light from the disk dominates over that of the bulge, sample regions where H and H may be largely free of line emission, or are at least subject to similar levels of contamination from line emission as in the galaxies that do not show obvious signs of emission in their spectra.
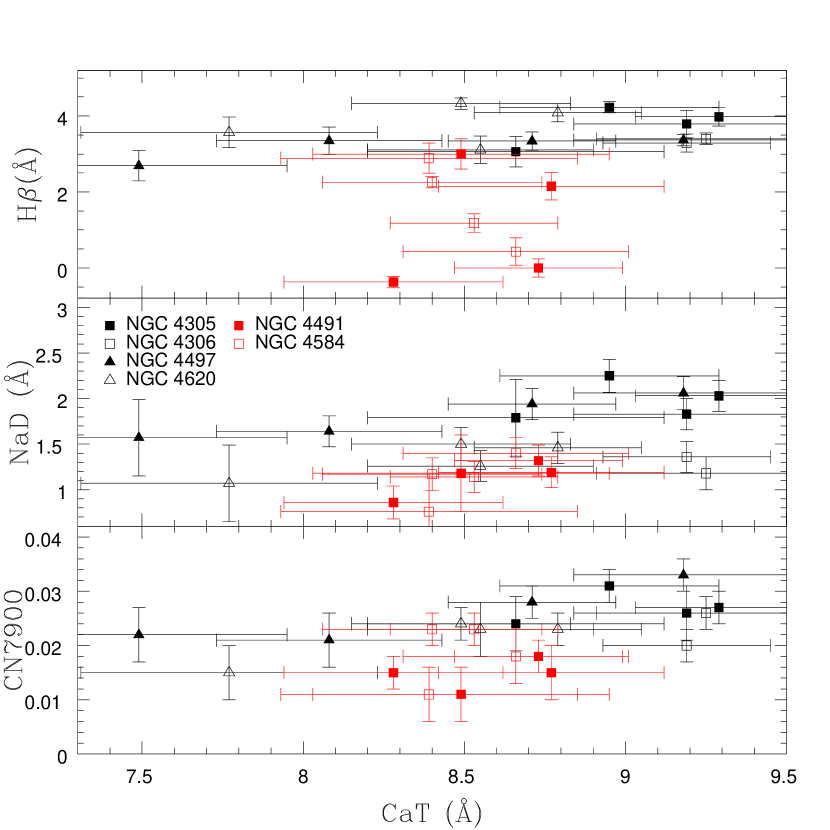
Points from NGC 4305, NGC 4306, NGC 4497, and NGC 4620 define a more-or-less linear relation between H and CaT in the top panel of Figure 15. The NGC 4491 and NGC 4584 points in the upper panel of Figure 15 follow trends that differ from those defined by the other galaxies. It is worth noting that whereas most of the NGC 4491 and NGC 4584 points fall to the left of the main body of points in Figure 14, the CaT indices in NGC 4491 and NGC 4584 are similar to those in the galaxies with spectra that are free of emission.
5.2.3 NaD
There is evidence for interstellar material in some of the target galaxies, and this could complicate the interpretion of the radial behaviour of NaD. In particular, NGC 4491 and NGC 4584 have central and colors that are comparatively red, with the color pointing to centrally-concentrated emission from hot dust (Section 3). Barring the presence of a fortuitously large population of evolved red stars, these results are consistent with measureable levels of extinction at visible wavelengths near the centers of these galaxies. The NaD index is more-or-less constant with radius in both galaxies, whereas the other metallic features in these galaxies show a range of behaviours. NGC 4305, NGC 4306, NGC 4497, and NGC 4620 have colors that are not indicative of significant dust absorption, and there is a tendency for NaD to weaken towards larger radii.
The behaviour of NaD with respect to Mg2 and CaT is examined in the middle panels of Figures 14 and 15. NaD increases more-or-less in step with Mg2 and CaT in NGC 4305, NGC 4306, NGC 4497, and NGC 4620. There also appears to be a systematic offset between the NGC 4305 and NGC 4497 NaD indices at large Mg2, in the sense that the NGC 4497 indices fall below those of NGC 4305. A similar offset is seen in the other panels of Figure 14, although a corresponding offset is not present between the NGC 4305 and NGC 4620 sequences in the middle panel of Figure 15. This might point to higher [Mg/Na] in NGC 4497 when compared with NGC 4305. La Barbera et al. (2017) find that [Na/Fe] tracks [/Fe] in the one galaxy of their sample from which they were able to extract spectral information over a range of radii.
The NaD indices for NGC 4491 and NGC 4584 NaD fall along the general trend defined by non-emission line galaxies in Figure 14, and occupy the lower envelope of the NaD CaT distribution in the middle panel of Figure 15. There is overlap in the areas occupied by NGC 4491 and NGC 4584 in the middle panels of both figures. This overlap is of interest as the central and colors of NGC 4491 and NGC 4584 differ, suggesting that there might be differences in the amount of obscuration and in the characteristic dust temperature. That NGC 4491 and NGC 4584 occupy similar areas of the NaD Mg2 and NaD CaT diagrams argues that dust may not be the sole contributor to NaD absorption in the central regions of these galaxies.
5.2.4 CN7900
CN7900 is roughly constant with radius throughout NGC 4305 and the inner regions of NGC 4306. Although CN7900 rises in the last two radial bins in NGC 4306, this is likely the result of uncertainties in sky subtraction. There is a tendency for CN7900 to weaken towards larger radius in NGC 4497 and NGC 4620.
The behaviour of CN7900 with respect to Mg2 and CaT is examined in the lower panels of Figure 14 and Figure 15. The CN7900 measurements among the four galaxies that lack line emission form a clear relation when Mg in Figure 14. The NGC 4306 point that falls above the other points in the lower panel of Figure 14 is at large radii, and is likely affected by uncertainties in sky subtraction. The otherwise tight relation defined by non-emission line galaxies in Figure 14 suggests a small galaxy-to-galaxy dispersion in the properties of the stars that contribute to this feature. A corresponding relation between CN7900 and CaT is also evident in Figure 15. The CN7900 measurements from NGC 4491 define the lower envelope of the data distributions in the lower panels of Figures 14 and 15.
CN7900 stays roughly constant with radius in NGC 4491 and NGC 4584. This is a surprising result given the evidence for centrally concentrated young populations in these galaxies. The CN band near 7900Å is present in the spectra of RSGs, and these stars likely produce the deep Ca triplet lines seen at small radii in the spectra of these galaxies. RSGs may then be the source of the CN absorption in the spectra of NGC 4491 and NGC 4584 at small radii. Still, some of the CN7900 measurements in NGC 4491 and NGC 4584 fall along the trend defined by the other galaxies in the lower panel of Figure 14. Curiously, the CN7900 measurements in NGC 4491 and NGC 4584 that are farthest from the trend defined by the other galaxies are at large radii, and are in the sense that CN7900 is weaker than in the non-emission galaxies. This hints at a possible difference in the stellar contents of the disks of NGC 4491 and NGC 4584 when compared with the disks of the other galaxies.
6. COMPARISONS WITH MODELS
The ages and metallicities of the stars that dominate the integrated light at visible and red wavelengths have been estimated by making comparisons with the depths of selected features in model spectra of SSPs. While galaxies are complex stellar systems, comparisons with SSP models allow characteristic ages and metallicities of the stars that dominate the light to be determined. The results provide insights into the last major episode of star-forming activity in these galaxies. This in turn provides information for assessing their evolution and relationship with other galaxies in Virgo.
Model spectra from the Bag of Stellar Tricks and Isochrones (BaSTI) compilation (Cordier et al. 2007; Percival et al. 2009) have been adopted for these comparisons. The BaSTI models use the evolutionary tracks described by Pietrinferni et al. (2004) and Cordier et al. (2007). These models cover a wide range of ages, metallicities, and wavelengths, and include evolution on the thermally-pulsing AGB (TP-AGB). Light from TP-AGB stars provides a progressively larger contribution towards longer wavelengths, and can account for a significant fraction of the light in the NIR. The wide wavelength coverage of these models permit consistent comparisons to be made with the NIR spectra that are the subject of Paper II. The models used here assume a Reimers (1975) mass loss coefficient of 0.4, and are from the high spectral resolution group of models.
Model spectra were downloaded from the BaSTI website 222http://basti.oa-teramo.inaf.it/. These were smoothed to simulate the wavelength resolution of the GMOS-S spectra, and then re-sampled to match the wavelength cadance of the observations. The model spectra were continuum-corrected using the same order of fitting function as was applied to the science data.
Comparisons are made with indices obtained from the GMOS-S spectra, as the depths of features in the GMOS-N spectra match those in the GMOS-S data. While not utilizing the full body of information that is available in a spectrum, spectral indices provide guidance for selecting models that reproduce key elements of a spectrum in a controlled manner that allows the information from features that are sensitive probes of age – like H – to be exploited. The veracity of the results and the assumptions made in constructing the models, such as chemical mixture, can then be checked by making comparisons with parts of the spectrum not used to determine age and metallicity.
Comparisons with models are restricted to angular intervals where line emission is not detected. Two spectra were constructed for NGC 4305, NGC 4497, and NGC 4620: (1) the means of regions 1 and 2 (hereafter the ‘central’ region), and (2) the means of regions 4 and 5 (hereafter the ‘disk’). Given the uncertainties in the spectra at large angular offsets due to poor sky subtraction then only a central spectrum was constructed for NGC 4306. As for the galaxies with line emission, a disk spectrum was constructed for NGC 4491 by combining the spectra of Regions 4 and 5, whereas for NGC 4584 – where line emission is seen over a larger radial interval – the disk spectrum is taken to be that of Region 5.
6.1. Ages and Metallicities Estimated from Index–Index diagrams
H, Mg2, H, and CaT indices were measured from scaled-solar chemical mixture model spectra with metallicities Z=0.004, Z=0.008, and Z=0.019. The results are compared with indices obtained from the galaxy spectra in Figures 16 and 17. H and H probe age, while Mg2 (Figure 16) and CaT (Figure 17) are proxies for metallicity.
Unlike most metallic and molecular features, the depths of the Ca lines are relatively stable to changes in age. This is apparent in Figure 17, where the dispersion in the CaT indices for the Z=0.008 and Z=0.019 sequences is over an age range of 0.2 Gyr to 10 Gyr. In contrast, the model sequences in Figure 16 slash diagonally across the H vs Mg2 and H vs. Mg2 diagrams. Given this difference in behaviour, a comparison of the ages estimated from Figures 16 and 17 is of obvious interest.
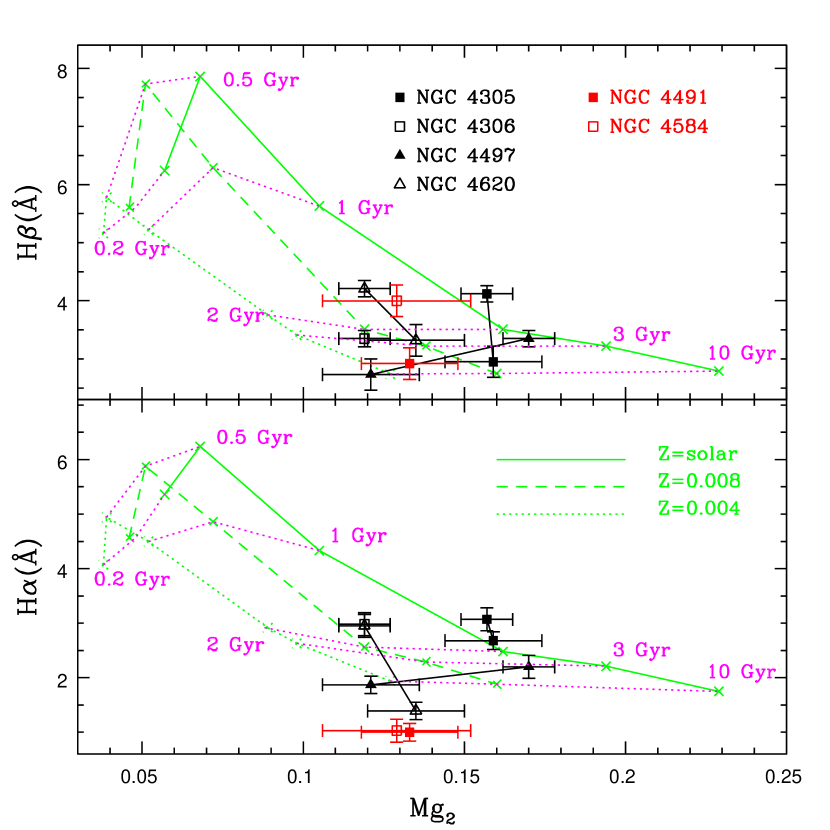
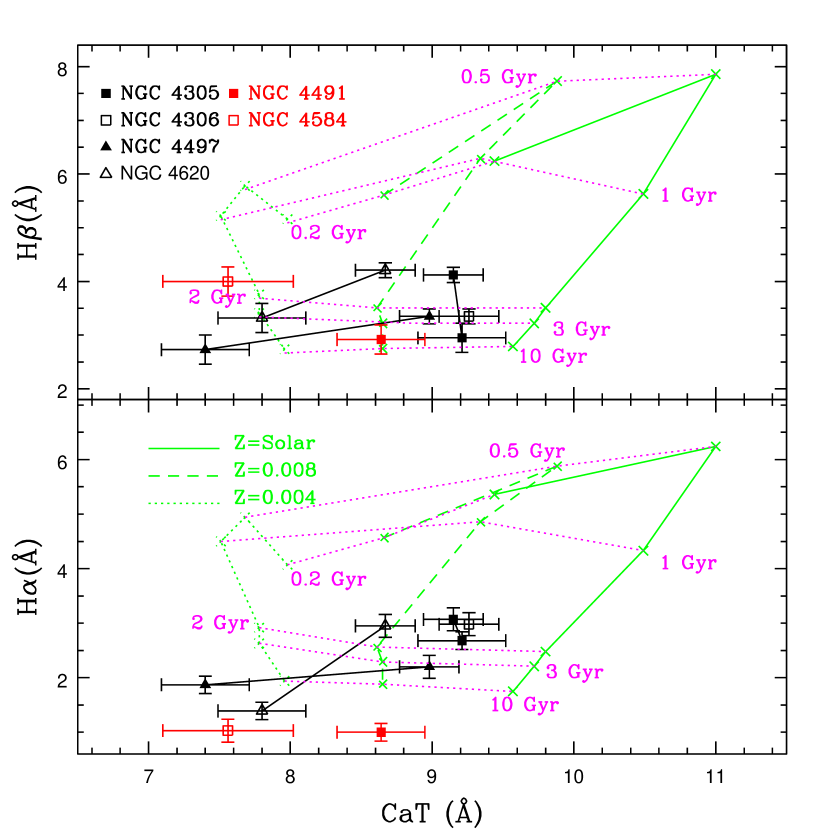
The location of the galaxies in Figures 16 and 17 indicate that there is only a modest age dispersion among the central regions of NGC 4305, NGC 4306, NGC 4497, and NGC 4620. The central regions of NGC 4305, NGC 4306, and NGC 4620 have luminosity-weighted ages of Gyr, while the center of NGC 4497 may be a Gyr older. The ages estimated from H and H for these galaxies are in reasonable agreement. This consistency lends confidence to the age estimates, while also suggesting that line emission has not skewed the equivalent width of H. The modest dispersion in the nuclear ages of these galaxies hints that an external factor that is common to all four systems – such as environment – likely played a key role in defining the recent evolution of these systems. If this is the case then these galaxies are not recent additions to the Virgo cluster, but have evolved under its influence for at least Gyr, or at least one cluster crossing time (Boselli & Gavazzi 2006).
The inner disk points fall in parts of Figures 16 and 17 where a small change in the equivalent width of H and H can alter the age by a Gyr or more, and so the age dispersion among the inner disks of these galaxies may be larger than between the central regions. The outer regions of NGC 4305, NGC 4497, and NGC 4620 have ages that are older than the central regions of their hosts, although the H measurements of NGC 4305 are consistent with a modest difference in age between the central and inner disk of that galaxy. The age of the inner disk of NGC 4620 estimated from H is Gyr, whereas an age Gyr is estimated from H. This suggests that emission may partially fill H in the disk spectrum of that galaxy. The H and H measurements for the inner disk of NGC 4497 are both consistent with an age of 10 Gyr. NGC 4497 also has the oldest central regions, with an age Gyr. NGC 4497 thus appears to be the galaxy in our sample for which star formation has been truncated the longest.
As for NGC 4491 and NGC 4584, if H in the outer region of NGC 4584 is free of line emission then it has an age that is comparable to the centers of the other galaxies. The outer regions of NGC 4491 may be even older. It thus appears that – with the obvious exception of the central regions of NGC 4491 and NGC 4584 – there has not been large-scale star formation in these galaxies since intermediate epochs.
Previous studies have estimated the age of NGC 4305. The blue/yellow spectrum of NGC 4305 was examined by Fraser-McKelvie et al. (2016) in a study of six candidate passive spiral galaxies. They find that NGC 4305 has the deepest H and H lines in their sample. They estimate a characteristic age of 1 Gyr for NGC 4305 from the D4000 index, whereas the other galaxies in their sample have ages Gyr, with a mean of 2.3 Gyr. We find an age of Gyr for the central regions of NGC 4305 based on the depths of the Balmer lines.
Roediger et al. (2012) used broad-band colors extracted from observations to estimate the age of NGC 4305, and found an age of Gyr. The GMOS spectra predict a much younger age for NGC 4305 than that found by Roediger et al. (2012). There is considerable radial jitter in the photometric age estimates, but when averaged over larger angular scales there is an overall tendency for the Roediger et al. age estimates to stay constant or increase with increasing radius. The radial behaviour of H and H in the GMOS spectra is consistent with an age gradient.
The metallicities inferred from the models in Figures 16 and 17 differ from galaxy-to-galaxy. The central regions of NGC 4305 and NGC 4497 are the most metal-rich in the sample, and the Mg2 indices are indicative of solar or possibly even slightly super-solar metallicities for the centers of these galaxies. However, the CaT indices indicate metallicities that are dex lower.
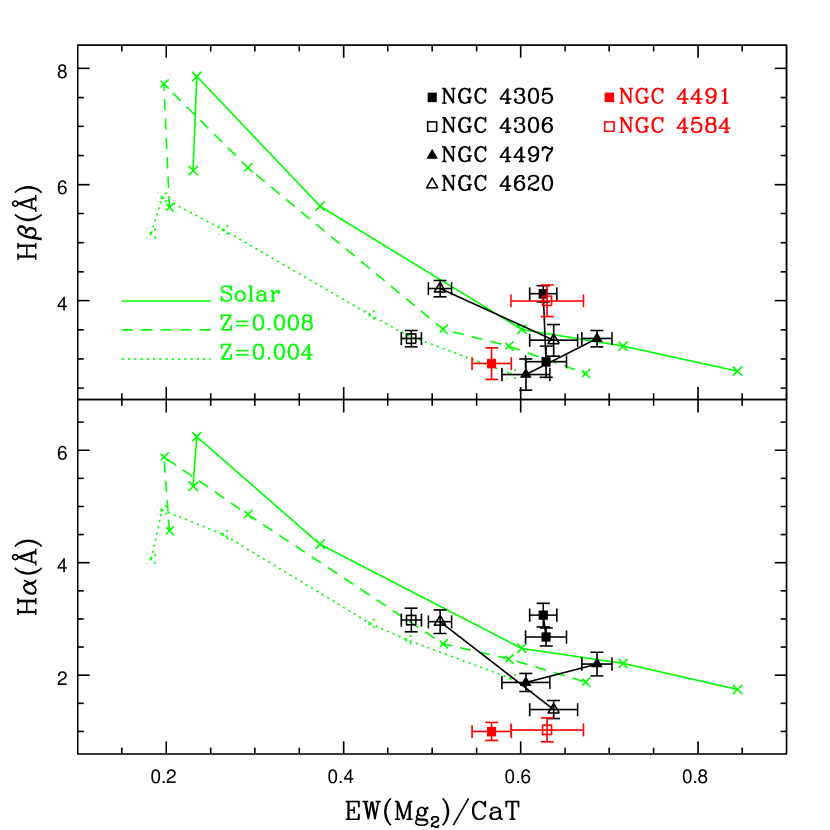
To further examine if [Mg/Ca] differs from that assumed by the models, the behaviour of H and H with respect to the ratio of Mg2 to CaT are shown in Figure 18. The equivalent width of Mg2 in Å was calculated from the Mg2 magnitude measurements. The Mg2/CaT ratio changes with metallicity due to the overall shift in color of the evolutionary sequences and the resulting changes in the contribution that bright main sequence stars make to the light at wavelengths near Mg2.
The galaxies scatter about the model predictions in the top panel of Figure 18. Some galaxies depart from the model sequences in the bottom panel, and this is attributed to contamination from H emission. The locations of NGC 4305, NGC 4306, and NGC 4497 in Figure 18 are consistent with their locations in Figure 16, suggesting that the [Mg/Ca] mix is consistent with that assumed for the models.
6.2. Comparisons with Fe Lines and NaD
The model spectra match the depths of other features not considered in Figures 16 and 17, and this is demonstrated in Figure 19 where comparisons are made with the central spectra of NGC 4305, NGC 4306, NGC 4497, and NGC 4620. Spectra of NGC 4491 and NGC 4584 are not shown given that continuum emission will veil absorption features in their central spectra. The wavelength regions shown in this figure contain deep Fe lines (left hand panel), and the NaD blend (right hand panel). Comparisons are made with Z=0.008 and Z=0.019 models with an age of 2 Gyr. This age and range of metallicities reflects those found from Figures 16 and 17.
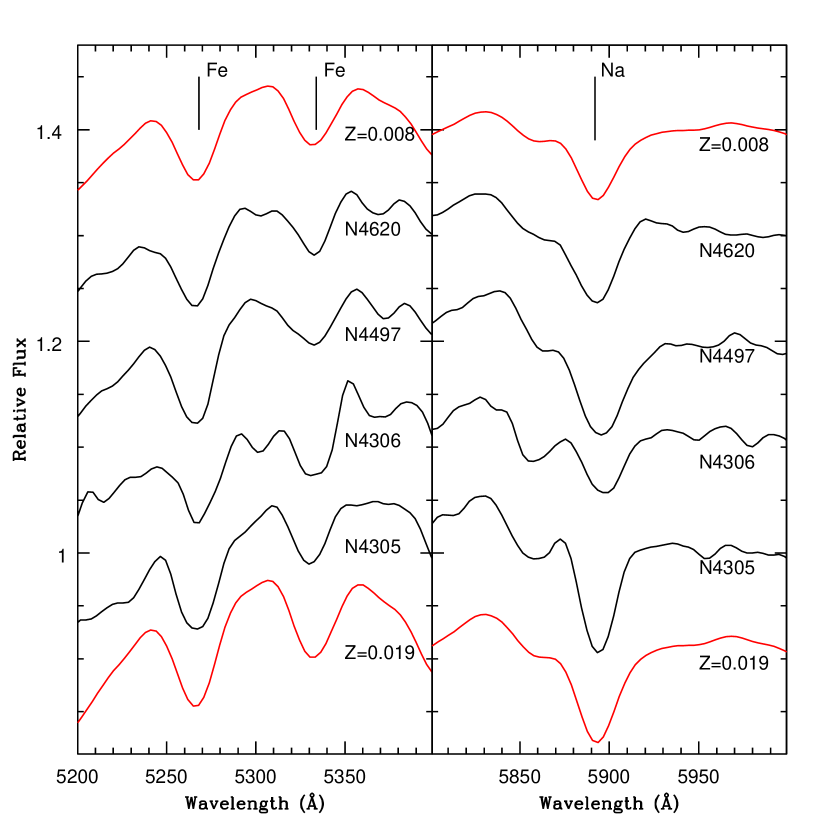
The Fe lines near 5270Å and 5335Å are among the strongest Fe features in the visible wavelength region. The Fe lines provide insights into chemical mixture and total metallicity when compared with features like the Mg triplet near 5170Å . The depths of the Fe lines at 5270 and 5335Å in Figure 19 generally fall within the range defined by the Z=0.008 and Z=0.019 models. The deepest Fe lines are in NGC 4305, and these have a depth that is consistent with Z=0.019. The weakest Fe lines are in NGC 4306, which are matched best by the Z=0.008 model. The relative depths of the Fe lines in these two galaxies is thus consistent with their locations in Figure 16. In contrast, the positions of NGC 4305 and NGC 4306 in Figure 17 suggests that the centers of these galaxies have similar metallicities. This is not consistent with the depths of the Fe lines in the spectra of these galaxies. As for the other galaxies, the Fe lines in NGC 4497 are intermediate in strength between the Z=0.008 and Z=0.019 models, while those in the NGC 4620 spectrum tend to match the Z=0.008 models. Thus, the relative strengths of the Fe lines in NGC 4497 and NGC 4620 are more-or-less consistent with the metallicities inferred from Figures 16 and 17.
Of the various Na features at visible, red, and NIR wavelengths, NaD is the most sensitive to [Na/Fe] (La Barbera et al. 2017). While the depth of NaD can be affected by interstellar absorption, the colors of the galaxies examined in Figure 19 suggest that there are not large amounts of absorbing material, and so the depth of NaD either reflects [Na/Fe] or a mass function that contains a different fraction of low mass stars than considered in the models. We consider the latter possibility to be unlikely given the depths of other features in the spectrum, and this issue will be revisited in the next paper of this series (Davidge 2018, in preparation). Inspection of Figure 19 shows that the depth of NaD in the central spectrum of NGC 4305 is consistent with Z , and NGC 4305 is the only galaxy to show stronger than expected NaD absorption. NaD is shallowest in NGC 4306, where it is consistent with – or even weaker than – the Z=0.008 model. To the extent that NGC 4305 and NGC 4306 have a solar neighborhood-like mass function then [Na/Fe] in their central regions. An enhanced [Na/Fe] has been found in other early-type galaxies (La Barbera et al. 2017).
In summary, the behaviour of features that were not considered when estimating age and metallicity in Figures 16 and 17 tend to be consistent with the results found from Figure 16, where Mg2 is a proxy for overall metallicity, rather than Figure 17, where CaT is the proxy. Thomas et al. (2003a) argue that Ca may be underabundant in early-type galaxies, and this is one possible explanation for some of the differences between the metallicities deduced from Mg2 and CaT in Figures 16 and 17. Nevertheless, that there appears to be a near-solar Mg and Fe mixture argues that these galaxies experienced prolonged chemical enrichment before star formation was truncated.
7. DISCUSSION AND SUMMARY
Deep long slit spectra have been used to investigate the stellar contents of six moderate mass early-type disk galaxies in the Virgo cluster. Five of the galaxies were classified by Lisker et al. (2006a) as ’dwarf-like’ S0/Sa. These objects differ from their more massive counterparts in that their central light profiles are more akin to those of dEs, rather than the bulge-dominated central regions of classical lenticulars. The disks of two galaxies (NGC 4305 and NGC 4620) have noticeable spiral structure. The sixth galaxy – NGC 4306 – is not classified as a dwarf-like S0/Sa. However, it is still related to the others, as Lisker et al. (2006a) found it to be one of the few Virgo dE galaxies to have a ‘certain disk’. The galaxies have similar integrated K-band magnitudes, indicating similar total masses. Their projected location on the sky suggests that they sample a range of environments within the cluster.
The stellar contents of these galaxies provide insights into the nature of their progenitors and the mechanisms that have shaped their present-day properties. To this end, comparisons are made with model spectra to estimate luminosity-weighted ages and metallicities. A key result is that the dominant source of light from the central regions of all six galaxies is not an old population, but instead is either a young or an intermediate age population. There is a factor of two dispersion in the metallicities of NGC 4305, NGC 4306, NGC 4497, and NGC4620, and the luminosity-weighted ages of their central regions are Gyr, indicating that there has not been recent large-scale star formation. The characteristic ages for the centers of these four galaxies are on the same order as the crossing time of the Virgo cluster (1.7 Gyr; Boselli & Gavazzi 2006), and overlap with the truncation times for large-scale star formation in a sample of early and late-type galaxies in Virgo selected from the HRS (Boselli et al. 2016). Ages for these galaxies estimated from H and H tend to agree, indicating that significant emission is not lurking in the H line. Some of the galaxies harbor radial age gradients, in the sense of older ages at larger radii. This is consistent with the radial behaviour of broad-band radial colors of dE(is)s by Lisker et al. (2008).
There are caveats to the ages estimated here. The spectrograph slit samples only a modest fraction of each galaxy. However, any stars that formed during recent large-scale star formation would disperse throughout the galaxy over the course of a few disk rotation times (i.e. within the past few hundred Myr), and so should be detected if they occured in large numbers. Another caveat is that luminosity-weighted ages depend on wavelength, and observations at other wavelengths may recover additional insights into these systems. Even modestly-sized young populations can dominate the SED in the UV while leaving no signatures at visible wavelengths (e.g. Vazdekis et al. 2016). Of the four galaxies with intermediate-aged central regions, NGC 4497 is the only one that was imaged with GALEX. The center of NGC 4497 is barely detected in the FUV channel. If a young component is present near the center of NGC 4497, it makes only a puny contribution to the overall central mass. This is consistent with the 3–4 Gyr age estimated for the central regions of this galaxy.
NGC 4491 and NGC 4584 differ from the other galaxies in that there are signs of very recent star-forming activity in their central regions. The relative strengths of [SII]6746 and H emission in the spectra of both galaxies is consistent with photoionization by massive hot stars. The comparatively red central colors of both galaxies further suggests that centrally-concentrated hot dust is present, which could be heated by massive, hot main sequence stars. Neither galaxy was flagged by Lisker et al. (2006b) as having a blue nucleus or a morphology similar to that of blue nucleated dEs. This non-detection is likely due to dust obscuration that reddens the star-forming region, and highlights the importance of spectra for identifying young populations in early type dwarf galaxies in Virgo.
Examining the mechanism(s) that triggered the recent star-forming activity in NGC 4491 and NGC 4584 might provide insights into the evolution of the other four galaxies. The angular offsets from M87 listed in Table 1 indicate that both NGC 4491 and NGC 4584 have projected distances of only a few hundred kpc from this galaxy, which lies near the center of the Virgo cluster. If these galaxies retained external dust reservoirs within the past Gyr, then interactions with other galaxies may have sparked galaxy-wide levels of elevated star formation, and caused gas and dust to be funneled into the inner regions of these galaxies. Elevated levels of star-forming activity in star bursts may last a few hundred Myr (e.g. McQuinn et al. 2010), and the last vestages of this activity tend to be found in the central regions of a galaxy. Centrally-concentrated star-forming activity can remain for some time after star formation in the outer regions of the galaxy has been curtailed (e.g. Soto & Martin 2010). However, the comparatively old ages of the disks of NGC 4491 and NGC 4584 hints that the present-day star-forming activity in these galaxies is not the remnant of a classical galaxy-wide star burst.
Grootes et al. (2017) suggest that spiral galaxies in dense environments that have been stripped of gas may be able to re-acquire gas by accreting material from the intrahalo medium (IHM). If the gas acquired from the IHM has no angular momentum, then it will dilute the overall angular momentum content of the host disk. If significant quantities of low angular momentum IHM gas can be accreted in the dynamically hot environment like Virgo, then it could provide material to fuel centrally-concentrated star formation in NGC 4491 and NGC 4584. If a significant fraction of the metals in the IHM were formed early-on in the evolution of Virgo then the accreted gas will show chemical signatures of rapid star formation, such as [O/Fe] . Still, if accretion of this nature is at play in NGC 4491 and NGC 4584 then why are elevated levels of star formation not seen in the centers of the other galaxies? Also, if gas is accreted and retained then there might be spatially extended low ionization emission (e.g. Belfiore et al. 2017), and evidence for this is not seen.
While NGC 4491 and NGC 4584 share evidence for recent star formation, it does not mean that the same mechanism for fueling and triggering star formation is at work in both galaxies. In fact, the central structural properties of these galaxies are very different. The Sersic index measured for NGC 4491 by McDonald et al. (2011) is at the low end of that found in late-type spirals and dEs. This measurement is likely influenced by the bar in NGC 4491, and such a structure may trigger the infall of star-forming material into the center of that galaxy. In contrast, McDonald et al. (2011) find that a Sersic index of 1.3 matches the light profile of the central regions of NGC 4584 in . Such a Sersic index is similar to those measured from the central light profiles of classical Sa and Sb galaxies in Virgo (Table 2 of McDonald et al. 2011), and suggests that NGC 4584 may contain a classical bulge. If NGC 4584 contains a classical bulge then the star-forming activity in its central regions may be independent of events at larger radii. Indeed, Morelli et al. (2016) find that the properties of bulges in isolated galaxies are not related to overall morphology, and argue that bulges and disks evolve separately.
While there is a wide dispersion in the central spectrophotometric properties of all six galaxies, there is only a modest galaxy-to-galaxy dispersion in the depth of H and Mg2 a few arcsec from the galaxy centers. This agreement extends to broad band colors, as the colors of all six galaxies fall between 0.9 and 0.95 at major axis distances of 10 arcsec from the nucleus. The galaxy-to-galaxy agreement in the spectrophotometric properties of the disks is perhaps surprising, given that some of the galaxies have spiral structure. NGC 4305 hosts the most prominent spiral arms (Lisker et al. 2006a), but the H index of its disk is not indicative of a markedly younger luminosity-weighted age than in the other galaxies. That the galaxy disks have similar old ages suggests that these galaxies have been in Virgo for some time, or that they were anemic prior to accretion onto the cluster. The similarity in inner disk ages despite a broad range in central ages is consistent with the the evolution of the nuclei being defined by the characteristics of the nucleus itself, as suggested by Côté et al. (2006).
Despite evidence that these galaxies are not recent additions to the Virgo cluster and signs that their interstellar mediums have been depleted, there are indications that these galaxies have not been subject to large-scale stripping of their stars, and that they have had sustained star-forming periods on Gyr timescales prior to the removal of gas. In regard to the absence of large-scale stellar stripping, the model spectra that best match those of the galaxy centers and inner disks have metallicities that are consistent with their integrated brightnesses. That the galaxies do not deviate significantly from the luminosity–metallicity relation suggests that they were not stripped of large amounts of stars or interstellar material during their early evolution, when the bulk of their stars presumably formed.
Evidence for extended star-forming episodes comes from the chemical mixture. Stars in a system that has experienced more-or-less continuous (at least when averaged over the timescale for the onset of SNeII) star-forming activity will have chemical mixtures that differ from those of stars in a system that has had sporatic star-forming events interupted by the purging of star-forming material. In Section 6 it was shown that the metallicities estimated from the Mg2 and CaT indices do not always agree, in the sense that the metallicities found using the CaT index may be lower than those based on Mg2. Some of the galaxies may then have [Ca/Mg] that differs from the solar mixture assumed for the models. Still, the depths of Fe features tend to be consistent with the metallicity deduced from Mg2, rather than the CaT. Given the difference in time spans in the production of Mg and Fe then this suggests that star-forming material must have been retained and enriched for some time in these galaxies.
Based on the diffuse spatial distribution of disky dwarf galaxies in Virgo, Lisker et al. (2006a) suggest that the orbits of dE(di)s have not yet been virialized, implying that they may be more recent additions to Virgo than the galaxies that define concentrated spatial distributions. Lisker et al. (2006b; 2007) argue that dE(di)s were originally late-type spiral galaxies that have been subjected to harassment by Virgo members. Toloba et al. (2012) examine the structural properties of a sample of bright dEs in Virgo, half of which are dE(di)s, and the structural characteristics of these galaxies are consistent with them being transformed late-type galaxies. A similar conclusion was reached by Toloba et al. (2015) using a larger sample of dEs. Toloba et al. (2015) argue that the galaxies in their sample experienced gas removal on rapid timescales that are more in line with ram pressure stripping, rather than harassment. However, the Gyr or more difference in age between the central regions of these galaxies and their disks exceeds the time scale expected for ram pressure stripping in a dense environment (e.g. Steinhauser, Schindler, & Springel 2016), suggesting that ram pressure stripping alone can not explain the SFHs of these galaxies.
NGC 4306, NGC 4491, and NGC 4497 contain bars, and these structures may induce radial mixing of stellar content. In the case of NGC 4491, the young centrally-concentrated population in this galaxy complicates efforts to assess any abundance gradient. While the radial coverage of NGC 4306 is limited, there is no evidence of an abundance gradient in its central regions (Section 5). The depths of metallic lines vary with radius in NGC 4497 (Section 5), due to a radial variation in mean metallicity (Section 6). Thus, there is no evidence that the bar in NGC 4497 has mixed the stellar content of this galaxy.
We close the discussion by noting that while the properties of these galaxies have likely been affected by environment, secular processes may also have played a role in shaping their present-day properties. Kwak et al. (2017) examines the evolution of a simulated low-mass disk galaxy that is based on the dE(di) VCC 856, which has an MB that is magnitudes fainter than NGC 4306. When evolved in isolation, Kwak et al. (2017) find that a bar forms at two different times, and the eventual buckling of these bars produces peanut and X-shaped bulges. Therefore, while some of the galaxies studied here have bars, these may not be the result of interactions. Spiral structure also forms from material that originates at the bar ends in these simulations; the spiral structure seen in the present-day galaxies likely does not reflect the original morphology of the progenitor.
References
- (1)
- (2) Adelman-McCarthy, J. K., Agueros, M. A., Allam, S. S., et al. 2008, ApJS, 175, 297
- (3)
- (4) Armandroff, T. E., & Zinn, R. 1988, AJ, 96, 92
- (5)
- (6) Auld, R., Bianchi, S., Smith, M. W. L., et al. 2013, MNRAS, 428, 1880
- (7)
- (8) Baldwin, J., Phillips, M., & Terlevich, R. 1981, PASP, 93, 5
- (9)
- (10) Belfiore, F., Maiolino, R., Maraston, C., et al. 2017, MNRAS, 466, 2570
- (11)
- (12) Binggeli, B., Sandage, A., & Tammann, G. A. 1985, AJ, 90, 1681
- (13)
- (14) Boselli, A., & Gavazzi, G. 2006, PASP, 118, 517
- (15)
- (16) Boselli, A., Eales, S., Cortese, L., et al. 2010, PASP, 122, 261
- (17)
- (18) Boselli, A., Roehlly, Y., Fossati, M., et al. 2016, A&A, 596, A11
- (19)
- (20) Bressan, A., Marigo, P., Girardi, L., et al. 2012, MNRAS, 427, 127
- (21)
- (22) Cardelli, J. A., Clayton, G. C., & Mathis, J. S. 1989, ApJ, 345, 245
- (23)
- (24) Carter, D. 1978, MNRAS, 182, 797
- (25)
- (26) Cenarro, A. J., Cardiel, N., Gorgas, J., Peletier, R. F., Vazdekis, A., & Prada, F. 2001, MNRAS, 326, 959
- (27)
- (28) Cordier, D., Pietrinferni, A., Cassisi, S., & Salaris, M. 2007, AJ, 133, 468
- (29)
- (30) Côté, P., Piatek, S., Ferrarese, L., et al. 2006, ApJS, 165, 57
- (31)
- (32) Davidge, T. J. 1992, AJ, 103, 1512
- (33)
- (34) Davidge, T. J. 2016, ApJ, 818, 142
- (35)
- (36) Davidge, T. J. 2018, ApJ, 856, 129
- (37)
- (38) Davidge, T. J., Andersen, D. R., Lardiere, O., Bradley, C., Blain, C., Oya, S., Akiyama, M., & Ono, Y. H. 2015, ApJ, 811, 133
- (39)
- (40) Dullo, B. T., Martinez-Lombilla, C., & Knapen, J. H. 2016, MNRAS, 462, 3800
- (41)
- (42) Fraser-McKelvie, A., Brown, M. J. I., Pimbblet, K. A., Dolley, T., Crossett, J. P., & Bonne, N. J. 2016, 462, L11
- (43)
- (44) Grootes, M. W., Tuffs, R. J., Popescu, C. C., et al. 2017, AJ, 153, 111
- (45)
- (46) Hardy, T., Hanna, K., Szeto, K., & Burley, G. 2012, Proc. SPIEE, 8453, 84531Z
- (47)
- (48) Hook, I. M., Jorgensen, I., Allington-Smith, J. R., Davies, R. L., Metcalfe, N., Murowinski, R. G., & Crampton, D. 2004, PASP, 116, 425
- (49)
- (50) Jarrett, T. H., Chester, T., Cutri, R., Schneider, S. E., & Huchra, J. P. 2003, AJ, 125, 525
- (51)
- (52) Jedrzejewski, R. I. 1987, MNRAS, 226, 747
- (53)
- (54) Jones, L. A., & Worthey, G. 1995, ApJ, 446, L31
- (55)
- (56) Kewley, L. J., Dopita, M. A., Sutherland, R. S., Heisler, C. A., & Trevana, J. 2001, ApJ, 556, 121
- (57)
- (58) Kwak, S., Kim, W.-T., Rey, S.-C., & Kim, S. 2017, ApJ, 839, 24
- (59)
- (60) La Barbera, F., Vazdekis, A., Ferreras, I. et al. 2017, MNRAS, 464, 3597
- (61)
- (62) Leitherer, C., Schaerer, D., Goldader, J. D., et al. 1999, ApJS, 123, 3
- (63)
- (64) Lisker, T., Grebel, E. K., & Binggeli, B. 2006a, AJ, 132, 497
- (65)
- (66) Lisker, T., Glatt, K., Westera, P., & Grebel, E. K. 2006b, AJ, 132, 2432
- (67)
- (68) Lisker, T., Grebel, E. K., Binggeli, B., & Glatt, K. 2007, ApJ, 660, 1186
- (69)
- (70) Lisker, T., Grebel, E. K., & Binggeli, B. 2008, AJ, 135, 380
- (71)
- (72) Maraston, C. 2005, MNRAS, 362, 799
- (73)
- (74) McDonald, M., Courteau, S., Tully, R. B., & Roediger, J. 2011, MNRAS, 414, 2015
- (75)
- (76) McQuinn, K. B. W., Skillman, E. D., Cannon, J. M., et al. 2010, ApJ, 724, 49
- (77)
- (78) Mei, S., Blakeslee, J. P., Côté, P. et al. 2007, ApJ, 655, 144
- (79)
- (80) Miner, J., Rose, J. A., & Cecil, G. 2011, ApJ, 727, L15
- (81)
- (82) Morelli, L., Parmiggiani, M., Corsini, E. M., Costantin, L., Dalla Bont‘a, E., M’endez-Abreu, J., & Pizzella, A. 2016, MNRAS, 463, 4396
- (83)
- (84) Mouhcine, M., Lancon, A., Leitherer, C., Silva, D., & Groenewegen, M. A. T. 2002, A&A, 393, 101
- (85)
- (86) Percival, S. M., Salaris, M., Cassisi, S., & Pietrinferni, A. 2009, ApJ, 690, 427
- (87)
- (88) Pietrinferni, A., Cassisi, S., Salaris, M., & Castelli, F. 2004, ApJ, 612, 168
- (89)
- (90) Poznanski, D., Prochaska, J. X., & Bloom, J. S. 2012, MNRAS, 426, 1465
- (91)
- (92) Puzia, T. H., Miller, B. W., Trancho, G., Basarab, B., Mirocha, J. T., & Butler, K. 2013, AJ, 145, 164
- (93)
- (94) Reimers, D. 1975, Mem. Soc. R. Sci. Liege, 8, 369
- (95)
- (96) Roediger, J., Courteau, S., McDonald, M., & MacArthur, L. A. 2011, MNRAS, 416, 1983
- (97)
- (98) Soto, K. T., & Martin, C. L. 2010, ApJ, 716, 332
- (99)
- (100) Steinhauser, D., Schindler, S., & Springel, V. 2016, A&A, 591, A51
- (101)
- (102) Thomas, D., Maraston, C., Bender, R. 2003a, MNRAS, 343, 279
- (103)
- (104) Thomas, D., Maraston, C., Bender, R. 2003b, MNRAS, 339, 897
- (105)
- (106) Toloba, E., Boselli, A., Cenarro, A. J., Peletier, R. F., Gorgas, J., Gil de Paz, A., & Munoz-Mateos, J. C. 2011, A&A, 526, A114
- (107)
- (108) Toloba, E., Boselli, A., Peletier, R. F., Falcon-Barroso, J., van de Ven, G., & Gorgas, J. 2012, A&A, 548, A78
- (109)
- (110) Toloba, E., Guhathakurta, P., Boselli, A., et al. 2015, ApJ, 799, 172
- (111)
- (112) Vazdekis, A., Cenarro, A. J., Gorgas, J., Cardiel, N., & Peletier, R. F. 2003, MNRAS, 340, 1317
- (113)
- (114) Vazdekis, A., Koleva, M., Ricciardelli, E., Rock, B., & Falcon-Barroso, J. 2016, MNRAS, 463, 3409
- (115)
- (116) Worthey, G. 1994, ApJS, 95, 107
- (117)
- (118) Worthey, G., Faber, S. M., Gonzalez, J. J., & Burstein, D. 1994, ApJS, 94, 687
- (119)
- (120) Worthey, G., & Ottaviani, D. L. 1997, ApJS, 111, 377
- (121)
- (122) Wright, E. L., Eisenhardt, P. R. M., Mainzer, A. K., et al. 2010, AJ, 140, 1868
- (123)
- (124) Xiao, M-Y, Gu, Q-S, Chen, Y-M, & Zhou, L. 2016, ApJ, 831, 63
- (125)