reception date \Acceptedacception date \Publishedpublication date
quasars: general – galaxies: high-redshift – galaxies: ISM – galaxies: active
Detections of [Oiii] \micron in Two Quasars in the Reionization Epoch
Abstract
With the Atacama Large Millimeter/sub-millimeter Array (ALMA), we report detections of the far-infrared (FIR) [Oiii] 88 \micron line and the underlying dust continuum in the two quasars in the reionization epoch, J205406.48-000514.8 (hereafter J2054-0005) at and J231038.88+185519.7 (hereafter J2310+1855) at . The [Oiii] luminosity of J2054-0005 and J2310+1855 are and , corresponding to 0.05% and 0.01% of the total infrared luminosity, , respectively. Combining these [Oiii] luminosities with [Cii] 158 \micron luminosities in the literature, we find that J2054-0005 and J2310+1855 have the [Oiii]-to-[Cii] luminosity ratio of and , respectively, the latter of which is the lowest among objects so far reported at . Combining [Oiii] observations at from our study and the literature, we identify the [Oiii] line deficit: objects with larger have lower -to- ratios. Furthermore, we also find that the anti-correlation is shifted toward higher value when compared to the local [Oiii] line deficit.
1 Introduction
Quasars are powered by supermassive black holes (SMBHs) with (e.g., De Rosa et al. 2014; Wu et al. 2015). Owing to wide-area surveys, quasars are discovered at (e.g., Fan et al. 2003; Jiang et al. 2016; Mazzucchelli et al. 2017; Matsuoka et al. 2018) and up to (Bañados et al. 2018). How SMBHs have accreted within Gyr after the Big Bang is one of the most important question in modern astronomy (Valiante et al. 2017).
In the local Universe, there is a tight correlation between the central black hole mass and the bulge mass (Häring & Rix 2004; Kormendy & Ho 2013). Given the coevolution of the SMBHs and their host galaxies, understanding the host galaxy properties at the earliest Universe is crucial. Rest-frame far-infrared (FIR) dust continuum observations show that high- quasar host galaxies have star formation rates (SFRs) yr-1 and large dust masses (e.g., Wang et al. 2008; Venemans et al. 2018). The carbon monoxide (CO) line observations reveal a large amount of gas mass in the host galaxies ( ) (e.g., Wang et al. 2010; Venemans et al. 2017b; Feruglio et al. 2018). The FIR fine structure line of [Cii] 158 \micron is widely used to obtain the precise redshift and the dynamical mass (e.g., Maiolino et al. 2005; Wang et al. 2013; Venemans et al. 2017a; Decarli et al. 2018; Izumi et al. 2018).
Combinations of multiple FIR fine structure lines are useful to obtain physical properties of the interstellar medium (ISM) such as the gas-phase metallicity, the electron density, and the ionization parameter (e.g., Nagao et al. 2011; Pereira-Santaella et al. 2017). Among the FIR lines, the [Oiii] 88.356 \micron line ( 3393.006244 GHz) would be a good next target after [Cii] because it is the second most commonly observed line in normal star-forming galaxies at (e.g., Inoue et al. 2016; Tamura et al. 2019). Indeed, recent ALMA observations demonstrate that [Oiii] is detectable even at (Hashimoto et al. 2018).
In this paper, we report results of our ALMA Band 8 observations targeting [Oiii] in two quasars at , J205406.48-000514.8 (hereafter J2054-0005) and J231038.88+185519.7 (J2310+1855). With our observations (§2), we successfully detect [Oiii] and the underlying dust continuum (§3). In conjunction with [Cii] measurements in the literature, we discuss their [OIII]-to-[CII] line luminosity ratios (§4). Throughout this paper, we adopt a flat CDM cosmology (, , and km s-1 Mpc-1; Komatsu et al. 2011). The solar luminosity, , is erg s-1, and represents the Boltzmann constant.
2 Our Sample and ALMA Band 8 Data
2.1 Sample
At the time of writing our proposal, April 2017, there were 13 quasars with [Cii] detections at 111J1148+5251 (Maiolino et al. 2005, 2012), J112+0641 (Venemans et al. 2012), J2348-3054, J0109-3047, J0305-3150 (Venemans et al. 2016), J2310+1855, J1319+0950, J2054-0005 (Wang et al. 2013), J0100+2802 (Wang et al. 2016), P036+03 (Bañados et al. 2015), J0210-0456 (Willott et al. 2013), J0055+0146, and J2229+1457 (Willott et al. 2015).. We excluded an object with declination too high for ALMA observations. We then omitted four objects with redshifts at which [Oiii] emission is strongly affected by atmospheric absorption222J1148+5251 is excluded from the candidates because of its high declination for ALMA observations. Four objects, J0305-3150, J1319+0950, P036+03, and J2229+1457 are additionally omitted because their [Oiii] frequencies are strongly affected by atmospheric absorption.. To secure the [Oiii] line detection within reasonable ALMA integration times, we selected objects with (i) bright total infrared luminosities, , and (ii) relatively lower- among the candidates. Finally, these leave us with two objects, J2054-0005 and J2310+1855, which have very bright total infrared luminosities, log(/) , at . In fact, J2310+1855 has the brightest infrared, [Cii] and CO(6-5) luminosities at (Decarli et al. 2018; Venemans et al. 2018; Feruglio et al. 2018).
These objects are originally discovered by the Sloan Digital Sky Survey data (Jiang et al. 2008, 2016). J2054-0005 (J2310+1855) has the UV absolute magnitude of () and the bolometric luminosity of ( ) (Wang et al. 2013). The BH mass in J2054-0005 (J2310+1855) is estimated to be ( ) under the assumption of the Eddington-limited mass accretion (Wang et al. 2013; Willott et al. 2015). The [Cii] redshift value of J2054-0005 (J2310+1855) is () (Wang et al. 2013).
2.2 Observations and Data
We performed observations of [Oiii] with ALMA Band 8 during 2018 March and 2018 July (ID 2017.1.01195.S, PI: T. Hashimoto). In J2054-0005 (J2310+1855), 43 antennas with the baseline lengths of m ( m) were used, and the total on-source exposure time was 127 minutes (176 minutes). Four spectral windows (SPWs) with a bandwidth of 1.875 GHz were used in the Frequency Division Mode. Two slightly overlapping SPWs (0 & 1) were used to target [Oiii], covering the frequency range of GHz ( GHz) for J2054-0005 (J2310+1855). The other two SPWs (2 & 3) were used to observe the continuum, covering GHz ( GHz) for J2054-0005 (J2310+1855). A quasar J1924-2914 (J2258-2758) was used for bandpass and flux calibrations, and a quasar J2101+0341 (J2253+1608) was used for phase calibrations.The data were reduced and calibrated using CASA pipeline version 5.1.1-5. We produced images and cubes with the CLEAN task using the natural weighting. To create a pure dust continuum image, we collapsed all off-line channels. To create a pure line image, we subtracted continuum using the off-line channels in the line cube with the CASA task uvcontsub. In J2310+1855, we could not obtain the data product in SPW1 due to very strong atmospheric absorption333According to the QA2 Report, ALMA staffs tried to keep a part of the data by changing parameters of the pipeline, but it did not work..
With the CASA task imstat,we estimate the rms level of the continuum image of J2054-0005 (J2310+1855) to be 67 Jy beam-1 (106 Jy beam-1). The spatial resolution of the continuum image is () in FWHM with a beam position angle, PA, of 69∘ (). The typical rms level of the line cube is mJy beam-1 (0.8 mJy beam-1) per 30 km s-1 bin.
3 Results
Summary of observational results. J2054-0005 J2310+1855 FWHM([Oiii]) [km s-1] [Oiii] integrated flux [Jy km s-1] [Oiii] luminosity [ ] [mJy] 10.35 0.15 24.89 0.21 Dust deconvolved sizea [arcsec2] (0.23 0.01) (0.15 0.02) (0.31 0.01) (0.22 0.02) [Oiii] deconvolved sizea [arcsec2] ALMA dust position (ICRS) ALMA [Oiii] position (ICRS) SDSS optical positionb (ICRS) [K] c [ ] SFRIRd [ yr-1] \tabnoteNote. a The values represent major and minor-axis FWHM values of a 2D Gaussian profile. b The SDSS optical position recalibrated with the GAIA’s astrometry (see §3.3). c The total luminosity, , is estimated by integrating the modified-black body radiation at \micron. d The SFR value is obtained following Kennicutt & Evans (2012) under the assumption of the Kroupa initial mass function (IMF; Kroupa 2001) in the range of . The value should be treated as the upper limit on the obscured SFR (see §3.4).
3.1 Dust Continuum
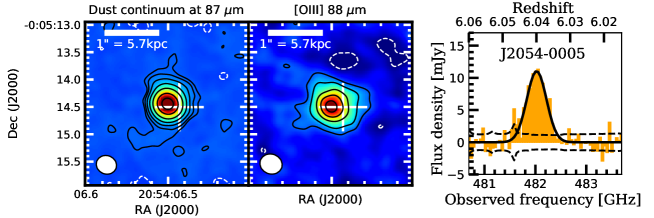
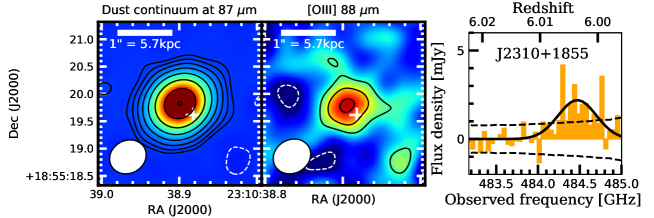
Our data probe dust continuum emission at the rest-frame wavelength, , of \micron. The top left and bottom left panels of Figure 1 show dust continuum images of J2054-0005 and J2310+1855, respectively. Our measurements are summarized in Table 3.
J2054-0005– To estimate the flux density and the beam deconvolved size of the dust continuum, we apply the CASA task imfit assuming a 2D Gaussian profile for the specific intensity. We estimate the continuum flux density to be 10.35 0.15 mJy. The beam deconvolved size is (0.23 0.01) (0.15 0.02) arcsec2, corresponding to (1.34 0.06) (0.88 0.13) kpc2 at , with PA 177∘ 7∘.
J2310+1855– The continuum flux density is 24.89 0.21 mJy. The beam deconvolved size is (0.31 0.01) (0.22 0.02) arcsec2, corresponding to (1.81 0.06) (1.28 0.13) kpc2 at , with PA 154∘ 8∘.
These deconvolved size and PA values are consistent with those obtained by Wang et al. (2013) using ALMA Band 6 data within uncertainties444Wang et al. (2013) have used the CASA task imfit to obtain the beam-deconvolved sizes of [Cii] and dust continuum emitting regions in the same manner as used in this study..
3.2 [Oiii] 88 \micron
The [Oiii] is detected in the two quasars. Our measurements are summarized in Table 3. The top (bottom) middle panel of Figure 1 shows a velocity-integrated intensity image between GHz ( GHz) for J2054-0005 (J2310+1855). The peak intensity is Jy km s-1 beam-1 ( Jy km s-1 beam-1). We perform photometry on the image with the CASA task imfit assuming a 2D Gaussian profile for the line intensity.
In J2054-0005, the total line flux is estimated to be Jy km s-1. The beam-deconvolved size is arcsec2, corresponding to kpc2 at , with PA . Likewise, in J2310+1855, the total line flux is estimated to be Jy km s-1. The beam-deconvolved size is arcsec2, corresponding to kpc2 at , with PA . We note that the two quasars have the [Oiii] emitting region size of kpc (FWHM), which is significantly larger than the continuum emitting region size of kpc (FWHM).
The top (bottom) right panel of Figure 1 shows the continuum-subtracted spectrum of J2054-0005 (J2310+1855) extracted from the [Oiii] region with detections in the velocity-integrated intensity image. We obtain the [Oiii] redshift of () and the FWHM value of km s-1 ( km s-1). Based on a combination of the flux and redshift values, we obtain the [Oiii] luminosities of (6.79 0.61) and (2.44 0.61) in J2054-0005 and J2310+1855, respectively.
To investigate a possible broad velocity component in the [Oiii] line, as that found in a quasar in [Cii] (Maiolino et al. 2012), we extract two additional spectra from the [Oiii] regions with and detections in the velocity-integrated intensity images. We do not find any broad velocity component in the spectra.
We compare our [Oiii] measurements with [Cii] measurements presented in Wang et al. (2013). In J2054-0005, the [Oiii] emitting region size, arcsec2, is consistent with the [Cii] emitting region, arcsec2, within uncertainties. Likewise, the [Oiii] line FWHM, km s-1, is consistent with that of [Cii], km s-1, within uncertainties. In J2310+1855, [Oiii] emitting region size, arcsec2, is consistent with that of [Cii], arcsec2, within uncertainties. Likewise, the [Oiii] line FWHM value, km s-1, is consistent with that of [Cii], km s-1, within uncertainties. The case of J2054-0005 might reveal that the size of the [Oiii] emitting region and the line FWHM are larger than those of [Cii]. If this is the case, [Oiii] and [Cii] lines may trace different regions of the quasar. However, because these differences are only marginal (), we do not attempt to discuss this further.
3.3 Astrometry
In J2054-0005 (J2310+1855), we find that the spatial positions of dust continuum and [Oiii] are consistent within 48 (72) mas uncertainties. Hereafter, we use the dust continuum positions due to their high significance detections. Based on the IRAF task imexam, J2054-0005 has , and J2310+1855 has in the International Celestial Reference System (ICRS), on which ALMA relies (Table 3).
We also compare positions of the ALMA and the SDSS optical images (c.f., Shao et al. 2019; Wang et al. 2019). To do so, we first recalibrate astrometry of the SDSS -band image (Eisenstein et al. 2011) where the quasars are detected. Using nearby bright stars whose positions are accurately measured in the GAIA second data release (DR2) catalog in the ICRS frame (Gaia Collaboration et al. 2016, 2018), we have performed IRAF tasks ccmap and ccsetwcs to recalibrate the astrometry of the SDSS image. The astrometry uncertainty (i.e., systemic uncertainty) is estimated to be and mas around J2054-0005 and J2310+1855, respectively, based on comparisons of bright star positions in the GAIA catalog and the SDSS image with recalibrated astrometry. In addition, we estimate the positional uncertainty arising from the IRAF task imexam (i.e., measurement uncertainty) to be 350 (40) mas in J2054-0005 (J2310+1855)555We have performed the IRAF task imfit with five cursor positions, the peak flux pixel and the four adjacent pixels, to obtain the position. We then adopt the standard deviation of the results as the 1 uncertainty due to the fitting.. The relatively large uncertainty in J2054-0005 is due to the low signal-to-noise ratio in the -band image. We regard 470 and 140 mas as the final positional uncertainty for J2054-0005 and J2310+1855, respectively.
In the left panels of Figure 1, white crosses indicate the optical positions in the SDSS -band image with recalibrated astrometry. The optical position of J2054-0005 is , mas offset from the ALMA’s position. Likewise, the optical position of J2310+1855 is , mas offset from the ALMA’s position. Given the positional uncertainties, we do not conclude that there is a significant () offset between the two images (c.f., Shao et al. 2019; Wang et al. 2019). ALMA higher-angular resolution data and deeper and higher-angular resolution optical images would be useful to further investigate if there is a possible spatial offset between the two images.
3.4 Tight Constraints on the Dust Temperature and the Infrared Luminosity
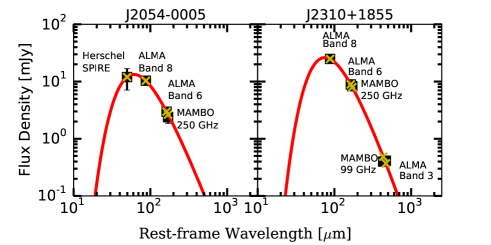
Previous studies often assume that FIR dust continuum emission of quasars at \micron is mainly powered by star-formation activity with negligible contribution from active galactic nuclei (AGNs) (e.g., Leipski et al. 2013). Assuming that FIR dust continuum emission is described as an optically-thin modified-black body radiation, /(exp() ), we constrain the single dust temperature, , and the dust emissivity index, , of the two quasar host galaxies taking CMB effects into account (da Cunha et al. 2013) (Table 3).
In J2054-0005, we use four flux density measurements of mJy, 10.35 0.15 mJy, mJy, and mJy obtained with Herschel 350 \micron data (Leipski et al. 2013), our ALMA 488 GHz, ALMA 262 GHz data (Wang et al. 2013), and MAMBO 250 GHz data (Wang et al. 2008), respectively. These data sample \micron. By fitting modified-black body models corrected for the CMB effects to the photometry data, we obtain K and based on the statistics. The best-fit model is shown in the left panel of Figure 2. Integrating the modified-black body radiation over m, we obtain the total infrared luminosity to be . Following Kennicutt & Evans (2012) under the assumption of the Kroupa initial mass function (IMF; Kroupa 2001) in the range of , we obtain the IR-based star formation rate (SFRIR) 1900 yr-1. Note our ALMA Band 8 data are useful to constrain because the data probe the wavelengths close to the peak of the dust spectral energy distribution (SED).
Likewise, in J2310+1855, we use five flux density measurements of 24.89 0.21 mJy, mJy, mJy, , and mJy obtained with our ALMA 488 GHz, ALMA 262 GHz data (Wang et al. 2013), MAMBO 250 GHz data, MAMBO 99 GHz data (Wang et al. 2008), and ALMA 91.5 GHz (Feruglio et al. 2018), respectively. These data sample \micron. We obtain K, , , and SFR yr-1 in the same way as in J2054-0005. We use these and SFRIR values to interpret our results in §4.
These and values are within the ranges obtained in a mean SED of six quasar host galaxies at , K and (Beelen et al. 2006) and in a mean SED of seven quasar host galaxies at , K and (Priddey & McMahon 2001). Nevertheless, our results demonstrate the variety of dust properties on the individual basis.
In the discussion above, we have assumed that the dust continuum emission is purely powered by star formation activity. However, recent studies have decomposed the FIR SED of local AGNs and quasars into components heated by star formation and AGN activity (e.g., Symeonidis et al. 2016; Ichikawa et al. 2019); these studies show that powerful AGN activity can actually dominate the dust continuum emission up to \micron or longer wavelengths (see also Symeonidis 2017; Schneider et al. 2015). Because the two quasars studied here are very luminous, a significant fraction of could be powered by AGN activity666Recently, Shao et al. (2019) have performed detailed multi-wavelength SED analyses in J2310+1855. Figure 4 in the study shows that star formation activity may be a dominant source for the FIR dust continuum emission in J2310+1855.. In particular, J2054-0005 has a very compact dust continuum emitting region (FWHM kpc), implying that its high could be largely due to heating by the quasar. Therefore, our values should be treated with upper limits on the dust-obscured SFRs.
3.5 Luminosity Ratios
3.5.1 [Oiii]-Line Deficit and its Redshift Evolution
These are obtained in Hashimoto et al. (2019) as the summation of the UV luminosity and , where we assume 50 K and except for SPT031158 E/W. For the two LAEs with upper limits, the lower limit corresponds to the UV luminosity, while the upper limit denotes the summation of the UV luminosity and the upper limits.
It is widely known that the FIR line luminosity-to- ratio anti-correlates with , the so-called FIR line deficit, particularly at the high regime ( ) (e.g., Malhotra et al. 1997; Stacey et al. 2010; Graciá-Carpio et al. 2011; Díaz-Santos et al. 2013, 2017; Herrera-Camus et al. 2018a, b). The line deficit has been first identified in [Cii]. A number of hypotheses are proposed to explain the [Cii] line deficit in extreme objects such as (ultra-)luminous infrared galaxies, (U)LIRGs, and luminous quasars, although a consensus is yet to be reached (e.g., Kaufman et al. 1999; Malhotra et al. 2001; Luhman et al. 2003; Abel et al. 2009; Graciá-Carpio et al. 2011; Langer & Pineda 2015; Muñoz & Oh 2016; Díaz-Santos et al. 2017; Lagache et al. 2018; Herrera-Camus et al. 2018a; Rybak et al. 2019).
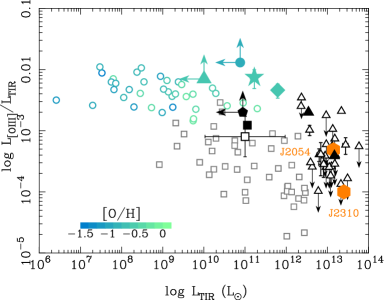
Focusing on [Oiii], based on a compiled sample of local dwarf and spiral galaxies with high dynamic ranges in metallicity and , Cormier et al. (2015) have shown that the -to- ratio anti-correlates with (see also e.g., Malhotra et al. 1997; Graciá-Carpio et al. 2011; Díaz-Santos et al. 2017; Herrera-Camus et al. 2018a, b). The local galaxies have the -to- ratio ranging from to . Recently, Tamura et al. (2019) have investigated the relation at higher- based on a compiled sample of galaxies, showing that at least high- galaxies with dust continuum detections follow a similar relation as in the local Universe. Our two quasars are useful to further investigate the trend at the reionization epoch because of their high values. The luminosity ratios are log (/) and in J2054-0005 and J2310+1855, respectively.
In the left panel of Figure 3, we plot the two quasars along with eight objects at (see caption for the details) and lower- objects. The latter includes various populations of local galaxies taken from the Herschel DGS (Cormier et al. 2015) and SHINING (Herrera-Camus et al. 2018a) samples, local spirals (Brauher et al. 2008), and lensed sub-millimeter galaxies (SMGs) at (Zhang et al. 2018). We confirm a trend that high- objects follow a similar relation as in the local Universe. Following explanations for the [Cii] line deficit, we propose two possible explanations for the [Oiii] line deficit.Firstly, the collisional de-excitation of [Oiii] may significantly reduce (and hence the luminosity ratio) in the high electron density environment ( cm-3). Secondly, the strong AGN radiation can contribute to (e.g., Symeonidis et al. 2016) while ionize oxygen higher than O2+ (e.g., Spinoglio et al. 2015). Detailed modeling is needed to conclude the origin of the [Oiii]-line deficit, which we leave for future studies.
In the left panel of Figure 3, we find that the relation between -to- and at high- is shifted toward higher values (or higher -to- values). Such a shift toward higher values is also found in the relation between -to- and (e.g., Stacey et al. 2010). In the case of [Cii], to understand the origin of this shift in high- galaxies, Narayanan & Krumholz (2017) have coupled analytical models for the structure of giant molecular clouds in galaxies with chemical equilibrium networks and radiative transfer models. The authors have proposed that the shift could arise if high- galaxies have larger gas masses at a given SFR (i.e, ). In this case, the gas surface density of an individual molecular cloud (i.e. the star formation efficiency, SFE , defined as the SFR per molecular gas mass) becomes lower, which in turn reduces the ability for self-shielding of molecular clouds against ionizing photons, leading to a brighter [Cii] luminosity. Although it is not clear whether the same discussion is applicable for [Oiii], there is growing evidence that the molecular gas properties are the key to regulate the general trend in the FIR line deficit; Herrera-Camus et al. (2018a) shows that the discrepancy between low- and high- objects becomes less prominent if one plots the -to- ratio against the IR surface brightness () , the latter of which is related to the gas surface density or the SFE. Such an analysis for [Oiii] would be interesting in future with larger samples in local and high- Universe.
3.5.2 [Oiii]-to-[Cii] Luminosity Ratio
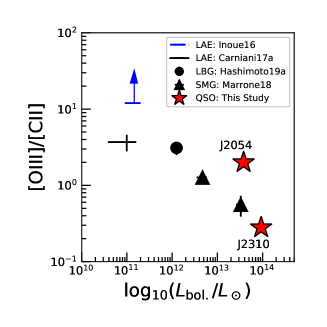
We next turn our attention to the [Oiii]-to-[Cii] luminosity ratio. Based on a compiled sample of five galaxies at with [Oiii] and [Cii] observations (Inoue et al. 2016; Carniani et al. 2017; Marrone et al. 2018), Hashimoto et al. (2019) have demonstrated a trend that the [Oiii]-to-[Cii] line luminosity ratio becomes small if a galaxy has a large galaxy bolometric luminosity. Their sample includes two Ly emitters (LAEs), one Lyman break galaxy (LBG), and two SMGs. J2054-0005 and J2310+1855 offers us an invaluable opportunity to investigate the line luminosity ratio in quasars at for the first time.
In J2054-0005 (J2310+1855), combining our [Oiii] luminosity and the [Cii] luminosity of ( ) in Wang et al. (2013), we obtain the line luminosity ratio of (). In the right panel of Figure 3, red star symbols show the line luminosity ratio of the two quasars plotted against the quasar/AGN bolometric luminosity. Just for comparisons, black and blue symbols show the line luminosity ratios in star forming galaxies without AGN activity at plotted against the galaxy bolometric luminosity. Notably, J2310+1855 has the lowest [Oiii]-to-[Cii] ratio so far reported among objects at .
4 Discussion and Summary
To interpret [Oiii] in quasars, we need to separate the [Oiii] contribution from star formation and AGN activity. For the latter, [Oiii] can arise from the Narrow Line Region (NLR) of AGNs because the NLR has a relatively small electron density of cm-3 (e.g., Bennert et al. 2006; Kakkad et al. 2018), which is smaller than the critical density of [Oiii] 88 \micron ( cm-3). Indeed, the size of the [Oiii] emitting region of the two quasars ( kpc in FWHM) are reasonable for the size of stellar disks or extended NLRs. Ideally, one can separate the contribution based on spatially resolved diagnostics such as the BPT diagram (Baldwin et al. 1981) as performed in local Seyfert and LINER galaxies (Kakkad et al. 2018). However, it is difficult to separate the contribution based on the [Oiii]-to-[Cii] line ratio alone because it is insensitive to the presence of AGNs; Herrera-Camus et al. (2018a) demonstrate that both star formation and AGN activity can reproduce the [Oiii]-to-[Cii] luminosity ratio of (see their Figure 11).
We thus focus on the fact that [Oiii] and [Cii] have consistent redshifts, emitting region sizes, and line FWHMs within uncertainties (§3.2). These results would imply that [Oiii] arises from star-forming regions as traced by [Cii] (see similar argument by Walter et al. 2018), although we cannot rule out the possibility that both [Oiii] and [Cii] are partly affected by the NLRs.
We next examine if [Oiii] luminosity-based SFRs (SFROIII) are comparable to SFRIR values (Table 3). It is expected that the two SFR values are consistent with each other if [Oiii] is mainly powered by star-forming acticity. For the conversion of the [Oiii] luminosity to the SFR, we use the empirical relation in the local Universe which assumes the Kroupa IMF in the range of (De Looze et al. 2014). The authors present different empirical relations for e.g., metal-poor dwarf galaxies, starburst, the composite of star formation and AGNs, ULIRGs, and the entire sample. Because the two quasars presented in this study have , the empirical relation for ULIRGs would be suitable among the relations in De Looze et al. (2014). Although the typical uncertainty of the relation is a factor of 2.5 (see Table 3 in De Looze et al. 2014), it is unclear whether the local relation can be applied for luminous quasars at presented in this study. Therefore, the actual uncertainty would be larger than a factor of 2.5. On the other hand, as discussed in §3.4, the SFR values estimated from are also highly uncertain because it is possible that AGN significantly contaminates the FIR dust continuum emission (e.g., Symeonidis et al. 2016). With these in mind, we find that SFROIII in J2054-0005 is about five times larger than SFRIR, whereas the two SFR values in J2310+1855 are consistent within a factor of two. Given the large systematic uncertainties in the two SFR values, there is no strong evidence that supports the AGN contamination to [Oiii] in the two objects in this study777Walter et al. (2018) have also compared the two SFR values to examine the origin of [Oiii]. Using the empirical relation for high- () galaxies, the authors argue that the two SFRs are in good agreement. However, the [Oiii] empirical relation for high- galaxies is constructed only with three objects (see Table 3 in De Looze et al. 2014). Thus, their comparison is also subject to the uncertainties as described in this study..
A possible way to disentangle the [Oiii] contributions from star formation and AGN activity is to investigate a spatially resolved map of [Oi] 63 \micron-to-[Cii] line ratio defining the AGN-dominated region. This is because [Oi] is significantly enhanced in the presence of AGNs due to the fact that [Oi] becomes a more efficient coolant than [Cii] in dense and warmer gas (Herrera-Camus et al. 2018a). Combining this map with high-angular resolution [Oiii] data, future works can infer the [Oiii] flux fraction of each component.
Although the origin of [Oiii] emission is not clear given the current data, we try to interpret the [Oiii]-to-[Cii] line luminosity ratio of the two quasars. In the local Universe, based on a compiled sample of star-forming galaxies and AGN-dominated galaxies, Herrera-Camus et al. (2018a) have statistically demonstrated that [Oiii] becomes stronger than [Cii] if galaxies have higher dust temperature (see also Díaz-Santos et al. 2017). The two quasars seem to be consistent with the trend in the sense that J2054-0005 (J2310+1855) has high (low) dust temperature, K ( K). An interpretation of the result is that J2054-0005 has a harder UV stellar + AGN radiation field than J2310+1855888In the case of J2054-0005, AGN activity may significantly contribute to the radiation field because the object has very compact dust emitting region.. Assuming the same dust covering fraction and the dust grain size distribution, a harder UV radiation field leads to higher . The harder UV radiation field also naturally enhances [Oiii] (ionization potential 35 eV) against [Cii] (ionization potential 11 eV) if we assume a constant C/O abundance ratio. This hypothesis can be tested with the line luminosity ratio of [Nii] 205 \micron against [Oiii], which is a good tracer of the UV radiation hardness (Ferkinhoff et al. 2010). Alternatively, the weak [Oiii] in J2310+1855 may be due to its high electron density that causes collisional de-excitation. This can be investigated with the line ratio of [Oiii] 88 \micron-to-[Oiii] 52 \micron, which is sensitive to the electron density because of their different critical densities (Pereira-Santaella et al. 2017). Our results highlight the potential use of [Oiii] (and the underlying continuum) as a useful tracer of the ISM in the quasar host galaxies.
Acknowledgments
We thank an anonymous referee for valuable comments that have greatly improved the paper. We are grateful to Toru Nagao, Nobunari Kashikawa, Yoshiki Matsuoka, Kohei Ichikawa, and Takuma Izumi for discussion. This paper makes use of the following ALMA data: ADS/JAO.ALMA#2017.1.01195.S. ALMA is a partnership of ESO (representing its member states), NSF (USA) and NINS (Japan), together with NRC (Canada), NSC and ASIAA (Taiwan), and KASI (Republic of Korea), in cooperation with the Republic of Chile. The Joint ALMA Observatory is operated by ESO, AUI/NRAO and NAOJ.
Funding for SDSS-III has been provided by the Alfred P. Sloan Foundation, the Participating Institutions, the National Science Foundation, and the U.S. Department of Energy Office of Science. The SDSS-III web site is http://www.sdss3.org/. SDSS-III is managed by the Astrophysical Research Consortium for the Participating Institutions of the SDSS-III Collaboration including the University of Arizona, the Brazilian Participation Group, Brookhaven National Laboratory, Carnegie Mellon University, University of Florida, the French Participation Group, the German Participation Group, Harvard University, the Instituto de Astrofisica de Canarias, the Michigan State/Notre Dame/JINA Participation Group, Johns Hopkins University, Lawrence Berkeley National Laboratory, Max Planck Institute for Astrophysics, Max Planck Institute for Extraterrestrial Physics, New Mexico State University, New York University, Ohio State University, Pennsylvania State University, University of Portsmouth, Princeton University, the Spanish Participation Group, University of Tokyo, University of Utah, Vanderbilt University, University of Virginia, University of Washington, and Yale University.
This work has made use of data from the European Space Agency (ESA) mission Gaia (https://www.cosmos.esa.int/gaia), processed by the Gaia Data Processing and Analysis Consortium (DPAC, https://www.cosmos.esa.int/web/gaia/dpac/consortium). Funding for the DPAC has been provided by national institutions, in particular the institutions participating in the Gaia Multilateral Agreement.
T.H. and A.K.I. appreciate support from NAOJ ALMA Scientific Research Grant Number 2016-01A. We are also grateful to KAKENHI grants 26287034 and 17H01114 (K.M. and A.K.I.), 17H06130 (Y.T.). This work was partly supported by the Grant-inAid for Scientific Research 19J01620 (T.H.).
We thank Rodrigo Herrera-Camus for kindly providing us with their SHINING sample data used in the left panel of Figure 3.
References
- Abel et al. (2009) Abel, N. P., Dudley, C., Fischer, J., Satyapal, S., & van Hoof, P. A. M. 2009, ApJ, 701, 1147
- Bañados et al. (2015) Bañados, E., Decarli, R., Walter, F., Venemans, B. P., Farina, E. P., & Fan, X. 2015, ApJ, 805, L8
- Bañados et al. (2018) Bañados, E., et al. 2018, Nature, 553, 473
- Baldwin et al. (1981) Baldwin, J. A., Phillips, M. M., & Terlevich, R. 1981, PASP, 93, 5
- Beelen et al. (2006) Beelen, A., Cox, P., Benford, D. J., Dowell, C. D., Kovács, A., Bertoldi, F., Omont, A., & Carilli, C. L. 2006, ApJ, 642, 694
- Bennert et al. (2006) Bennert, N., Jungwiert, B., Komossa, S., Haas, M., & Chini, R. 2006, A&A, 456, 953
- Brauher et al. (2008) Brauher, J. R., Dale, D. A., & Helou, G. 2008, ApJS, 178, 280
- Carniani et al. (2017) Carniani, S., et al. 2017, A&A, 605, A42
- Cormier et al. (2015) Cormier, D., et al. 2015, A&A, 578, A53
- da Cunha et al. (2013) da Cunha, E., et al. 2013, ApJ, 766, 13
- De Looze et al. (2014) De Looze, I., et al. 2014, A&A, 568, A62
- De Rosa et al. (2014) De Rosa, G., et al. 2014, ApJ, 790, 145
- Decarli et al. (2018) Decarli, R., et al. 2018, ApJ, 854, 97
- Díaz-Santos et al. (2013) Díaz-Santos, T., et al. 2013, ApJ, 774, 68
- Díaz-Santos et al. (2017) Díaz-Santos, T., et al. 2017, ApJ, 846, 32
- Eisenstein et al. (2011) Eisenstein, D. J., et al. 2011, AJ, 142, 72
- Fan et al. (2003) Fan, X., et al. 2003, AJ, 125, 1649
- Ferkinhoff et al. (2010) Ferkinhoff, C., Hailey-Dunsheath, S., Nikola, T., Parshley, S. C., Stacey, G. J., Benford, D. J., & Staguhn, J. G. 2010, ApJ, 714, L147
- Feruglio et al. (2018) Feruglio, C., et al. 2018, å, 619A, 39
- Gaia Collaboration et al. (2016) Gaia Collaboration et al. 2016, A&A, 595, A2
- Gaia Collaboration et al. (2018) Gaia Collaboration et al. 2018, A&A, 616, A1
- Graciá-Carpio et al. (2011) Graciá-Carpio, J., et al. 2011, ApJ, 728, L7
- Häring & Rix (2004) Häring, N., & Rix, H.-W. 2004, ApJ, 604, L89
- Hashimoto et al. (2019) Hashimoto, T., et al. 2019, PASJ in press (arXiv:1806.00486)
- Hashimoto et al. (2018) Hashimoto, T., et al. 2018, Nature, 557, 392
- Herrera-Camus et al. (2018a) Herrera-Camus, R., et al. 2018a, ApJ, 861, 94
- Herrera-Camus et al. (2018b) Herrera-Camus, R., et al. 2018b, ApJ, 861, 95
- Ichikawa et al. (2019) Ichikawa, K., et al. 2019, ApJ, 870, 31
- Inoue et al. (2016) Inoue, A. K., et al. 2016, Science, 352, 1559
- Izumi et al. (2018) Izumi, T., et al. 2018, PASJ, 70, 36
- Jiang et al. (2008) Jiang, L., et al. 2008, AJ, 135, 1057
- Jiang et al. (2016) Jiang, L., et al. 2016, ApJ, 833, 222
- Kakkad et al. (2018) Kakkad, D., et al. 2018, A&A, 618, A6
- Kaufman et al. (1999) Kaufman, M. J., Wolfire, M. G., Hollenbach, D. J., & Luhman, M. L. 1999, ApJ, 527, 795
- Kennicutt & Evans (2012) Kennicutt, R. C., & Evans, N. J. 2012, ARA&A, 50, 531
- Komatsu et al. (2011) Komatsu, E., et al. 2011, ApJS, 192, 18
- Kormendy & Ho (2013) Kormendy, J., & Ho, L. C. 2013, ARA&A, 51, 511
- Kroupa (2001) Kroupa, P. 2001, MNRAS, 322, 231
- Lagache et al. (2018) Lagache, G., Cousin, M., & Chatzikos, M. 2018, A&A, 609, A130
- Langer & Pineda (2015) Langer, W. D., & Pineda, J. L. 2015, A&A, 580, A5
- Laporte et al. (2017) Laporte, N., et al. 2017, ApJ, 837, L21
- Leipski et al. (2013) Leipski, C., et al. 2013, ApJ, 772, 103
- Luhman et al. (2003) Luhman, M. L., Satyapal, S., Fischer, J., Wolfire, M. G., Sturm, E., Dudley, C. C., Lutz, D., & Genzel, R. 2003, ApJ, 594, 758
- Maiolino et al. (2005) Maiolino, R., et al. 2005, A&A, 440, L51
- Maiolino et al. (2012) Maiolino, R., et al. 2012, MNRAS, 425, L66
- Malhotra et al. (1997) Malhotra, S., et al. 1997, ApJ, 491, L27
- Malhotra et al. (2001) Malhotra, S., et al. 2001, ApJ, 561, 766
- Marrone et al. (2018) Marrone, D. P., et al. 2018, Nature, 553, 51
- Matsuoka et al. (2018) Matsuoka, Y., et al. 2018, ApJS, 237, 5
- Mazzucchelli et al. (2017) Mazzucchelli, C., et al. 2017, ApJ, 849, 91
- Muñoz & Oh (2016) Muñoz, J. A., & Oh, S. P. 2016, MNRAS, 463, 2085
- Nagao et al. (2011) Nagao, T., Maiolino, R., Marconi, A., & Matsuhara, H. 2011, A&A, 526, A149
- Narayanan & Krumholz (2017) Narayanan, D., & Krumholz, M. R. 2017, MNRAS, 467, 50
- Pereira-Santaella et al. (2017) Pereira-Santaella, M., Rigopoulou, D., Farrah, D., Lebouteiller, V., & Li, J. 2017, MNRAS, 470, 1218
- Priddey & McMahon (2001) Priddey, R. S., & McMahon, R. G. 2001, MNRAS, 324, L17
- Rybak et al. (2019) Rybak, M., et al. 2019, ApJ, 876, 112
- Schneider et al. (2015) Schneider, R., Bianchi, S., Valiante, R., Risaliti, G., & Salvadori, S. 2015, A&A, 579, A60
- Shao et al. (2019) Shao, Y., et al. 2019, ApJ, 876, 99
- Spinoglio et al. (2015) Spinoglio, L., Pereira-Santaella, M., Dasyra, K. M., Calzoletti, L., Malkan, M. A., Tommasin, S., & Busquet, G. 2015, ApJ, 799, 21
- Stacey et al. (2010) Stacey, G. J., Hailey-Dunsheath, S., Ferkinhoff, C., Nikola, T., Parshley, S. C., Benford, D. J., Staguhn, J. G., & Fiolet, N. 2010, ApJ, 724, 957
- Symeonidis (2017) Symeonidis, M. 2017, MNRAS, 465, 1401
- Symeonidis et al. (2016) Symeonidis, M., Giblin, B. M., Page, M. J., Pearson, C., Bendo, G., Seymour, N., & Oliver, S. J. 2016, MNRAS, 459, 257
- Tamura et al. (2019) Tamura, Y., et al. 2019, ApJ, 874, 27
- Valiante et al. (2017) Valiante, R., Agarwal, B., Habouzit, M., & Pezzulli, E. 2017, PASA, 34, e031
- Venemans et al. (2016) Venemans, B. P., Walter, F., Zschaechner, L., Decarli, R., De Rosa, G., Findlay, J. R., McMahon, R. G., & Sutherland, W. J. 2016, ApJ, 816, 37
- Venemans et al. (2012) Venemans, B. P., et al. 2012, ApJ, 751, L25
- Venemans et al. (2017a) Venemans, B. P., et al. 2017a, ApJ, 851, L8
- Venemans et al. (2017b) Venemans, B. P., et al. 2017b, ApJ, 845, 154
- Venemans et al. (2018) Venemans, B. P., et al. 2018, ApJ, 866, 159
- Walter et al. (2018) Walter, F., et al. 2018, ApJ, 869, L22
- Wang et al. (2008) Wang, R., et al. 2008, ApJ, 687, 848
- Wang et al. (2010) Wang, R., et al. 2010, ApJ, 714, 699
- Wang et al. (2013) Wang, R., et al. 2013, ApJ, 773, 44
- Wang et al. (2016) Wang, R., et al. 2016, ApJ, 830, 53
- Wang et al. (2019) Wang, R., et al. 2019, (arXiv:1904.07749)
- Willott et al. (2015) Willott, C. J., Bergeron, J., & Omont, A. 2015, ApJ, 801, 123
- Willott et al. (2013) Willott, C. J., Omont, A., & Bergeron, J. 2013, ApJ, 770, 13
- Wu et al. (2015) Wu, X.-B., et al. 2015, Nature, 518, 512
- Zhang et al. (2018) Zhang, Z.-Y., et al. 2018, MNRAS, 481, 59