zfourge: Extreme 5007 Å emission may be a common early-lifetime phase for star-forming galaxies at
Abstract
Using the Prospector spectral energy distribution (SED) fitting code, we analyze the properties of 19 Extreme Emission Line Galaxies (EELGs) identified in the bluest composite SED in the zfourge survey at . Prospector includes a physical model for nebular emission and returns probability distributions for stellar mass, stellar metallicity, dust attenuation, and nonparametric star formation history (SFH). The EELGs show evidence for a starburst in the most recent 50 Myr, with the median EELG having a specific star formation rate (sSFR) of 4.6 Gyr-1 and forming 15% of its mass in this short time. For a sample of more typical star-forming galaxies (SFGs) at the same redshifts, the median SFG has a sSFR of 1.1 Gyr-1 and forms only of its mass in the last 50 Myr. We find that virtually all of our EELGs have rising SFHs, while most of our SFGs do not. From our analysis, we hypothesize that many, if not most, star-forming galaxies at undergo an extreme H+[Oiii] emission line phase early in their lifetimes. In a companion paper, we obtain spectroscopic confirmation of the EELGs as part of our MOSEL survey. In the future, explorations of uncertainties in modeling the UV slope for galaxies at are needed to better constrain their properties, e.g. stellar metallicities.
1 Introduction
Galaxies with strong ionizing emission at are thought to be responsible for driving reionization (e.g. Nakajima & Ouchi 2014). Such systems are expected to have extreme emission lines with equivalent widths (EWs) of hundreds to over Å (van der Wel et al., 2011; Maseda et al., 2013, 2014; Amorín et al., 2015; Forrest et al., 2017), stellar masses M⊙ (Maseda et al., 2014; Forrest et al., 2017), sub-solar metallicities (van der Wel et al., 2011; Amorín et al., 2015), and specific star formation rates (sSFRs) up to Gyr-1 (van der Wel et al., 2011; Maseda et al., 2014; Amorín et al., 2015; Forrest et al., 2017).
Extreme emission line galaxies (EELGs) are rare in the local universe (e.g. green peas, Cardamone et al. 2009; luminous compact galaxies, Izotov et al. 2011), but the number density of EELGs increases with increasing redshift (e.g. Ouchi et al. 2009; Labbé et al. 2013; Smit et al. 2014; Holden et al. 2016). Based on colors and EWs, Smit et al. (2015) found that as many as % of star-forming galaxies (SFGs) are EELGs at . As such, EELGs may be the progenitors of more typical SFGs at , when the global peak in star formation density in the Universe took place (e.g. Madau et al. 1998; Sobral et al. 2013).
Several studies show that EELGs have bursting (e.g. Atek et al. 2011; van der Wel et al. 2011; Maseda et al. 2013) or rising (e.g. Sanders et al. 2016) star formation rates (SFRs) with high sSFRs and young stellar ages (Forrest et al., 2017). However, studies have yet to fully explore the star formation histories. A better understanding of the SFHs provides more accurate estimates of galaxy properties (e.g. stellar mass, age, and metallicity) and insight into the duration of the extreme emission, i.e. the duty cycle. Additionally, modeling nebular emission accurately — especially when the emission comprises a significant fraction of the broadband photometric flux — remains a challenge.
Analyzing the SFHs and other properties of high-redshift EELGs requires photometry capable of detecting the faint continuum wavelengths outside of emission lines. The zfourge survey meets these requirements with deep multi-wavelength photometry, including as many as 40 measurements in the rest frame UV to near-IR for galaxies at (Straatman et al., 2016). Accurately modeling these EELGs also calls for state-of-the-art stellar population synthesis models, as well as Bayesian statistics to disentangle the effects of SFH and other galaxy parameters, such as metallicity. This type of analysis is now possible with the Prospector SED fitting code (Leja et al. 2017; hereafter L17).
In this paper, we investigate the properties of 19 H+[Oiii] candidate EELGs at selected in Forrest et al. (2018, accepted; hereafter F18) in composite spectral energy distributions (SEDs) in the zfourge survey. We create a model based on Prospector- (L17) to estimate the stellar masses, metallicities, dust attenuation, and SFHs for our EELG sample and for a sample of 167 more typical SFGs in the same redshift range. Ours is the first study to use Prospector at , and we are the first to compare SFHs for different galaxy populations using composite SEDs. We detail our galaxy populations and describe our use of Prospector in §2, display our results in §3, and summarize our conclusions in §4.
2 Methods
2.1 Data
Our data are from the FourStar Galaxy Evolution (zfourge) Survey, a deep, near-IR, medium-band survey (see Straatman et al. 2016 for more information) completed with the FourStar instrument on the Magellan telescope in the Chandra Deep Field South (CDFS; Giacconi et al. 2002), Cosmic Evolution Survey field (COSMOS; Scoville et al. 2007), and Ultra Deep Survey field (UDS; Lawrence et al. 2007). With extensive rest frame wavelength coverage for galaxies at , the survey yields exceptionally accurate photometric redshifts (; Nanayakkara et al. 2016).
Taking advantage of these accurate photometric redshifts and well-sampled SEDs, F18 uses EAZY to generate 22 rest-frame fluxes for each galaxy and subsequently groups them by similarities in the resultant colors. Groups of galaxies with similar SED shapes are then de-redshifted and scaled to create low resolution spectra, or composite SEDs, revealing galaxies with a wide array of SED shapes. Notably, strong emission features such as H and H+[Oiii] are measurable. In F18 this is done for galaxies from with SNRK.
In this work we focus on galaxies from two of these composite SEDs over . The composite SED with the largest H+[Oiii] EW ( Å) and steepest UV slope (; i.e. the bluest composite SED) measured in F18, containing 19 galaxies, is selected as our EELG sample. Four of these EELGs have spectroscopically-confirmed redshifts from the MOSEL survey (Tran et al. 2018, in prep.). In MOSEL, we find that the F18 photometrically-selected emission-line galaxies trace out the same property distributions as the spectroscopically-confirmed sample.
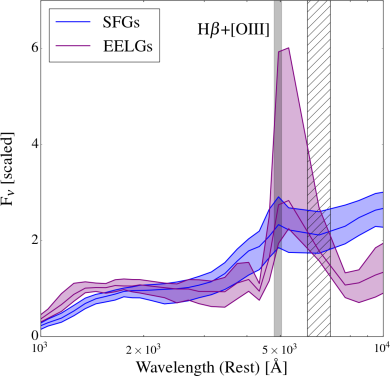
We choose the composite SED with the largest number of analogs (167 galaxies) to represent typical SFGs at . This composite SED has less extreme emission (H+[Oiii] EW Å) and a more moderate UV slope (), as determined in F18. In Figure 1, we plot distributions of the observed photometric SEDs for the galaxies in each of our samples, displaying the differences in SED shapes between the samples.
2.2 Model
We use Prospector111doi:10.5281/zenodo.1116491, a python-based SED fitting code, with a model based on Prospector- (see L17), to derive galaxy properties from photometry. Prospector uses the Flexible Stellar Population Synthesis package (FSPS; Conroy & Gunn 2010, Conroy et al. 2009) via python-FSPS222doi:10.5281/zenodo.12157, taking into account dust attenuation, re-radiation, and nebular emission (Byler et al., 2017). The code uses a Bayesian inference framework and samples the parameter space with emcee (Foreman-Mackey et al., 2013). We employ MESA Isochrones & Stellar Tracks (MIST; see Dotter 2016, Choi et al. 2016, Paxton et al. 2011, 2013, 2015) and a Calzetti et al. (1994) dust law and adopt a Chabrier (2003) IMF and a WMAP9 cosmology (Hinshaw et al., 2013).
2.2.1 SED parameters
Our fits include 9 free parameters: the stellar mass, stellar metallicity, gas-phase metallicity, dust attenuation, and 5 independent nonparametric SFH bins. The stellar and gas-phase metallicities are fit separately in order to allow the model to reproduce the extreme nebular conditions required to drive extraordinary H+[Oiii] emission. We describe the SFH parameters in more depth in §2.2.3. For more information on the free parameters we use in Prospector, we refer the reader to L17.
For our fits, we turn on nebular and dust emission and fix the ionization parameter to . Bands contaminated by Lyman- emission are masked, as the line is difficult to model accurately due to the effects of resonant scattering (e.g. Erb et al. 2014). Prospector accounts for IGM absorption following Madau (1995), but we note that this is not critical because we mask photometry blue-ward of Lyman-. Prospector finds the full PDF for each parameter and generates the spectrum and photometry associated with each parameter vector.
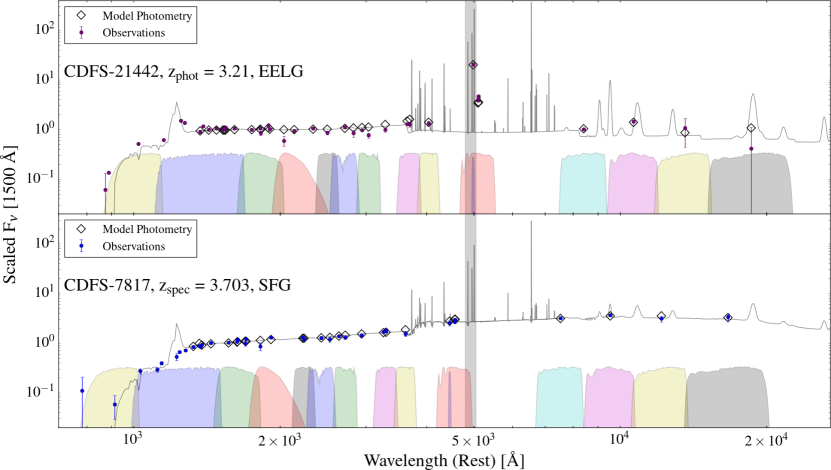
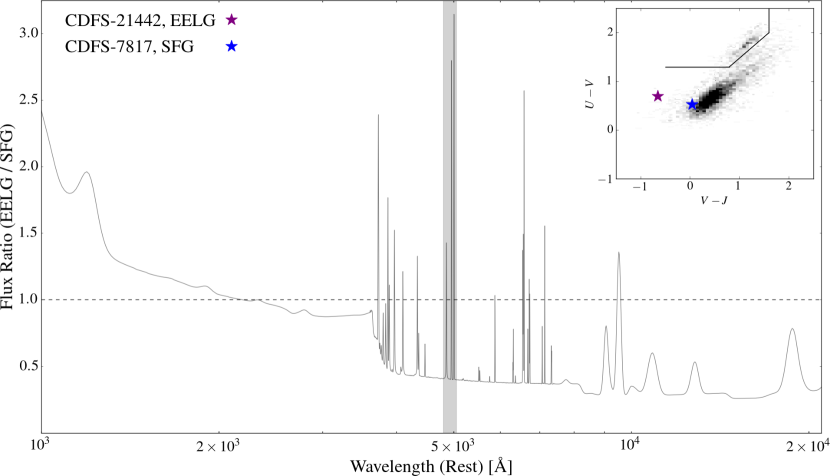
Figure 2 displays the Prospector-derived best-fit model spectrum and SED along with observed photometry for an EELG and SFG in CDFS. The figure also shows a subset of filters in CDFS, displaying our extensive rest frame wavelength coverage. The difference in SED shape that Prospector fits to these galaxies is displayed in Figure 3, highlighting the steep UV slope of the EELG relative to the SFG. The EELG also exhibits excess emission line flux compared to the SFG, particularly in [Oiii]. These differences are largely consistent across the EELGs and SFGs in our sample (see Figure 1).
2.2.2 Comparison to FAST
We have used FAST (Kriek et al., 2009) in past studies (e.g. Forrest et al. 2017) to estimate parameters of EELGs, but note that FAST was originally tailored for studying massive galaxies at . There are several differences between FAST and Prospector: FAST holds stellar metallicity fixed, uses -based SFH models that do not allow for bursts, and uses stellar population synthesis models from Bruzual & Charlot (2003)333BC03 uses Padova and Geneva stellar evolutionary tracks (Kriek et al., 2009). The Forrest et al. (2017) FAST fits also include emission line templates from Salmon et al. (2015).
In contrast, Prospector allows stellar and gas-phase metallicity to vary and fits for nonparametric and thus more diverse SFHs. The MIST models we use include stellar rotation that allows for the production of more ionizing photons at later times (Choi et al., 2016). Additionally, Prospector incorporates emission lines from Byler et al. (2017).
Using FAST-like parameters (fixed , delayed- SFHs) with our Prospector model (including MIST models), we recover properties for our EELGs matching the results in Forrest et al. (2017). With our standard Prospector model, we find higher stellar masses for both EELGs and SFGs by dex and dex, respectively. We attribute this offset to the only two aspects of the model that we changed. First, the stellar metallicities (Z) fit by Prospector are very low compared to the fixed Z used in FAST. Additionally, the SFR in older time bins in Prospector (see §2.2.3) is poorly constrained. When the data are not constrained well, the priors dominate the posterior distributions, and the exponentially declining SFHs in FAST impose very different priors from the L17 nonparametric SFHs.
2.2.3 Nonparametric star formation histories
Nonparametric SFHs are calculated in Prospector by fitting for fraction of total stellar mass formed in bins of lookback time, ranging from the time of the galaxy’s observation to the age of the universe. Mock tests performed at lower redshifts indicate that Prospector accurately recovers summary statistics like the average age. However, we note that recovery of SFR in specific time bins is challenging (L17).
Table 1
Nonparametric SFH bins
| Bin name | Lookback time |
|---|---|
| Myr | |
| Myr | |
| Myr Gyr | |
| - | Varies (see caption) |
The edges of our time bins are chosen to isolate young, massive stars, which we expect to see in galaxies undergoing bursts of star formation. The youngest bin () runs from 0-50 Myr, followed by a 50 Myr-100 Myr bin (), a 100 Myr-1 Gyr bin (), and three bins evenly spaced from 1 Gyr to the age of the Universe at the redshift of the given galaxy (). Because SFR is constant within each bin, the width of puts a ceiling on the sSFR allowed in the model. We test and confirm that our results are robust to different choices of SFH bins.
The prior employed for our nonparametric SFH bins corresponds to constant star formation, i.e. a uniform prior. Leja et al. (in prep.) finds that with broadband photometry, our nonparametric SFHs clearly distinguish between various SFH shapes, including rising, falling, and bursty SFHs. Leja et al. (in prep.) also shows that this prior tends to over-estimate modestly the ages and stellar masses of galaxies with rising SFHs.
2.3 Mock tests
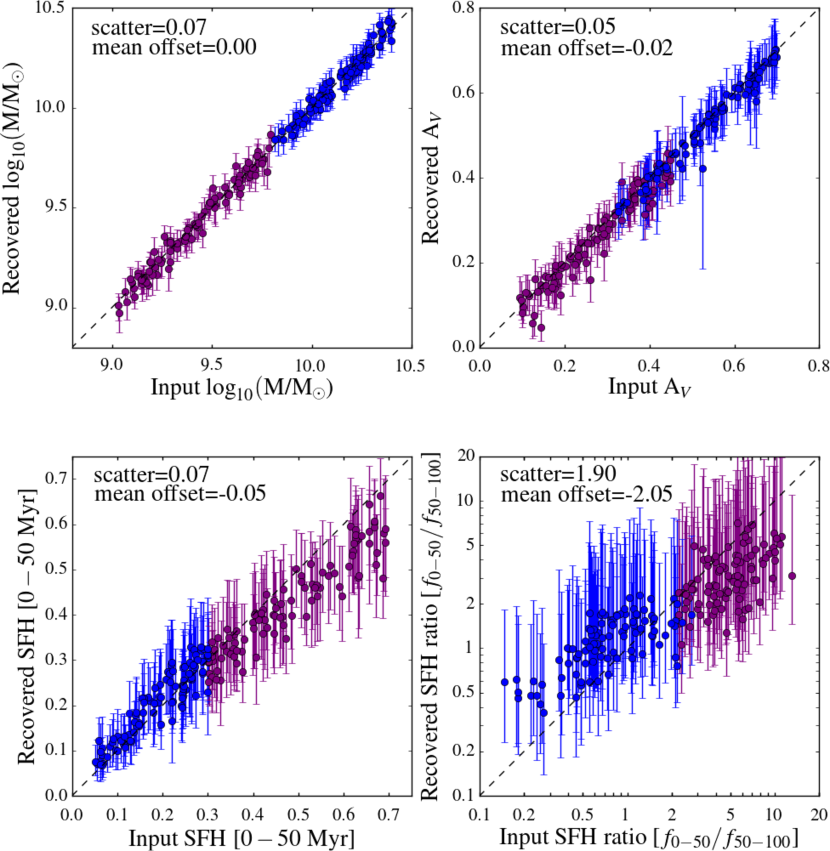
To determine the accuracy with which we can constrain our model parameters, we generate photometry for 100 mock EELG-like and 100 mock SFG-like galaxies. We randomly select from within the priors of our free parameters to create the mock galaxies, then use Prospector to generate the galaxy photometry in zfourge filters. To simulate noise, we perturb the generated photometry by sampling from a Gaussian centered on zero, with a width equal to of the given flux at each point. The photometric errors are drawn randomly at each point to be between 0 and 10% of the given flux, which is on the order of the errors in our real data. Additionally, we randomly select the field and redshift for each mock galaxy, choosing redshifts within .
The results of the mock tests are displayed in Figure 4. We find that the stellar mass, dust, and are all well-recovered by zfourge-like photometry. Crucially, the ratio between and is also well-recovered, indicating Prospector is capable of constraining SFHs from zfourge-like photometry.
3 Results and Discussion
3.1 EELGs show rising star formation histories
Table 2
Properties of composite SEDs
| Property | EELGs | SFGs |
|---|---|---|
| N | 19 | 167 |
| sSFR [Gyr-1] | ||
| log10() | ||
| Ks-band r [kpc] |
For each galaxy, we sample the posterior of each parameter times, building distributions for the EELGs and SFGs. We then calculate the median, 16th percentile, and 84th percentile for these distributions. From the output SFHs and stellar masses we compute specific SFHs (sSFHs) for each galaxy. We similarly calculate distributions of fractional mass formed in for each galaxy. The error on the mean for each of our parameter distributions is very small (), indicating that our uncertainties are dominated by scatter in the distribution, rather than measurement error. The sSFR, stellar mass, dust attenuation, and stellar metallicity are recorded for each sample in Table 2.
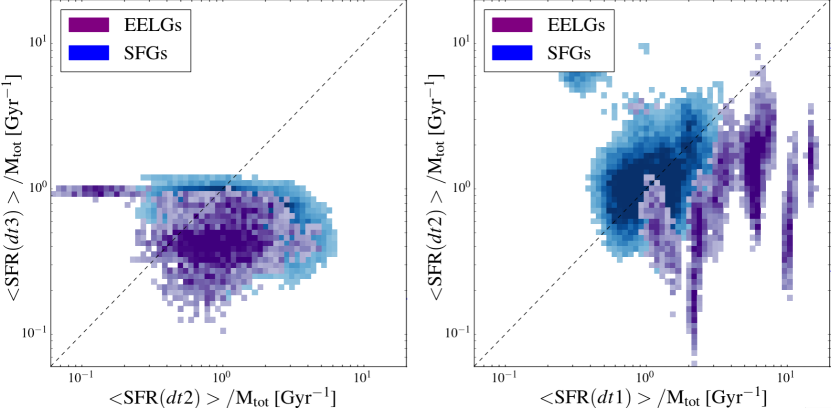
The distributions of SFR normalized by total stellar mass, both in ( Myr) and ( Myr), is displayed for each sample in the right panel of Figure 5. EELGs are twice as likely to have a recent burst compared to SFGs ( vs ). Similarly, we display the distributions in ( Myr) vs ( Myr) in the left panel of Figure 5. The EELGs and SFGs both show rising SFRs on average ( vs ) from to , but only the EELGs show rising SFRs from to , indicating the EELGs have rising SFHs.
With these SFHs, the EELGs display significant star formation only in the past 50 Myr, suggesting that this most recent episode is a dominant starburst. By comparison, most of the SFGs have more constant SFHs. The EELGs and SFGs show median sSFRs of 4.6 Gyr-1 and 1.1 Gyr-1, respectively. We hypothesize that the steep UV slopes and large EWs associated with our EELGs (see e.g. Figures 1 and 3) are driven by their rising SFRs.
Whether the EELGs maintain or decrease their SFRs, their specific SFRs will decrease due to their increasing stellar masses. As such, we hypothesize that the current EELG sSFR distribution will evolve to look more like that of the SFGs. Given the mass, dust, and sSFR offsets between the EELG and SFG samples, we hypothesize that our EELGs are plausible analogs for higher redshift progenitors of the more typical SFGs (e.g. Smit et al. (2015)).
3.2 Bursty vs constant star formation histories
Within 68% confidence intervals, the EELGs form of their stellar mass in the most recent 50 Myr, while the SFGs form only of their mass in the same time. As above, these uncertainties correspond to scatter in each distribution rather than measurement error. As with sSFR and dust (see §3.1), the offset in fractional mass formed remains when considering a mass-matched subsample of our EELGs and SFGs, though a larger sample is necessary for a more rigorous analysis.
We note that three of our EELGs form of their stellar mass in the most recent 50 Myr, with the strongest EELG forming of its mass. We hypothesize that such EELGs may be undergoing an initial major episode of star formation and designate them as candidate first burst galaxies. However, the existing data do not allow us to test for the presence of a faint, older, red stellar population. Only with the resolution and wavelength range of e.g. JWST can this be tested.
The substantial fractional stellar mass formed by our EELG sample indicates many galaxies experience burst-dominated buildups of stellar mass. Our SFGs, as well as the EELGs with less fractional stellar mass formed in the last 50 Myr, may have undergone one or more such episode(s) of star formation prior to their current burst. However, we cannot rule out SFHs with a constant buildup of stellar mass for these galaxies.
We note that recent simulations, such as Feedback In Realistic Environments (FIRE; e.g. Faucher-Giguere 2018) and FirstLight (Ceverino et al., 2018), suggest that star formation at high redshift is burst-dominated. Our observations are consistent with this picture, indicating that the disparities we see in EELG SEDs compared to SFG SEDs likely correspond to variations in recent SFH.
3.3 Fraction of galaxies with extreme emission
To estimate the fraction of galaxies that go through an extreme H+[Oiii] emission line phase between , we compare the number of galaxies identified in emission-line galaxy composite SEDs in F18 to the expected number of total galaxies based on the galaxy stellar mass function. We use the best-fit double-Schechter parameters from Tomczak et al. (2014) for star forming galaxies at to calculate the number density of star forming galaxies in the same mass range as our EELGs.
We find that of galaxies with masses M⊙ at are undergoing extreme emission at the time of observation. This fraction is a lower limit, as the zfourge survey is not complete at the masses of our EELGs. Assuming extreme emission timescales of Myr (e.g. van der Wel et al., 2011; Ceverino et al., 2018) implies that of star-forming galaxies go through an EELG phase at . As such, we hypothesize that a large fraction, and possibly a majority, of low-mass galaxies go through an EELG phase at .
3.4 Metallicities, masses, and caveats
As shown in Table 2, the median EELG has lower stellar mass and is offset to a higher sSFR, less dust, and a more compact size than the median SFG. We stress that we recover similar values for all parameters, including the strikingly low stellar metallicities, when we mask the emission lines in our Prospector fits.
We note that a subset of our EELGs and SFGs overlap in stellar mass at (M / M. The Prospector-derived properties for the mass-matched EELG and SFG subsamples are reported in Table 3. Like the full samples, the mass-matched EELGs are offset to higher sSFRs and less dust compared to the mass-matched SFGs. These results indicate that the sSFR and dust differences we see between the EELGs and SFGs are not simply driven by the stellar mass offset.
Table 3
Properties of mass-matched subsamples
| Property | EELGs (matched) | SFGs (matched) |
|---|---|---|
| N | 5 | 22 |
| sSFR [Gyr-1] | ||
| log10() | ||
The stellar metallicity that we derive is lower than expected based on the metallicities of similar-mass galaxies in the Universe. This may indicate that the stellar metallicity value Prospector measures is a combination of the true metallicity with possible systematics or uncertainties in the modeling.
To investigate the effects of the low stellar metallicities on our results, we reduce the range of the stellar metallicity in our model. Using a lower bound of , the fit stellar masses decrease by dex (as expected from §2.2.2) and correspondingly return sSFRs a factor of 1.4 times larger than those in Table 2. However, our qualitative results regarding the recent burst of star formation in EELGs, the rising SFHs in our EELGs, and the differences in SFH between our EELG and SFG samples remain unchanged.
Comparing the reduced for tests with higher stellar metallicity floors, we rule out stellar metallicities on the order of for our EELGs and SFGs. Although we cannot rule out stellar metallicities for individual galaxies, we find that the average population for both EELGs and SFGs shows a weak preference () for the lower stellar metallicities fit with a floor of .
It is plausible that the extreme nebular conditions in our galaxies may be straining the model, affecting parameters like stellar metallicity. One other known inaccuracy is the geometry of the dust, the young stars, and the old stars, which are more complex in real galaxies than in our models. Our Calzetti et al. (1994) attenuation law may also lead to erroneous metallicity estimates. Systematically investigating these possibilities is beyond the scope of the present paper; here we simply caution that the fit parameters may not only reflect the physical parameters that we associate with them.
4 Conclusions
We explore the properties of 19 extreme H+[Oiii] emission line galaxies and a population of more typical star-forming galaxies identified in the zfourge survey. The EELGs are selected from the bluest composite SED built in Forrest et al. (2018) at , and the SFGs are selected from the composite SED with the most analog galaxies at the same redshift range. In a companion paper, Tran et al. (2018, in prep.) spectroscopically confirm 4 of our EELGs with the MOSEL survey and find that the spectroscopically-confirmed EELGs trace the same property distributions as the photometrically-selected sample in F18.
We use the Prospector SED fitting code, which includes a physical model for nebular line and continuum emission, to estimate probability distribution functions for stellar mass, stellar metallicity, dust attenuation, and SFH for each of our galaxies. We compare the EELG and SFG distributions for each of these parameters. Compared to the SFGs, the EELGs have lower stellar masses and are offset toward higher sSFRs, less dust, and smaller half-light radii.
The EELGs display a dominant starburst in the most recent 50 Myr and are twice as likely to have a recent burst of star formation compared to SFGs ( vs ). Furthermore, the EELGs form of their stellar mass in the most recent 50 Myr, with a subset forming of their stellar mass; we coin the latter first burst galaxies. In contrast, the SFGs form only of their stellar mass in the same time. The median sSFR for the EELGs is 4.6 Gyr-1 and for the SFGs is 1.1 Gyr-1.
The EELG and SFG stellar masses from Prospector are offset to higher values than earlier results e.g. with FAST. This is likely due to the lower stellar metallicities and nonparametric SFHs. Additionally, our EELGs and SFGs have sub-solar stellar metallicites, but we note that our model does not strongly constrain the true value. However, we find that applying different stellar metallicity floors does not change our qualitative SFH results. Future work involving improved modeling of the UV slope and reducing uncertainties in the youngest stellar populations (e.g. Myr) are needed to better constrain the properties of EELGs and SFGs at .
From the number density of EELGs, we estimate that at least of star-forming galaxies with stellar masses M⊙ display extreme emission between . Our results indicate that burst-dominated growth may be common at and that these episodes can drive extreme emission lines. The key next step in characterizing the relationship of the EELGs to the larger galaxy population is establishing the typical duration of the EELG phase.
New, groundbreaking telescopes such as JWST will be able to detect H emission from these galaxies and provide more reliable measurements of SFR, stellar metallicity, the ionization parameter, and electron temperature. More accurate estimates for these parameters will help test scaling relations at high redshifts, improving our SED modeling techniques by formulating more informative priors. Additionally, calculating gas masses (e.g. with ALMA) would be instrumental in estimating SFH burst timescales. Follow-up observations with such telescopes will thus provide more insight into the early lives of SFGs, EELGs, and the prevalence of H+[Oiii] extreme emission as an early-lifetime phase.
Acknowledgements
We wish to thank the Mitchell family for their continuing support of astronomy. We also thank the Carnegie Observatories and the Las Campanas Observatory for their assistance in making the zfourge survey possible. K. Tran thanks P. Oesch, B. Holden, and M. Maseda for helpful discussions and acknowledges support by the National Science Foundation under grant #1410728. GGK acknowledges the support of the Australian Research Council through the award of a Future Fellowship (FT140100933). BF would like to thank the Hagler Institute for Advanced Study at Texas A&M. JHC thanks T. Hutchison for constructive comments on the first draft. Portions of this research were conducted with high performance research computing resources provided by Texas A&M University (https://hprc.tamu.edu). We also thank the anonymous referee for valuable comments that improved the manuscript.
References
- Amorín et al. (2015) Amorín, ‚. R., Pérez-Montero, E., Contini, T., et al. 2015, Astronomy & Astrophysics, 578, A105
- Atek et al. (2011) Atek, H., Siana, B., Scarlata, C., et al. 2011, The Astrophysical Journal, 743, 121
- Bertin & Arnouts (1996) Bertin, E., & Arnouts, S. 1996, Astronomy and Astrophysics Supplement Series, 117, 393
- Bruzual & Charlot (2003) Bruzual, G., & Charlot, S. 2003, Monthly Notices of the Royal Astronomical Society, 344, 1000
- Byler et al. (2017) Byler, N., Dalcanton, J. J., Conroy, C., & Johnson, B. D. 2017, The Astrophysical Journal, 840, 44
- Calzetti et al. (1994) Calzetti, D., Armus, L., Bohlin, R. C., et al. 1994, The Astrophysical Journal, 533, 2
- Cardamone et al. (2009) Cardamone, C., Schawinski, K., Sarzi, M., et al. 2009, Monthly Notices of the Royal Astronomical Society, 399, 1191
- Ceverino et al. (2018) Ceverino, D., Klessen, R., & Glover, S. 2018, 8, 1
- Chabrier (2003) Chabrier, G. 2003, Publications of the Astronomical Society of the Pacific, 115, 763
- Choi et al. (2016) Choi, J., Dotter, A., Conroy, C., et al. 2016, The Astrophysical Journal, 823, 1
- Conroy & Gunn (2010) Conroy, C., & Gunn, J. E. 2010, The Astrophysical Journal, 712, 833
- Conroy et al. (2009) Conroy, C., Gunn, J. E., & White, M. 2009, The Astrophysical Journal, 699, 486
- Dotter (2016) Dotter, A. 2016, The Astrophysical Journal Supplement Series, 222, 8
- Erb et al. (2014) Erb, D. K., Steidel, C. C., Trainor, R. F., et al. 2014, Astrophysical Journal, 795, arXiv:1408.3638
- Faucher-Giguere (2018) Faucher-Giguere, C. A. 2018, Monthly Notices of the Royal Astronomical Society2, 473, 3717
- Foreman-Mackey et al. (2013) Foreman-Mackey, D., Hogg, D. W., & Lang, D. 2013, Astronomical Society of the Pacific, 125, 306
- Forrest et al. (2017) Forrest, B., Tran, K.-v. H., Broussard, A., et al. 2017, The Astrophysical Journal Letters, 838, L12
- Forrest et al. (2018) Forrest, B., Tran, K.-v. H., Broussard, A., et al. (accepted), The Astrophysical Journal, arXiv:1807.03785
- Giacconi et al. (2002) Giacconi, R., Zirm, A., Wang, J., et al. 2002, The Astrophysical Journal Supplement Series, 139, 369
- Hinshaw et al. (2013) Hinshaw, G., Larson, D., Komatsu, E., et al. 2013, The Astrophysical Journal Supplement Series, 208, doi:10.1088/0067-0049/208/2/19
- Holden et al. (2016) Holden, B. P., Oesch, P. A., González, V. G., et al. 2016, The Astrophysical Journal, 820, 73
- Izotov et al. (2011) Izotov, Y. I., Guseva, N. G., & Thuan, T. X. 2011, The Astrophysical Journal, 728, 161
- Kriek et al. (2009) Kriek, M., Van Dokkum, P. G., Labbé, I., et al. 2009, The Astrophysical Journal, 700, 221
- Labbé et al. (2013) Labbé, I., Oesch, P. a., Bouwens, R. J., et al. 2013, The Astrophysical Journal, 777, L19
- Lawrence et al. (2007) Lawrence, A., Warren, S. J., Almaini, O., et al. 2007, Monthly Notices of the Royal Astronomical Society, 379, 1599
- Leja et al. (2017) Leja, J., Johnson, B. D., Conroy, C., Dokkum, P. G. V., & Byler, N. 2017, The Astrophysical Journal, 837, 170
- Madau (1995) Madau, P. 1995, The Astrophysical Journal, 441, 1
- Madau et al. (1998) Madau, P., Pozzetti, L., & Dickinson, M. 1998, The Astrophysical Journal, 498, 106
- Maseda et al. (2013) Maseda, M. V., van der Wel, A., da Cunha, E., et al. 2013, The Astrophysical Journal, 778, L22
- Maseda et al. (2014) Maseda, M. V., Van Der Wel, A., Rix, H. W., et al. 2014, Astrophysical Journal, 791, arXiv:1406.3351
- Nakajima & Ouchi (2014) Nakajima, K., & Ouchi, M. 2014, Monthly Notices of the Royal Astronomical Society, 442, 900
- Nanayakkara et al. (2016) Nanayakkara, T., Glazebrook, K., Kacprzak, G. G., et al. 2016, The Astrophysical Journal, 828, 21
- Ouchi et al. (2009) Ouchi, M., Mobasher, B., Shimasaku, K., et al. 2009, The Astrophysical Journal, 706, 1136
- Paxton et al. (2011) Paxton, B., Bildsten, L., Dotter, A., et al. 2011, Astrophysical Journal, Supplement Series, 192, arXiv:1009.1622
- Paxton et al. (2013) Paxton, B., Cantiello, M., Arras, P., et al. 2013, Astrophysical Journal, Supplement Series, 208, arXiv:1301.0319
- Paxton et al. (2015) Paxton, B., Marchant, P., Schwab, J., et al. 2015, Astrophysical Journal, Supplement Series, 220, arXiv:1506.03146
- Salmon et al. (2015) Salmon, B., Papovich, C., Finkelstein, S. L., et al. 2015, The Astrophysical Journal, 799, arXiv:1407.6012
- Sanders et al. (2016) Sanders, R. L., Shapley, A. E., Kriek, M., et al. 2016, The Astrophysical Journal Letters, 825, 1
- Scoville et al. (2007) Scoville, N., Aussel, H., Brusa, M., et al. 2007, The Astrophysical Journal Supplement Series, 172, 1
- Smit et al. (2014) Smit, R., Bouwens, R. J., Labbé, I., et al. 2014, The Astrophysical Journal, 784, 58
- Smit et al. (2015) Smit, R., Bouwens, R. J., Franx, M., et al. 2015, The Astrophysical Journal, 801, 122
- Sobral et al. (2013) Sobral, D., Smail, I., Best, P. N., et al. 2013, Monthly Notices of the Royal Astronomical Society, 428, 1128
- Straatman et al. (2016) Straatman, C. M. S., Spitler, L. R., Quadri, R. F., et al. 2016, The Astrophysical Journal, 830, 1
- Tomczak et al. (2014) Tomczak, A. R., Quadri, R. F., Tran, K.-v. H., et al. 2014, The Astrophysical Journal, 783, 2
- van der Wel et al. (2011) van der Wel, A., Straughn, A. N., Rix, H.-W., et al. 2011, The Astrophysical Journal, 742, 111