Unexpected Zero Bias Conductance Peak on the Topological Semimetal Sb(111) with a Broken Bilayer
Abstract
The long-sought Majorana fermion is expected to manifest in a topological-superconductor heterostructure as a zero bias conductance peak (ZBCP). As one promising platform for such heterostructures, we investigate the cleaved surface of the topological semimetal Sb(111) using scanning tunneling microscopy and spectroscopy. Remarkably, we find a robust ZBCP on some terraces of the cleaved surface, although no superconductor is present. Using quasiparticle interference imaging, Landau level spectroscopy and density functional theory, we show that the ZBCP originates from a van Hove singularity pushed up to the Fermi level by a sub-surface stacking fault. Amidst the sprint to stake claims on new Majorana fermion systems, our finding highlights the importance of using a local probe together with detailed modeling to check thoroughly for crystal imperfections that may give rise to a trivial ZBCP unrelated to Majorana physics.
The search for Majorana fermions has become a research priority in recent years because of potential applications in topologically protected quantum computing Bravyi and Kitaev (2002); Bravyi (2006); Alicea et al. (2011). It has been proposed that Majorana fermions can be created at the interface between an -wave superconductor and a topological material Fu and Kane (2008). The signature of the Majorana fermion Law et al. (2009); Akhmerov et al. (2011) would be a zero bias anomaly in the tunneling conductance at the interface. Therefore, zero bias spectral anomalies observed in a number of experiments Deng et al. (2012); Mourik et al. (2012); Das et al. (2012); Xu et al. (2015a) have drawn much attention. However, there are many other possible origins of the zero bias anomalies, such as disorder Liu et al. (2012) and Kondo effects Cho et al. (2016). Therefore, extreme care is required to interpret and verify the origins of any observed zero bias anomaly Xu et al. (2015b); Sun et al. (2016); Yin et al. (2015); Wang et al. (2018).
Topological semimetal Sb(111) is a promising platform for interfacing with a superconductor, due to its clean, stable surface and long-lived surface states Soumyanarayanan et al. (2015). Because of its simple bilayer structure, it has a smaller critical thickness than other topological materials to decouple top and bottom surface states Yao et al. (2013). Moreover, it is less fragile Park et al. (2015) than tetradymite topological insulators, so a superconducting film could be grown on top without destroying it. In addition, its semiconducting bulk screens chemical potential variations Roushan et al. (2009); Beidenkopf et al. (2011), leading to a more homogeneous surface state, more suitable for superconductor proximity effect study.
Here we show that a robust zero bias conductance peak (ZBCP) can appear on the clean cleaved surface of Sb(111), without proximity to superconductivity. Through a combination of quasiparticle interference imaging, Landau level spectroscopy, and density functional theory, we demonstrate that the ZBCP originates from a sub-surface stacking fault: an isolated single layer of Sb, buried within the normal bilayer structure. The broken layer introduces additional states at negative energy, pushing a saddle point up towards the Fermi energy and producing a van Hove singularity at the Fermi level. We thus introduce a cautionary note in the search for Majorana fermions at Sb-superconductor interfaces, and more generally we exemplify how a trivial crystal defect can robustly mimic the long-sought Majorana.
High-purity antimony (99.999, from Alfa Aesar®) in shot form (10.15 g, 6 mm) was sealed in an evacuated quartz tube, and heated in a box furnace to C for 24 hours. The furnace was cooled slowly (C/min) to C, and subsequently cooled to room temperature. Scanning tunneling microscope (STM) measurements were performed using a home-built STM at liquid helium temperatures. Single crystals of Sb were cleaved in situ in cryogenic ultra-high vacuum to expose the (111) face, and inserted into the STM. Mechanically cut PtIr tips, cleaned by field emission and characterized on gold, were used for the measurements. Spectroscopy data were acquired using a lock-in technique at 1.115 kHz, and conductance maps were obtained by recording out-of-feedback spectra at each spatial location.
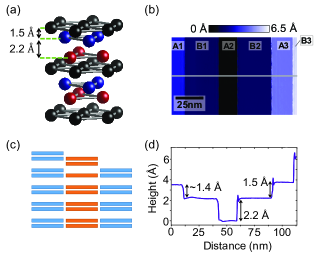
The structure of Sb(111) is shown in Fig. 1(a), from which we can see that the inter-bilayer distance is 2.2 Å and the intra-bilayer distance is 1.5 Å Barrett et al. (1963); Liu and Allen (1995). Since the bonding is much stronger within a bilayer than between bilayers, we expect that the sample will typically terminate between bilayers. The expected step height on terraced surfaces, 2.2 Å + 1.5 Å = 3.7 Å, is indeed observed in most studies Gomes et al. (2009); Yao et al. (2013); Soumyanarayanan et al. (2013). However, Fig. 1(b) shows a topographic image of an unusual terraced region of the cleaved surface of Sb(111). The height profile perpendicular to the steps is shown in Fig. 1(d). There are two types of steps, with heights around 1.5 Å and 2.2 Å. These are much closer to the intra- and inter- bilayer distances, respectively, than to the expected full-unit-cell step height of 3.7 Å. These unusual step heights can arise from the configuration shown in Fig. 1(c), where there is a single broken layer at or beneath the surface of a terrace. The single broken layer could be due to the cleavage process or a pre-existing stacking fault within the sample. In the following, we will refer to this kind of unusual terrace as an ‘abnormal’ terrace and the terrace without a single broken layer as a ‘normal’ terrace. From the height profile in Fig. 1(d), terraces B1, B2, and B3 in Fig. 1(b) can be identified as abnormal.
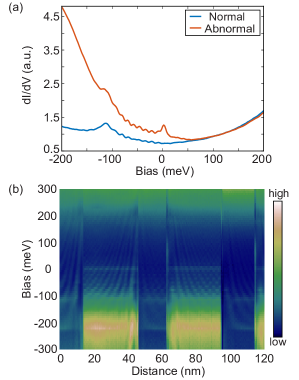
Fig. 2(a) displays averaged spectra on the normal and abnormal terraces in Fig. 1(b). The abnormal terraces show a robust ZBCP, with width 13 meV from a Lorentzian fit. Individual spectra, acquired along the grey line in Fig. 1(b), are shown in Fig. 2(b), where color depicts the relative intensity of , which is proportional to the density of states (DOS). The zero bias peaks are quite robust on all three abnormal terraces shown. There is also a series of peaks in each curve, equally spaced in energy, from approximately -100 to 0 meV. These quantized peaks have been previously identified on terraced Sb(111) as arising from partial quantum confinement of surface states on finite terraces Seo et al. (2010) (see supplementary section 1).
First we consider whether there is any possibility of superconductivity near our Sb(111) surface, which could give rise to a Majorana mode via predicted mechanisms Fu and Kane (2008). Sb can superconduct with critical temperature K at high pressure Wittig (1969), but the temperature in our experiments ranged from 4.5 to 5.4 K. A metastable highly-strained state of Sb with a collapsed face-centered cubic structure may have as high as 7.5 K Reale (1978). However, we observe no significant change of the lattice constant on the abnormal surface (see supplementary section 2), which implies that there is no such crystal structure change leading to superconductivity in our sample.
To clarify the origin of the ZBCP on the abnormal terrace, we investigate the momentum-resolved electronic structure on this terrace. There are two ways STM can obtain this information, through quasiparticle interference (QPI) and Landau level (LL) spectroscopy, which can be obtained simultaneously on Sb Soumyanarayanan et al. (2015). QPI is the process by which states of initial wavevector and energy scatter elastically and interfere with outgoing states of wavevector , producing a standing wave pattern with wavevector in the map at energy . The measured can be inverted to find the band structure . LLs occur when an applied magnetic field quantizes the electronic density of states (DOS), resulting in oscillations in , whose peak energies can be fit to determine .
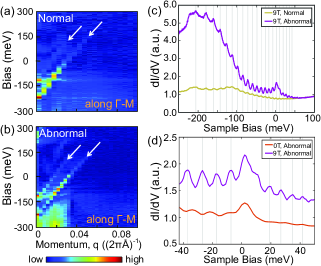
The QPI standing waves on the terraces in Fig. 2(b) arise from scattering of surface states by the step edges. Figure 3(a-b) show the 1D Fourier transform of the QPI patterns on the normal and abnormal terraces, respectively. Both terraces show two prominent linear dispersions, starting from around -200 meV and -100 meV, corresponding to two scattering modes in the double-cone surface state band structure of Sb, in agreement with previous studies Seo et al. (2010); Yao et al. (2013); Soumyanarayanan et al. (2015). The slopes of the two dispersions on the normal and abnormal surfaces are similar from linear fit, as shown in Table 1. Apparently the main features of the surface states of the abnormal terrace are quite similar to those of the normal terrace.
| Normal | Abnormal | |||||
|---|---|---|---|---|---|---|
| Upper | 7.0 | 0.4 | 7.5 | 0.2 | ||
| Lower | 6.8 | 0.2 | 7.1 | 0.1 | ||
The other phenomena that can reflect the band structure is LLs in the spectrum. As in other topological materials, we can interpret the LLs in the Dirac fermion picture Hanaguri et al. (2010); Okada et al. (2011); Cheng et al. (2010); Jiang et al. (2012), wherein the energy of the LL increases with . The Bohr-Sommerfeld quantization relation suggests the momentum space radius for the LL orbit is also proportional to Hanaguri et al. (2010). So, by tracing the energy of the peak in the DOS spectrum, we can deduce the dispersion of the energy of surface states versus momentum. Fig. 3(c) demonstrates that the LL peaks on normal and abnormal terraces of Sb, at the same T, match quite well. This also suggests that the band structure of the surface states on the abnormal terrace are quite similar to that on the normal terrace. Fig. 3(d) shows that at T, the ZBCP is still robust, and its width remains around 10 meV by the Lorentzian fit. The absence of peak splitting means the possibility for Kondo effect Niu et al. (2015); Cho et al. (2016) to play a role in inducing the ZBCP is not apparent from the experiment. Otherwise, an energy splitting of 13.4 meV would be expected from Kondo resonance with Liu et al. (2013), given g12.8 for Sb Soumyanarayanan et al. (2013).
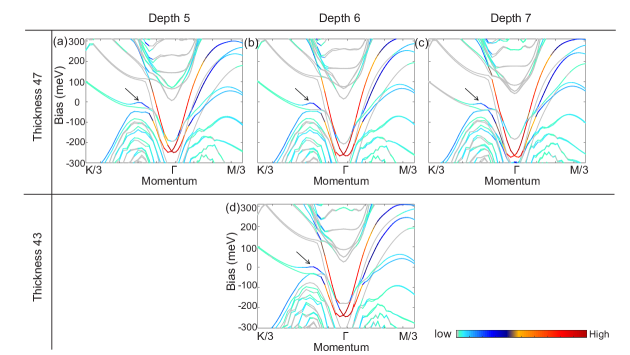
To better understand the origin of the ZBCP, we performed density functional theory (DFT) calculations using VASP, with Perdew-Burke-Ernzerhof (PBE) pseudopotential. We numerically simulated the band structures and surface states for the normal and abnormal terraces, using a slab geometry. The results along the M-K--M directions are plotted in Fig. 4(a) to (b). STM tunneling current measures the overlap between tip and surface wavefunctions. The outermost valence electrons in Sb are in and orbitals. Since the Sb orbital points out of the surface, and reaches farther towards the tip than the Sb orbital, the orbital is expected to dominate the STM measurement. Hence, to recognize the main contributor in experiment, we projected the available electronic states in orbital on the surface in the band structure. The grey lines in the figures are the unavailable states on the surface. The available states are colored according to their normalized relative contribution to the DOS spectrum. In addition, a scaling factor of 1.2 was applied in energy in order to better match the experimental features on the normal terrace. The same energy scaling factor was employed on the abnormal terrace. But the energy scaling would not affect the energy value of the feature at 0 meV giving rise to the zero bias peak.
For the normal terrace in Fig. 4(a), the surface state is a double Dirac cone ranging from around -250 meV to 100 meV. There is a saddle point () at around meV. The energy of the minimum of the cones () are a bit above -300 meV and that of an extreme is just above 200 meV. The shapes and main features of the calculated band structure for normal terrace thus agree quite well with previous experiment Soumyanarayanan et al. (2015). The subtle difference in the exact value could be due to the finite size of the slab (46 layers, or 23 bilayers in total were used for the normal terrace).
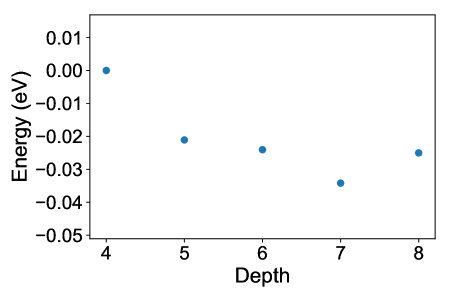
For the calculation on the abnormal terrace, we started with the single broken layer at the surface of the slab. However, after DFT relaxation of the structure, the single broken layer sunk into the bulk of the slab. The calculation indicates that even if the single broken layer was created at the surface during the in situ cleaving process, other layers would rearrange themselves so that the single broken layer would appear below the surface in order to lower the energy. The structure can be stablized when the broken layer is at more than 4 bilayers below the surface. As shown in supplementary section 3, the energy is generally lowered when the single broken layer is at 5 to 8 bilayers below the surface. Also, when the broken layer is 4 bilayer below the surface, the states from the broken layer interfere too much with the surface such that no clear feature of surface state can be recognized. So we did our calculation mostly at cases where the broken layer is a bit farther away from the surface, but not too far such that the effect of the broken layer is still apparent. Fig. 4(b) shows the typical result for the abnormal terrace, using a slab of 47 layers with the single broken layer 6 bilayers below the surface.
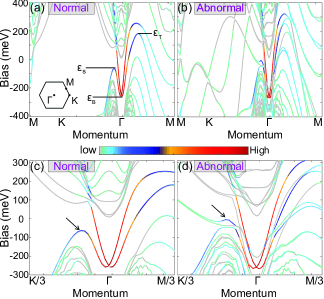
The contribution of states to the STM-measured is expected to decay exponentially away from the point Tersoff and Hamann (1983). So we focus on the band structure around the point as shown in Fig. 4(c) and (d) for the normal and abnormal surfaces. Apparently, the double-cone feature of the normal surface state is preserved in a similar energy range on the abnormal terrace. This explains why similar QPI and LL quantization, which reflect the characteristics of the surface state, were observed on the abnormal terrace in our experiment.
Now we turn our attention to the saddle point, and show that it is responsible for the ZBCP on the abnormal surface. As mentioned above, on the normal terrace, there is a saddle point () around -100 meV on the outer cone along the -K direction, which causes a peak at around -100 meV in the DOS spectrum of the normal terrace Soumyanarayanan et al. (2015). However, on the abnormal terrace (Fig. 4(e)), there are more states appearing below this saddle point, pushing it up to the Fermi energy (0 meV). This will constitute a van Hove singularity leading to a peak in the zero bias of the DOS spectrum. This pushed-up saddle point can be seen in slabs with the single broken layer at different depths (as long as it can be stabilized). Other plots of band structure for the abnormal terrace with slab of different thickness and single broken layer at different depth can be also be found in the supplementary section 4. So our findings suggested that the origin of the zero bias peak observed in experiment is a trivial (non-topological) effect due to the sub-surface stacking fault: the single sunken broken layer.
Other characteristics in the DOS spectrum of the abnormal terrace from Fig. 2(a) included a larger bump at negative energies from -200 meV to 0 meV, compared with that of the normal terrace. Comparing the band structures of the normal (Fig. 4(c)) and abnormal (Fig. 4(d)) terraces, there are more available states on the abnormal terrace around the point from around -200 meV to 0 meV. This naturally explains why the conductance is enhanced on the abnormal terrace from -200 meV to 0 meV.
In conclusion, we reported that the ZBCP, which is the signature of Majorana fermion, can arise trivially from a sub-surface stacking fault within topological material, even if the surface is clean. Amidst the sprint to stake claims on new Majorana fermion systems, our finding highlights the importance of using a local probe and detailed modeling to check thoroughly for crystal imperfections that may give rise to a trivial ZBCP unrelated to Majorana physics.
References
- Bravyi and Kitaev (2002) Sergey Bravyi and Alexei Kitaev, “Fermionic quantum computation,” Annals of Physics 298, 210–226 (2002).
- Bravyi (2006) Sergey Bravyi, “Universal quantum computation with the fractional quantum Hall state,” Phys. Rev. A 73, 042313 (2006).
- Alicea et al. (2011) Jason Alicea, Yuval Oreg, Gil Refael, Felix von Oppen, and Matthew P. A. Fisher, “Non-Abelian statistics and topological quantum information processing in 1D wire networks,” Nat. Phys. 7, 412–417 (2011).
- Fu and Kane (2008) Liang Fu and C L Kane, “Superconducting proximity effect and Majorana fermions at the surface of a topological insulator,” Phys. Rev. Lett. 100, 096407 (2008).
- Law et al. (2009) K. T. Law, Patrick A. Lee, and T. K. Ng, “Majorana fermion induced resonant Andreev reflection,” Phys. Rev. Lett. 103, 237001 (2009).
- Akhmerov et al. (2011) A. R. Akhmerov, J. P. Dahlhaus, F. Hassler, M. Wimmer, and C. W J Beenakker, “Quantized conductance at the Majorana phase transition in a disordered superconducting wire,” Phys. Rev. Lett. 106, 057001 (2011).
- Deng et al. (2012) M. T. Deng, C. L. Yu, G. Y. Huang, M. Larsson, P. Caroff, and H. Q. Xu, “Anomalous zero-bias conductance peak in a Nb-InSb nanowire-Nb hybrid device,” Nano Lett. 12, 6414–6419 (2012).
- Mourik et al. (2012) V. Mourik, K. Zuo, S. M. Frolov, S. R. Plissard, E. P. A. M. Bakkers, and L. P. Kouwenhoven, “Signatures of majorana fermions in hybrid superconductor-semiconductor nanowire devices,” Science 336, 1003–1007 (2012).
- Das et al. (2012) Anindya Das, Yuval Ronen, Yonatan Most, Yuval Oreg, Moty Heiblum, and Hadas Shtrikman, “Zero-bias peaks and splitting in an Al-InAs nanowire topological superconductor as a signature of Majorana fermions,” Nat. Phys. 8, 887–895 (2012).
- Xu et al. (2015a) Jin Peng Xu, Mei Xiao Wang, Zhi Long Liu, Jian Feng Ge, Xiaojun Yang, Canhua Liu, Zhu An Xu, Dandan Guan, Chun Lei Gao, Dong Qian, Ying Liu, Qiang Hua Wang, Fu Chun Zhang, Qi Kun Xue, and Jin Feng Jia, “Experimental detection of a Majorana mode in the core of a magnetic vortex inside a topological insulator-superconductor Bi2Te3/NbSe2 heterostructure,” Phys. Rev. Lett. 114, 017001 (2015a).
- Liu et al. (2012) Jie Liu, Andrew C Potter, K T Law, and Patrick A Lee, “Zero-bias peaks in the tunneling conductance of spin-orbit-coupled superconducting wires with and without Majorana end-states,” Phys. Rev. Lett. 109, 267002 (2012).
- Cho et al. (2016) Sungjae Cho, Ruidan Zhong, John A Schneeloch, Genda Gu, and Nadya Mason, “Kondo-like zero-bias conductance anomaly in a three-dimensional topological insulator nanowire,” Sci. Rep. 6, 21767 (2016).
- Xu et al. (2015b) Jin-Peng Xu, Mei-Xiao Wang, Zhi Long Liu, Jian-Feng Ge, Xiaojun Yang, Canhua Liu, Zhu An Xu, Dandan Guan, Chun Lei Gao, Dong Qian, Ying Liu, Qiang-Hua Wang, Fu-Chun Zhang, Qi-Kun Xue, and Jin-Feng Jia, “Experimental detection of a Majorana mode in the core of a magnetic vortex inside a topological insulator-superconductor Bi2Te3/NbSe2 heterostructure,” Physical Review Letters 114, 017001 (2015b).
- Sun et al. (2016) Hao-hua Sun, Kai-wen Zhang, Lun-hui Hu, Chuang Li, Guan-yong Wang, Hai-yang Ma, Zhu-An Xu, Chun-Lei Gao, Dan-Dan Guan, Yao-Yi Li, Canhua Liu, Dong Qian, Yi Zhou, Liang Fu, Shao-Chun Li, Fu-Chun Zhang, and Jin-Feng Jia, “Majorana zero mode detected with spin selective Andreev reflection in the vortex of a topological superconductor,” Physical Review Letters 116, 257003 (2016).
- Yin et al. (2015) J-X. Yin, Zheng Wu, J-H. Wang, Z-Y. Ye, Jing Gong, X-Y. Hou, Lei Shan, Ang Li, X-J. Liang, X-X. Wu, Jian Li, C-S. Ting, Z-Q. Wang, J-P. Hu, P-H. Hor, H. Ding, and S. H. Pan, “Observation of a robust zero-energy bound state in iron-based superconductor Fe(Te,Se),” Nature Physics 11, 543–546 (2015).
- Wang et al. (2018) Dongfei Wang, Lingyuan Kong, Peng Fan, Hui Chen, Shiyu Zhu, Wenyao Liu, Lu Cao, Yujie Sun, Shixuan Du, John Schneeloch, Ruidan Zhong, Genda Gu, Liang Fu, Hong Ding, and Hongjun Gao, “Evidence for Majorana bound states in an iron-based superconductor,” Science , eaao1797 (2018).
- Soumyanarayanan et al. (2015) Anjan Soumyanarayanan, Michael M Yee, Yang He, Hsin Lin, Dillon R Gardner, Arun Bansil, Young S Lee, and Jennifer E Hoffman, “Momentum-resolved STM studies of Rashba-split surface states on the topological semimetal Sb,” J. Electron. Spectrosc. Relat. Phenom. 201, 66–73 (2015).
- Yao et al. (2013) Guanggeng Yao, Ziyu Luo, Feng Pan, Wentao Xu, Yuan Ping Feng, and Xue-Sen Wang, “Evolution of topological surface states in antimony ultra-thin films,” Sci. Rep. 3, 02010 (2013).
- Park et al. (2015) Jihwey Park, Yeong-Ah Soh, Gabriel Aeppli, Xiao Feng, Yunbo Ou, Ke He, and Qi-Kun Xue, “Crystallinity of tellurium capping and epitaxy of ferromagnetic topological insulator films on SrTiO3,” Sci. Rep. 5, 11595 (2015).
- Roushan et al. (2009) Pedram Roushan, Jungpil Seo, Colin V Parker, Y S Hor, D Hsieh, Dong Qian, Anthony Richardella, M Z Hasan, R J Cava, and Ali Yazdani, “Topological surface states protected from backscattering by chiral spin texture,” Nature 460, 1106–1109 (2009).
- Beidenkopf et al. (2011) Haim Beidenkopf, Pedram Roushan, Jungpil Seo, Lindsay Gorman, Ilya Drozdov, Yew San Hor, R. J. Cava, and Ali Yazdani, “Spatial fluctuations of helical Dirac fermions on the surface of topological insulators,” Nat. Phys. 7, 939–943 (2011).
- Barrett et al. (1963) C. S. Barrett, P. Cucka, and K. Haefner, “The crystal structure of antimony at 4.2, 78 and 298∘K,” Acta Crystallogr. 16, 451–453 (1963).
- Liu and Allen (1995) Yi Liu and Roland E. Allen, “Electronic structure of the semimetals Bi and Sb,” Phys. Rev. B 20, 1566–1577 (1995).
- Gomes et al. (2009) Kenjiro K. Gomes, Wonhee Ko, Warren Mar, Yulin L. Chen, Zhi-Xun Z.-X. Shen, and Hari C. Manoharan, “Quantum imaging of topologically unpaired spin-polarized Dirac fermions,” Arxiv Preprint , 0909.0921 (2009), arXiv:0909.0921 .
- Soumyanarayanan et al. (2013) Anjan Soumyanarayanan, Michael M Yee, Yang He, Hsin Lin, Dillon R Gardner, Arun Bansil, Young S Lee, and Jennifer E. Hoffman, “Imaging the nanoscale band structure of topological Sb,” Arxiv Preprint , 1311.1758 (2013), arXiv:1311.1758 .
- Seo et al. (2010) Jungpil Seo, Pedram Roushan, Haim Beidenkopf, Y S Hor, R J Cava, and Ali Yazdani, “Transmission of topological surface states through surface barriers,” Nature 466, 343–346 (2010).
- Wittig (1969) J. Wittig, “A study of the superconductivity of antimony under pressure and a search for superconductivity in arsenic,” J. Phys. Chem. Solids 30, 1407–1410 (1969).
- Reale (1978) C. Reale, “Properties of vapour-quenched superconducting A1-type As, Sb and Bi films,” Vacuum 28, 1–3 (1978).
- Hanaguri et al. (2010) T Hanaguri, K Igarashi, M Kawamura, H Takagi, and T Sasagawa, “Momentum-resolved landau-level spectroscopy of dirac surface state in Bi2Se3,” Phys. Rev. B 105, 081305 (2010).
- Okada et al. (2011) Yoshinori Okada, Chetan Dhital, Wenwen Zhou, Erik D Huemiller, Hsin Lin, S Basak, A Bansil, Y Huang, H Ding, Z Wang, Stephen D Wilson, and V Madhavan, “Direct observation of broken time-reversal symmetry on the surface of a magnetically doped topological insulator,” Phys. Rev. Lett. 106, 206805 (2011).
- Cheng et al. (2010) Peng Cheng, Canli Song, Tong Zhang, Yanyi Zhang, Yilin Wang, Jin-feng Jia, Jing Wang, Yayu Wang, Bang-fen Zhu, Xi Chen, Xucun Ma, Ke He, Lili Wang, Xi Dai, Zhong Fang, Xincheng Xie, and Xiao-liang Qi, “Landau quantization of topological surface states in Bi2Se3,” Phys. Rev. Lett. 105, 076801 (2010).
- Jiang et al. (2012) Yeping Jiang, Yilin Wang, Mu Chen, Zhi Li, Canli Song, Ke He, Lili Wang, Xi Chen, Xucun Ma, and Qi Kun Xue, “Landau quantization and the thickness limit of topological insulator thin films of Sb2Te3,” Phys. Rev. Lett. 108, 016401 (2012).
- Niu et al. (2015) Pengbin Niu, Yun-Long Shi, Zhu Sun, Yi-Hang Nie, and Hong-Gang Luo, “Kondo peak splitting and kondo dip induced by a local moment,” Sci. Rep. 5, 18021 (2015).
- Liu et al. (2013) Liwei Liu, Yuhang Jiang, Boqun Song, Kai Yang, Wende Xiao, Shixuan Du, Min Ouyang, Werner A Hofer, Antonio H Castro Neto, and Hong-jun Gao, “Spatial Imaging of Landé g Factor through Extended Kondo Effect in a Single Magnetic Molecule,” (2013), arXiv:arXiv:1310.8436 .
- Tersoff and Hamann (1983) J Tersoff and Dr Hamann, “Theory and application for the scanning tunneling microscope,” Phys. Rev. Lett. 50, 1998–2001 (1983).
I acknowledgements
Acknowledgements.
This work is supported by the National Science Foundation under Grant No. DMR-1410480, and the Canada Excellence Research Chair program. J.E.H. acknowledges support from the Canadian Institute for Advanced Research.Supplementary Materials
II Section 1
Spatially Quantized Resonances in Zero-Field spectra

As demonstrated in Fig. S1(b), the energy difference between the peaks in the spectra in Fig. S1(a) is quite constant on the B1 and B2 terraces, given that the sampling rate in Fig. S1(a) is 2 meV per energy point and the lock-in amplitude is 5 meV. The average is roughly inversely proportional to the width of the step as expected from Seo et al. (2010) where similar peaks were observed and explained by quantized resonances arising from boundary conditions on finite terraces of Sb(111).
On the abnormal steps B1 and B2, the amplitude of the ZBCP is much larger than the the peaks from spatially quantized resonances. Similar enhanced peak at zero energy was not seen in Seo et al. (2010). Also, we attempted to plot the expected positions of wiggling peaks in the part of the curve around the ZBCP by the grey vertical line in Fig. S1(a). It can been seen that the ZBCP is deviated from the expected position of the wiggling peak, especially on the terrace B2. These are suggesting that the ZBCP is not from the quantum resonance of the steps.
III Section 2
Justification of Having No Crystal Structure Change on the Abnormal Surface

Sb in its usual A7 crystal structure has been shown to superconduct under high pressure of 85 kbar with a critical temperature of K Wittig (1969). All data shown in this work was acquired at higher temperatures between 4.5 and 5.4 K (except for one spectrum acquired at T and K in Fig. 3(d)), so the high-pressure A7 superconducting state is not relevant to our work. But superconductivity has also been demonstrated up to K in a metastable A1 state that can be stabilized by epitaxial strain in Sb films on MnO Reale (1978).
The distance between atoms on the usual Sb(111) surface of the A7 structure is 4.301 at K Liu and Allen (1995). In the metastable state of Sb of FCC structure with critical temperature above 7K suggested by Reale Reale (1978), the distance between atoms in hexagonal pattern on the (111) surface would become about 3.32 Å, around 25 smaller than the usual distance. This would give us a set of Bragg peak in the fourier space with 1/3 larger magnitude corresponding to that shortened atomic distance.
However, as we demonstrated in Fig. S2, when we Fourier transform the normal and abnormal surfaces respectively, if the abnormal surface had a different lattice constant as the normal surface, we would expect hexagonal Bragg peaks in the Fourier space of the abnormal surface are at momentum about 1/3 larger than the momentum of the Bragg peaks on the normal surface. However, as apparent in the comparison between Fig. S2(d) and (e), the hexagonal Bragg peaks on the normal and abnormal surfaces are at similar momentum. This show that there is no crystal structure change on the abnormal surface and thus there would not be potential for the abnormal surface to be superconducting at our operating temperature. In this way, we can verify that there is no superconductivity involved in the ZBCP on the abnormal terrace.
IV Section 3
Relaxed Energy of Sb slabs of 47 total layers with a single broken layer at different bilayer below the surface (different depths)
V Section 4
Band Structure from DFT with different slab thickness and depth of the single broken layer