2 Leibniz-Institut für Astrophysik Potsdam (AIP), An der Sternwarte 16, 14482 Potsdam, Germany
3 Astronomical Institute of the Academy of Sciences, Fričova 298, 25165 Ondřejov, Czech Republic
11email: mbenko@ta3.sk
Properties of the inner penumbral boundary and temporal evolution of a decaying sunspot
Abstract
Context. It was empirically determined that the umbra-penumbra boundaries of stable sunspots are characterized by a constant value of the vertical magnetic field.
Aims. We analyzed the evolution of the photospheric magnetic field properties of a decaying sunspot belonging to NOAA 11277 between August 28 - September 3, 2011. The observations were acquired with the spectropolarimeter on-board of the Hinode satellite. We aim to proof the validity of the constant vertical magnetic-field boundary between the umbra and penumbra in decaying sunspots.
Methods. A spectral-line inversion technique was used to infer the magnetic field vector from the full-Stokes profiles. In total, eight maps were inverted and the variation of the magnetic properties in time were quantified using linear or quadratic fits.
Results. We found a linear decay of the umbral vertical magnetic field, magnetic flux, and area. The penumbra showed a linear increase of the vertical magnetic field and a sharp decay of the magnetic flux. In addition, the penumbral area quadratically decayed. The vertical component of the magnetic field is weaker on the umbra-penumbra boundary of the studied decaying sunspot compared to stable sunspots. Its value seem to be steadily decreasing during the decay phase. Moreover, at any time of the shown sunspot decay, the inner penumbra boundary does not match with a constant value of the vertical magnetic field, contrary to what was seen in stable sunspots.
Conclusions. During the decaying phase of the studied sunspot, the umbra does not have a sufficiently strong vertical component of the magnetic field and is thus unstable and prone to be disintegrated by convection or magnetic diffusion. No constant value of the vertical magnetic field was found for the inner penumbral boundary.
Key Words.:
Sun: photosphere – Sun: activity – Methods: observational – Methods: data analysis – Techniques: high angular resolution1 Introduction
Active regions (AR) are manifestations of large-scale magnetic fields in the solar atmosphere. The largest magnetic structures in ARs are sunspots. They are the longest-known manifestation of solar activity. Moreover, sunspots are usually long-lasting, existing from a few days up to several months (Pettit, 1951). Sunspots are dark features with a strong magnetic field (Hale, 1908). A large number of analyses described the global properties of the magnetic field in sunspots, for an overview see the reviews by Solanki (2003) and Borrero & Ichimoto (2011).
Each sunspot is characterized by a dark core, the umbra, and a filamentary penumbra that is surrounding the dark core. The presence of a penumbra distinguishes sunspots from pores. The magnetic field of the umbra is stronger and more vertical than in the penumbra. There is a sharp intensity boundary between the umbra and penumbra of a sunspot. As shown by Jurčák et al. (2018), the intensity threshold of 50% of the quiet-Sun intensity in the visible continuum can be used to define the umbral boundary.
To understand the physics of sunspots, one has to study their temporal evolution. Formation and decaying phases play an important role in sunspot evolution. We refer to Martínez Pillet (2002) for a review of decaying sunspot evolution. For a long time, it was only possible to study the decay of the morphological changes of the area of sunspots because of the lack of inversion codes to interpret full-Stokes measurements, although the magnetic flux is the more important parameter. Bumba (1963) found a linear decrease of the area of the sunspot with time. Martinez Pillet et al. (1993) confirmed this linear decay, but obtained a different coefficient. In contrast, Petrovay & van Driel-Gesztelyi (1997) found a parabolic decay with a rate proportional to , where is the area of the spot. Linear decay rates of the areas of 32 sunspots were found by Chapman et al. (2003). Baumann & Solanki (2005) investigated the Greenwich sunspot group record, but they were not able to distinguish between a linear and a quadratic decay law. Hathaway & Choudhary (2008) published an almost constant decay rate of 3.65Hemispheres day-1. Gafeira et al. (2014) studied four sunspots and found an approximately linear decay of the areas similar for umbra and penumbra. In both studies, the decay rates are different for individual spots. Case studies resulting in a linear decrease of the magnetic flux during the decay phase were presented by Deng et al. (2007) and Verma et al. (2016). In the latter publication, the development of the area is non-monotonic. Sheeley et al. (2017) investigated the development of the magnetic flux in 36 sunspots, but not all of them were in the decaying phase. Some spots showed a nearly linear decay, but they found also indications of a bursty decay. In a 100 hour numerical simulation of a mature sunspot, Rempel (2015) found a linear decay of the magnetic flux in the umbra for the last 80 hours. The penumbral magnetic flux remained almost constant during this period.
Jurčák (2011) studied the changes of the magnetic field strength and inclination at the boundaries between the umbra and penumbra (UP). The author found that the vertical component of the magnetic field was constant, although slight changes along the boundary can happen. At the same time, the magnetic field strength and inclination vary significantly along the UP boundary. Jurčák et al. (2015) found that the umbral areas that have vertical magnetic fields lower than the abovementioned constant value are colonized by the penumbra in a forming sunspot. This scenario is a possible mechanism to generate orphan penumbrae (Jurčák et al., 2017) when the whole umbra has lower than the critical value. Jurčák et al. (2018) carried out a statistical analysis of the magnetic field properties of more than 100 stable umbral cores. The authors narrowed down the critical value of the vertical component of the magnetic field on the 50% intensity boundary to be 1867 G and confirmed its invariance. We hereafter call it the Jurčák criterion following the definition introduced by Schmassmann et al. (2018).
In this paper we study the evolution of a sunspot during its decay phase. The observations are described in Sect. 2. The analysis of the data is presented in Sect. 3. The temporal evolution of the physical parameters of the sunspot is discussed in Sect. 4.1. The properties of the UP boundaries in the decaying phase of the sunspot is studied and compared to the constant in stable sunspots (Sect. 4.2). Finally, a discussion and conclusion section are presented in Sect. 5.
2 Observations and data reduction
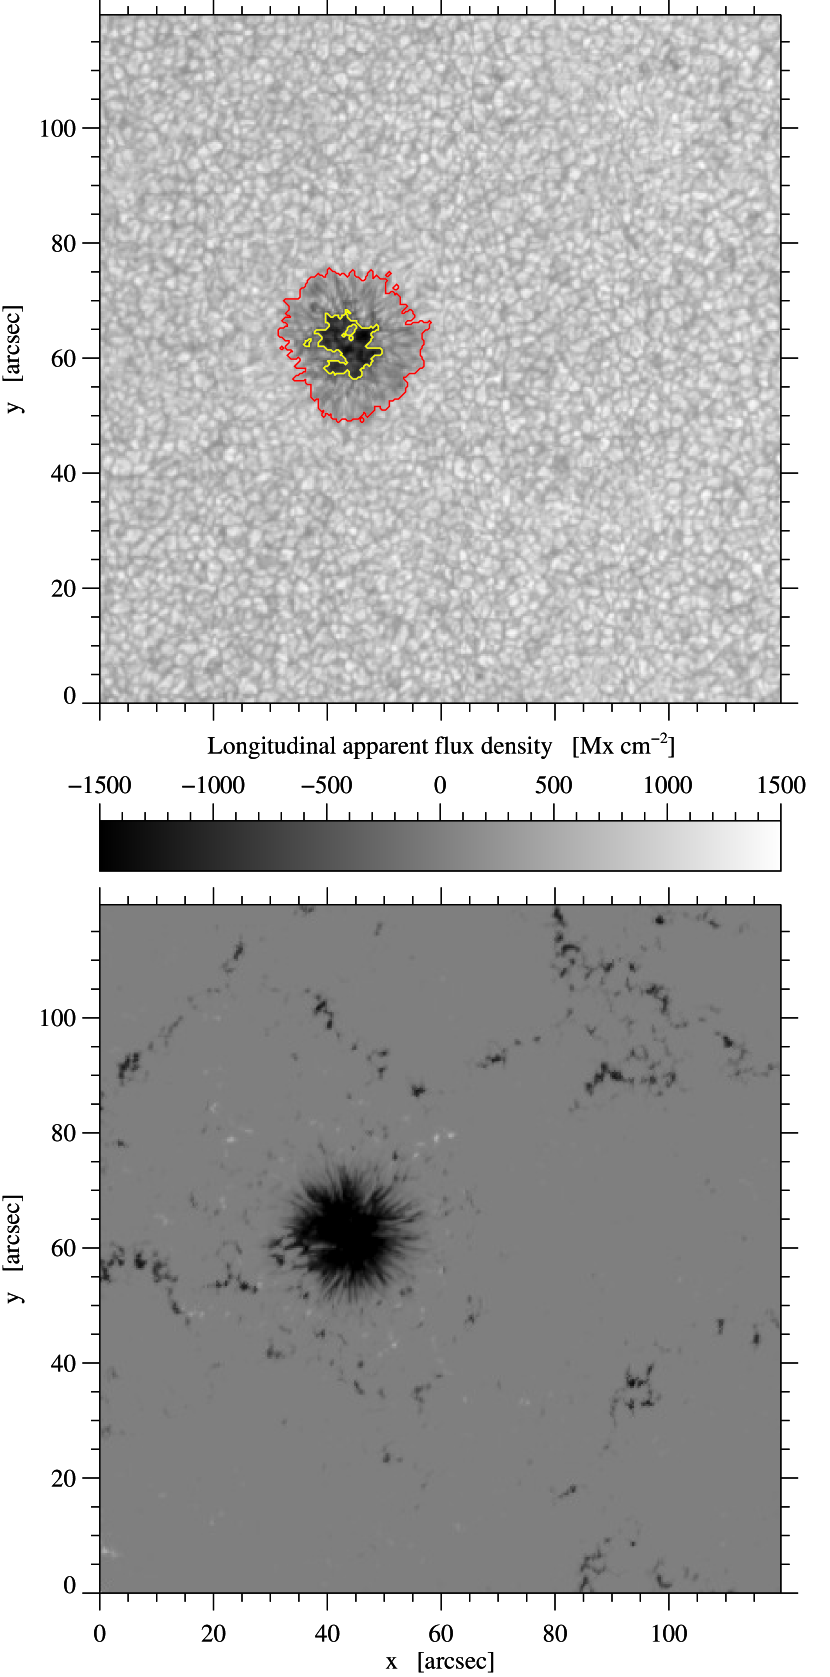
A decaying sunspot with negative polarity in AR NOAA 11277, was observed on the solar disk between August 28 and September 3 on 2011. The observations were acquired with the spectropolarimeter (SP), which is part of the 0.5-meter Solar Optical Telescope (SOT, Ichimoto et al., 2008; Tsuneta et al., 2008; Suematsu et al., 2008), on-board of the Japanese Hinode satellite (Kosugi et al., 2007). The data were observed twice a day during the seven days. The recording time was approximately between 7:30 UT and 8:00 UT for the first observation of the day and between 10:00 UT 10:30 UT for second observation. We analyze eight SP scans taken during these seven days. The active region was located at heliocentric coordinates from (first observing day) to (last observing day). An example of the acquired data is represented in Fig. 1.
The SP instrument consists of a Littrow spectrograph, which measures the full-Stokes parameters of the neutral iron lines at Fe i 6302.5 Å and Fe i 6301.5 Å. The two observed spectral lines are sensitive to the magnetic field. The Landé factors of these spectral lines are and , respectively. They are formed in the higher layers of the photosphere. The Fe i 6302.5 Å line is formed about 60 km lower in the Sun’s atmosphere than the Fe i 6301.5 Å line (Faurobert et al., 2009). For the present analysis, only the photospheric Fe i 6302.5 Å line is used because it is more sensitive to the magnetic field. The purpose of inverting just one line is to save computing time. We tested that the results are nearly identical if both lines are inverted.
The region of interest covers a maximum area of (the width of the scan varied from day to day with a maximum difference of around 8″, the height of the scan is determined by the SP slit), with a spatial scan consisting of 400 steps with a spacing of . The spatial sampling on the solar surface is of 220 km pixel-1. In this study we only concentrate in a smaller FOV centered on the sunspot.
The data were downloaded from the Community Spectro-polarimetric Analysis Center (CSAC) 111http://mlso.hao.ucar.edu/CSAC/sp_data.php in a pre-processed ”level 1” format. The data were already calibrated and ready for scientific purposes.
Only one map per day is analyzed because the changes in the sunspot within a few hours are small. We make an exception for 2011 September 2, where the morphological changes between both maps become evident within 2.5 hours. We use also the second map of this day.
3 Data analysis
The Stokes parameters are inverted using the Stokes Inversion based on Response functions (SIR, Ruiz Cobo & del Toro Iniesta, 2012). The code delivers physical parameters such as the magnetic field vector, the temperature, and the Doppler velocity among others. The analyzed spectral line is formed in a narrow height range above the surface of the Sun. Therefore, the potential height gradients of the individual parameters obtained from the inversion are not relevant for the present investigation, and we do not take them into consideration for the further analysis. Thus, we restrict the inversions to one node for the Doppler velocity, magnetic field strength, inclination and azimuth, keeping these values height-independent. Only the temperature is height-dependent with three nodes. We assume a single atmospheric component.
We assume that there is a single azimuth center in the sunspot to solve the 180-degree ambiguity (see, Balthasar et al., 2013). Such an azimuth center has a radial magnetic field configuration, and the observed azimuth values for each pixel differ by less than 90∘ from the radial configuration. The last step is to transform the coordinate system of the magnetic field to the local reference frame and to correct the geometrical foreshortening of the observations taken at different position angles applying a method described by (Verma et al., 2012).
4 Results
4.1 Temporal evolution of area, vertical magnetic field, magnetic flux, and inclination

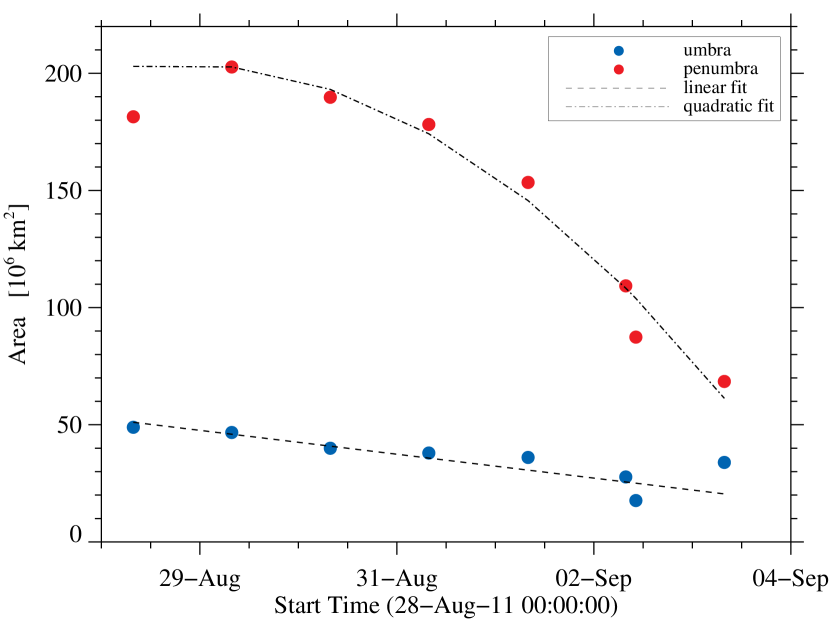
The temporal evolution of the areas of umbra and penumbra is displayed in Fig. 2. The area of the umbra is determined using the UP boundaries at intensity level , where is the average quiet-Sun intensity of the local continuum. The outer penumbra boundary, necessary to identify the penumbral area, is determined by the horizontal magnetic field at B (as an example see the contours in Fig. 1). With this magnetic criterion, we obtain a better contour of the outer penumbral boundary than with any intensity criterion. The magnetic pressure of such a horizontal field would counterbalance the dynamic pressure of rising convective elements between 2 and 4 km s-1, depending on the density of matter in the atmosphere outside the magnetic field and the Wilson depression of the outer penumbra, see also Wiehr (1996).
We apply linear and quadratic fits to the data, but we show the quadratic fit only when there is a clear curvature. On September 3, obviously new umbral flux raised (see also Fig. 4), therefore we omit this day from the fits for the umbra. On August 28, the penumbral area was smaller than on August 29, probably the penumbra was still in the growing phase on this day, and thus we omit this day from the fits which should represent the decay phase. The same days for umbra and penumbra are excluded from the fits in Figs. 3, 4, and 5.
The umbral area decreases linearly during the period of observation. For the penumbra we see an accelerated decay, and a parabola fit yields a better representation. The penumbra has an area of at the beginning of the observations. Then the area decreases to a value of on September 3. The umbra has a value of at the beginning of the observations and at the end of observation.
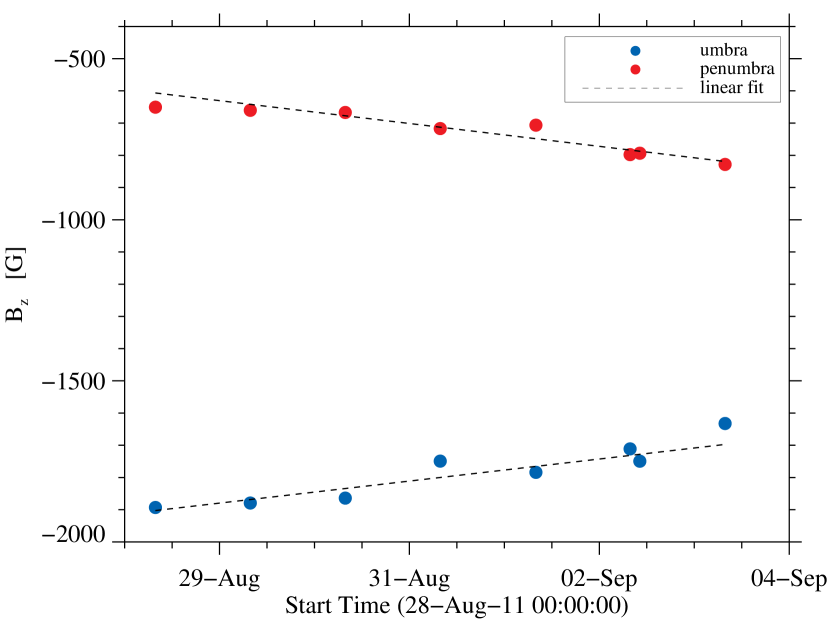
Fig. 3 shows the temporal evolution of the vertical component of the magnetic field for umbra and penumbra. The absolute umbral value decreases from 1900 G on August 28 to 1600 G on September 02 (keep in mind that the polarity of the spot is negative). As for the area, there is no significant deviation from a linear decay. The penumbra has a value of 650 G at the beginning. This value increases with time, and is 830 G on September 3. This increase is probably due to a decay of the penumbra beginning at the outer parts with the consequence that the remaining mean magnetic field is more vertical.
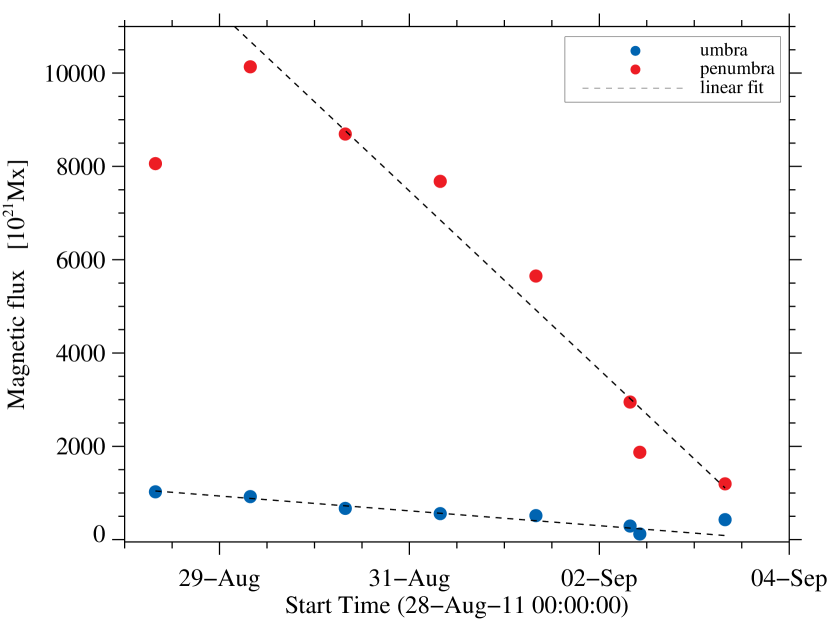
The temporal evolution of the total magnetic flux of umbra and penumbra is displayed in Fig. 4. For both, umbra and penumbra, linear fits represent the data quite well. The penumbra starts with a value of Mx at the beginning of the observations and the flux decreases with time to Mx on September 03. The umbra has a value of Mx at the beginning and Mx at the end of the observations.
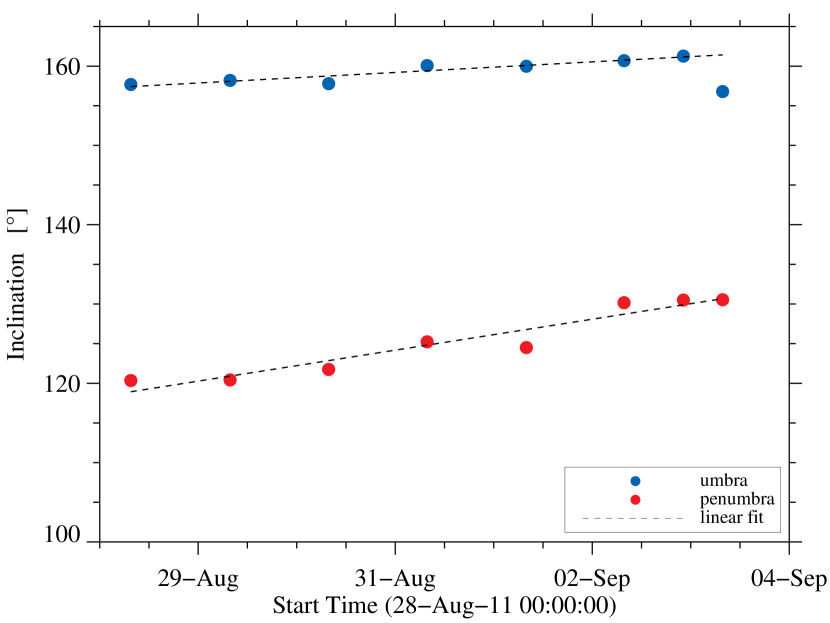
The temporal evolution of the magnetic flied inclination is represented in Fig. 5. For the umbra the magnetic field inclination is not changing significantly during the sunspots decay phase. Contrarily, the inclination values for the penumbra linearly increase from around 120∘ to 130∘. This means that the magnetic field lines become more vertical in the penumbra during the decay of the sunspot.
4.2 at the umbral boundary
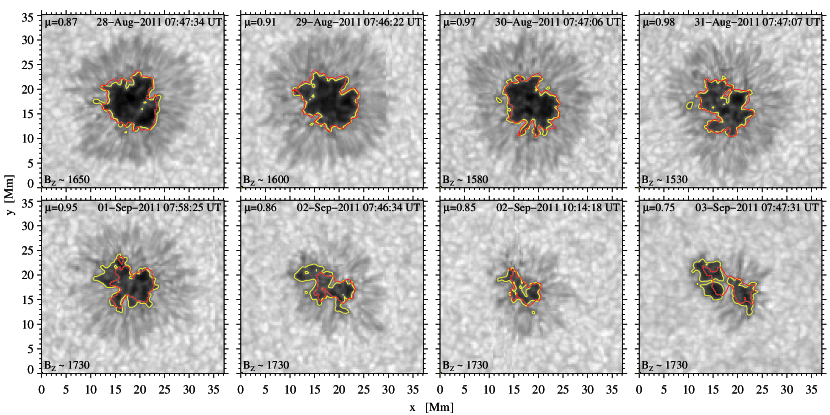
Jurčák’s criterion implies that at stable umbral boundaries, the intensity contours of and of G (in case of Hinode data) should coincide. In Fig. 6, we show these intensity and contours for the eight analyzed SP scans of the decaying sunspot. Obviously, the contours do not spatially coincide with the intensity contour and the Jurčák criterion is not valid for the analyzed decaying sunspot.
The displacement of the green and yellow contours in Fig. 6 is increasing in time, i.e., the umbral area with G is increasing during the decay phase. These umbral regions are thus prone to be transformed into penumbra, light bridge, or granulation and the umbra is consecutively getting smaller as shown in Fig. 2. Interestingly, during the first two/three days of the observations, the boundaries are not too far off from the umbral boundary and the contours are matching well in certain segments of the umbral boundaries. The intensity images show a rather stable sunspot during these first days, the decay phase just started, and this is a possible reason for the observed partial match of the and intensity boundaries.
We also check if any different value can be found to match the umbral boundary during the decay phase. In Fig. 7, we show the best matches of intensity and contours resulting from this analysis. In the first four days, we were able to identify values that roughly coincide with the intensity boundaries of the umbra. The vertical component of the magnetic field at the umbral boundary of the decaying sunspot is progressively decreasing during these four days. In the later phases of the decay, there is no unique value corresponding to the intensity boundary of the umbra. Interestingly, the value matching at least partially the intensity boundary is higher than during the first days of the sunspot decay. In this study, we cannot clarify if the found values are of any significance or if they are a unique property of the studied sunspot.
5 Discussion and conclusions
In contrast to previous statistical investigations (Bumba, 1963; Martinez Pillet et al., 1993; Petrovay & van Driel-Gesztelyi, 1997), we observed only a single sunspot, but under constant conditions for all observing days. For the mean, sign-independent vertical component of the magnetic field, we find a linear decrease in the umbra and an almost linear increase in the penumbra. We explain this increase by a less inclined mean magnetic field of the penumbra (c.f., Fig. 5) when the decay sets in at the outer boundary and the outer, more horizontal magnetic field disappears first. Bellot Rubio et al. (2008) and Watanabe et al. (2014) suggested that the penumbral fields become more vertical during a sunspot decay. For the area of the penumbra we find an accelerated decay where the quadratic coefficient is negative indicating a negative curvature. On the contrary, a positive curvature was found by Petrovay & van Driel-Gesztelyi (1997). Towards the end, the decay does not show a significant deviation from a linear behavior. Although the umbral area is already reduced from the first to the second day of our observations, the total area is still growing. At the end of our observations, obviously new magnetic flux emerged and enlarged the umbral area again (see the last panel of Fig. 6). By solving a diffusion equation with constant magnetic eddy diffusivity (Meyer et al., 1974), Stix (2002, p.352) explained a linear decay of the magnetic flux, but in such models the decay curve of the umbral area is always convex as its second derivative is negative, (Krause & Rüdiger, 1975). A linear decay of area and magnetic flux can be obtained by inclusion of a weak magnetic quenching of the diffusivity by the (decaying) magnetic field (Rüdiger & Kitchatinov, 2000). This option is in agreement with our results for the umbra, however, for the penumbra we see a convex decay of the area.
During the decay phase of the studied sunspot, the Jurčák criterion is not fulfilled at the UP boundary. Thus, the criterion is not valid for the decaying sunspot under study. This finding can be used to check if a spot already entered its decay phase even if it still appears morphological regular. Furthermore, we could not find any other constant value of the vertical magnetic field that would represent the UP boundary in decaying sunspot.
We conclude that during the decaying phase of the sunspot, its magnetic field is getting weaker and consequently more vertical. The decrease of its vertical magnetic field is in the studied case faster than the time scale for the mode transition of the magnetoconvection. Thus, in this decaying sunspot, umbral regions with G exist and are temporarily not occupied by penumbra or granulation. After some time, the penumbra or granulation protrude deeper into these umbral regions Consequently, the umbra gets smaller with time during the decay phase.
Acknowledgements.
We express our thanks to Prof. Dr. Günther Rüdiger for helpful discussions and his comments to improve the manuscript. This work was supported by the project VEGA 2/0004/16. Hinode is a Japanese mission developed and launched by ISAS/JAXA, with NAOJ as domestic partner and NASA and STFC (UK) as international partners. It is operated by these agencies in cooperation with ESA and NSC (Norway). This article was created by the realisation of the project ITMS No. 26220120029, based on the supporting operational Research and development program financed from the European Regional Development Fund.References
- Balthasar et al. (2013) Balthasar, H., Beck, C., Gömöry, P., et al. 2013, Central European Astrophysical Bulletin, 37, 435
- Baumann & Solanki (2005) Baumann, I. & Solanki, S. K. 2005, A&A, 443, 1061
- Bellot Rubio et al. (2008) Bellot Rubio, L. R., Tritschler, A., & Martínez Pillet, V. 2008, ApJ, 676, 698
- Borrero & Ichimoto (2011) Borrero, J. M. & Ichimoto, K. 2011, Living Reviews in Solar Physics, 8, 4
- Bumba (1963) Bumba, V. 1963, Bulletin of the Astronomical Institutes of Czechoslovakia, 14, 91
- Chapman et al. (2003) Chapman, G. A., Dobias, J. J., Preminger, D. G., & Walton, S. R. 2003, Geochim. Res. Lett., 30, 1178
- Deng et al. (2007) Deng, N., Choudhary, D. P., Tritschler, A., et al. 2007, ApJ, 671, 1013
- Faurobert et al. (2009) Faurobert, M., Aime, C., Périni, C., et al. 2009, A&A, 507, L29
- Gafeira et al. (2014) Gafeira, R., Fonte, C. C., Pais, M. A., & Fernandes, J. 2014, Sol. Phys., 289, 1531
- Hale (1908) Hale, G. E. 1908, ApJ, 28, 315
- Hathaway & Choudhary (2008) Hathaway, D. H. & Choudhary, D. P. 2008, Sol. Phys., 250, 269
- Ichimoto et al. (2008) Ichimoto, K., Lites, B., Elmore, D., et al. 2008, Sol. Phys., 249, 233
- Jurčák (2011) Jurčák, J. 2011, A&A, 531, A118
- Jurčák et al. (2015) Jurčák, J., Bello González, N., Schlichenmaier, R., & Rezaei, R. 2015, A&A, 580, L1
- Jurčák et al. (2017) Jurčák, J., Bello González, N., Schlichenmaier, R., & Rezaei, R. 2017, A&A, 597, A60
- Jurčák et al. (2018) Jurčák, J., Rezaei, R., González, N. B., Schlichenmaier, R., & Vomlel, J. 2018, A&A, 611, L4
- Kosugi et al. (2007) Kosugi, T., Matsuzaki, K., Sakao, T., et al. 2007, Sol. Phys., 243, 3
- Krause & Rüdiger (1975) Krause, F. & Rüdiger, G. 1975, Sol. Phys., 42, 107
- Martínez Pillet (2002) Martínez Pillet, V. 2002, Astronomische Nachrichten, 323, 342
- Martinez Pillet et al. (1993) Martinez Pillet, V., Moreno-Insertis, F., & Vazquez, M. 1993, A&A, 274, 521
- Meyer et al. (1974) Meyer, F., Schmidt, H. U., Weiss, N. O., & Wilson, P. R. 1974, MNRAS, 169, 35
- Petrovay & van Driel-Gesztelyi (1997) Petrovay, K. & van Driel-Gesztelyi, L. 1997, Sol. Phys., 176, 249
- Pettit (1951) Pettit, E. 1951, Leaflet of the Astronomical Society of the Pacific, 6, 146
- Rempel (2015) Rempel, M. 2015, ApJ, 814, 125
- Rüdiger & Kitchatinov (2000) Rüdiger, G. & Kitchatinov, L. L. 2000, Astronomische Nachrichten, 321, 75
- Ruiz Cobo & del Toro Iniesta (2012) Ruiz Cobo, B. & del Toro Iniesta, J. C. 2012, SIR: Stokes Inversion based on Response functions, Astrophysics Source Code Library
- Schmassmann et al. (2018) Schmassmann, M., Schlichenmaier, R., & Bello González, N. 2018, ArXiv e-prints [arXiv:1810.09358]
- Sheeley et al. (2017) Sheeley, Jr., N. R., Stauffer, J. R., Thomassie, J. C., & Warren, H. P. 2017, ApJ, 836, 144
- Solanki (2003) Solanki, S. K. 2003, A&A Rev., 11, 153
- Stix (2002) Stix, M. 2002, The sun: an introduction – 2nd ed. (Springer Verlag Berlin Heidelberg New York)
- Suematsu et al. (2008) Suematsu, Y., Tsuneta, S., Ichimoto, K., et al. 2008, Sol. Phys., 249, 197
- Tsuneta et al. (2008) Tsuneta, S., Ichimoto, K., Katsukawa, Y., et al. 2008, Sol. Phys., 249, 167
- Verma et al. (2012) Verma, M., Balthasar, H., Deng, N., et al. 2012, A&A, 538, A109
- Verma et al. (2016) Verma, M., Denker, C., Balthasar, H., et al. 2016, A&A, 596, A3
- Watanabe et al. (2014) Watanabe, H., Kitai, R., & Otsuji, K. 2014, ApJ, 796, 77
- Wiehr (1996) Wiehr, E. 1996, A&A, 309, L4