Signatures of Intra-binary shock emission in the black widow pulsar binary PSR J22415236
Abstract
We report on high-energy properties of the black widow pulsar PSR J22415236 in the X-ray and the Fermi-LAT (GeV gamma-ray) bands. In the LAT band, the phase-averaged gamma-ray light curve shows orbital modulation below 1 GeV with a chance probability () monotonically decreasing with time to . The peak of the light curve is near the superior conjunction of the pulsar (binary phase ). We attribute the modulation to the intra-binary shock (IBS) emission and search for IBS signatures in the archival X-ray data. We find that the X-ray spectral fit requires a non-thermal component, which implies a possible IBS origin of the X-rays. We discuss our observations in the context of IBS scenarios.
Subject headings:
binaries: close — gamma rays: stars — X-rays: binaries — stars: individual (PSR J22415236)1. Introduction
Many millisecond pulsars (MSPs) have been discovered by Fermi (LAT; Atwood et al., 2009), especially so-called spider binaries where the pulsar spin-down power is heating and evaporating the companion. At present, in the Galactic disk these discoveries include 15 ‘redback’ (RB) systems with stellar-mass companions, and 20 ‘black widow/tidarren’ (BW) systems with sub-stellar companion masses; similar spider binaries are found in the globular clusters.111https://apatruno.wordpress.com/about/millisecond-pulsar-catalogue/ The gamma-ray emission from these binaries is dominated by (Abdo et al., 2013) pulsed emission from the MSP magnetosphere, which is independent of orbital phase.
In the X-ray band the sources are less luminous with , and a hard spectrum (Roberts et al., 2015); the broad 0.3–79 keV X-ray emission is largely unpulsed and often modulated with binary phase (e.g. Arumugasamy et al., 2015), especially in the RB. This unpulsed emission is believed to be produced by an intra-binary shock (IBS) between winds from the pulsar and the heated companion. The shocked pulsar wind develops a mildly relativistic flow in a shell surrounding the source with lower wind momentum flux, so that the shock synchrotron and inverse Compton radiation is beamed. When viewed at moderate to high orbital inclination this beaming produces orbital modulation (Romani & Sanchez, 2016; An & Romani, 2017; Wadiasingh et al., 2017). One sees a double peak (e.g., PSR J21290429, PSR J2215+5135; Roberts et al., 2015; Gentile et al., 2014), or a broad hump as the line of sight cuts through or grazes the cone of IBS emission. In the gamma-ray band only a few systems seem to show orbital modulation and these are the lower-mass BW sources (e.g., PSR J1959+2048, PSR J13113430; Wu et al., 2012; Xing & Wang, 2015; An et al., 2017). In these sources, gamma-ray IBS emission is believed to be produced by synchrotron and/or inverse-Compton processes (e.g., Bednarek, 2014). The emission competes with the strongly dominant pulsed gamma rays and so detections are challenging. Improved measurements and additional examples are needed to probe the origin of this orbital modulation.
Here, we report on the high-energy variability of the BW system PSR J22415236. The nearby (-estimated distance of 0.5 kpc) 2.2-ms pulsar is in a 3.5-h orbit with a 0.012M⊙ companion (Keith et al., 2011). With its short spin and orbital periods and the proximity, this source is of special interest. We have thus used Fermi Large Area Telescope (LAT) and archival X-ray observations in order to search for high-energy orbital variability and probe its IBS.
2. Observational Data and Analysis
2.1. Fermi-LAT data
PSR J22415236 (J2241 hereafter) is bright in gamma rays, and the pulsations are easily detected (Keith et al., 2011). Although no orbital modulation was reported in that work, with 9-yr LAT exposure and Pass 8 reprocessing (Atwood et al., 2013) we can now make a sensitive measurement of the orbital light curve. We downloaded the Pass 8 data from the Fermi Science Support Center collected between 2008 August 04 and 2017 Aug. 10 with an aperture in the 60 MeV–500 GeV energy band. We further selected Source class events with Front/Back event type using zenith angles , and analyzed the data with the Fermi-LAT Science Tools v10r0p5 along with P8R2_V6 instrument response functions.222https://fermi.gsfc.nasa.gov/ssc
Optimal extraction of the source photons uses energy-dependent probability
weights. To obtain these we first measure the source spectrum, using a
binned likelihood analysis in the 100 MeV–300 GeV band (35 energy bins), including
corrections for energy dispersion333https://fermi.gsfc.nasa.gov/ssc/data/analysis/documentation/
Pass8_edisp_usage.html
using the Python packages provided with the Fermi Science tools.
We used the 3FGL models (Acero et al., 2015) in which J2241 emission
is modeled with a power-law-exponential-cutoff model (PLEXP, preferred over a simple power-law model),
, where
is held fixed at 1; if is free, the result is consistent with 1 and the fit
does not improve.
In the fit, we vary parameters for bright sources (5) in the aperture and the normalizations of the diffuse emission models (gll_iem_v06.fits and iso_P8R2_SOURCE_V6_v06.txt; Acero et al., 2016; Ackermann et al., 2015). Because the best-fit parameters of J2241 can depend on the background from these sources, we ran tests varying the size of the region of interest (RoI; and ) and allowing various numbers of sources within the RoI to adjust their parameters from the assumed 3FGL values. In all cases the J2241 parameters were consistent with those of the original fit and a scatter an order of magnitude smaller than the statistical errors. The best-fit parameters for J2241 are , GeV, with 100 MeV–300 GeV flux of . Here the first error range is statistical and the second is the dominant systematic error associated with uncertainty in the Galactic diffuse background model and in the LAT effective area. The 100 MeV–300 GeV energy flux is , and the isotropic gamma-ray luminosity for an assumed distance of 0.5 kpc is . These parameters are consistent with previous LAT spectral analyses (Abdo et al., 2013; Acero et al., 2015).
Because IBS emission is commonly modeled with a power law different from the pulsar model, we check to see if there is evidence for IBS emission in the gamma-ray spectrum. We fit the LAT spectrum with the addition of a power-law (IBS) component. A power-law component is detected with the test statistic () of with changes in the above PLEXP parameters, and the fit improves when including the power-law model (). However, this could be due to the gamma-ray source in the 3FHL catalog at angular distance 0.2∘ (3FHL J2240.35240; Ajello et al., 2017); adding this source to our fits makes an additional IBS PL component statistically unnecessary. Below we use PLEXP as our baseline model (no PL). Including IBS PL emission does not change our conclusions on orbital modulation significantly.
 |
 |
We have re-examined the pulsar timing solution over the 9-yr LAT data set.
We start from the existing timing solution444http://www.slac.stanford.edu/ kerrm/fermi_pulsar_timing/J22
41-5236/html/J2241-5236_54683_56587_chol.par
and folded the events using tempo2. Here, we weight each event with the probability of the
event originating from J2241. The probability weight (Kerr, 2011) is calculated using gtsrcprob
of the LAT Science Tools which uses the energy spectrum measured above and the position of the event.
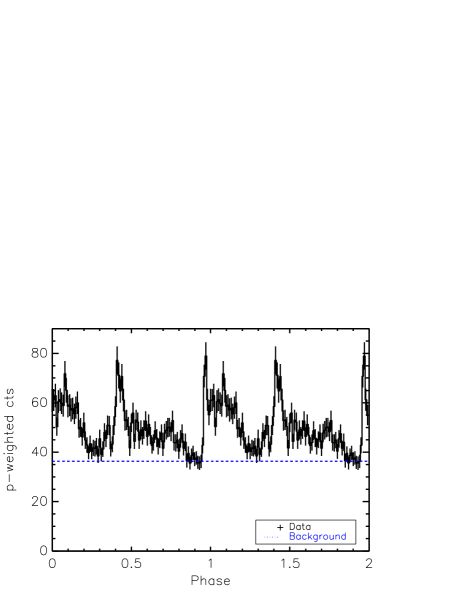
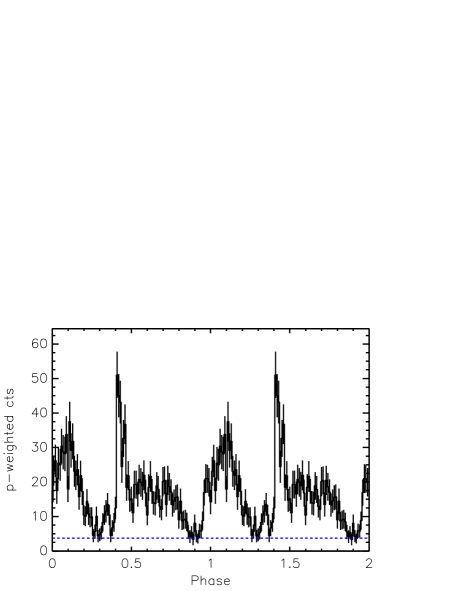
Source pulsations are clearly detected and the profile is similar to the
previous one (Keith et al., 2011). We, however, notice that the pulse phase drifts slightly
at late times (), and so we derive an improved timing solution.
We created a spin ephemeris spanning the length of our data set by maximizing the unbinned likelihood , with an analytic model of the pulse shape and the phase assigned at time by the timing model with parameters . We evaluated using the PINT software package555https://github.com/nanograv/PINT (Luo et al., 2018), and found that optimizing , , the position and proper motion, , , and were sufficient to produce a sharp pulse profile over the full interval. The best-fit parameters and their 1- confidence intervals from the posterior distribution are reported in Table 1, and the resulting pulse profiles appear in Figure 1.
| RA (, J2000) | (15) |
|---|---|
| DEC (, J2000) | (25) |
| Epoch (MJD) | 55044.15587 |
| (s-1) | 457.31015684738(2) |
| (s-2) | 1.4423(2) |
| TZRMJD | 56547.72358340209 |
| Binary model | BTaafootnotemark: |
| (day) | 0.1456722372(3) |
| (-) | 0.025791(3) |
| 0 | |
| 55044.157905(4) | |
| PMRA (, mas ) | 19.4(4) |
| PMDEC (, mas ) | 6.1(5) |
Notes. 1 uncertainties are shown in brackets, and parameters without
the uncertainty are held fixed.
aSee Edwards et al. (2006) for the timing model definition.
 |
 |
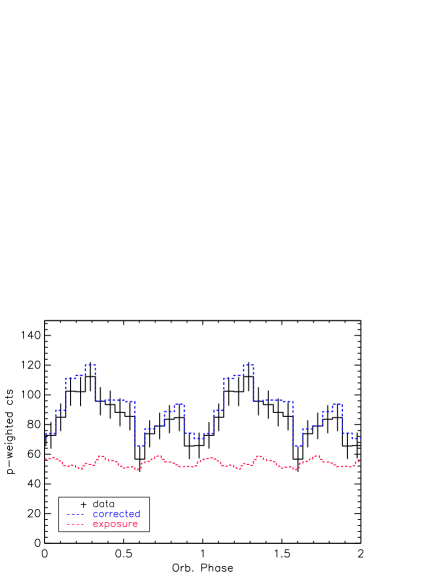
Next, we investigate orbital variability in the gamma-ray band. Motivated by our study of the pulsar PSR J13113430, we constructed light curves by probability-weighted aperture photometry () in low- and high-energy bands as well as the full 0.06–500 GeV band using all spin phases. We find that the low-energy (0.06–1 GeV) light curve shows significant orbital modulation with a probability of constant signal using the test ( for three harmonics summed, Figure 2 left; de Jager et al., 1989; Kerr, 2011) while the high-energy light curve does not. The results are not very sensitive to energy cuts, although for the lowest energy photons ( MeV) the constant probability is as low as . As expected for a real signal, the cumulative-time test (e.g., An et al., 2017) for the GeV band shows a monotonic decrease of the null hypothesis probability, reaching (Fig. 2 right). The full band data also show growing significance, but the probability reaches only . The high-energy band shows no significant modulation ().
Note that the peak of the orbital light curve is near pulsar superior conjunction () and another smaller one is near . In order to see if the smaller peak is statistically required, we fit the light curve with a single or a double Gaussian function and perform an -test. We find that the double Gaussian fit is not better than the single Gaussian fit with -test probability .
We checked the phase-dependent exposure variation in our data set. This is shown by the red dashed line in Figure 2 left. This does not contribute to the low-energy orbital signal as the amplitude is small (3%) and does not align with the observed modulation. Correcting for this small exposure variation gives the blue light curve. Simulated exposures following this red curve were also used to compute variability induced by the statistic. For this ‘systematic’ error estimate we again find a similar significance () for our measured .
The bright, highly variable, blazar 3FGL J2329.34955 (a.k.a, PKS 2326502)
lies 8∘ from J2241. Although probability weighting decreases its
contribution to the J2241 signal, one might worry that its substantial
LAT flaring activity
(e.g., D’Ammando, 2010)666https://fermi.gsfc.nasa.gov/ssc/data/access/lat/msl_lc/source
/PS_2326-502
might induce modulation to the J2241 light curve. We checked this by folding
the photons from the nearby sources 3FGL J2235.34835 and 3FGL J2207.85345
on J2241’s orbital period. No significant modulation is seen, so the blazar
contribution is insignificant, and we conclude that the J2241 orbital modulation is intrinsic.
As the orbital modulation seems to be real, we check to see if the spectrum also varies orbitally. We first fit the orbital maximum (0–0.6) and minimum (0.6–1) spectra with the 3FGL model. In the fits, we varied the pulsar parameters but held the other parameters fixed at the best values obtained above. We find that the maximum spectrum is softer ( vs. ; ) with larger flux. Note that our systematic uncertainties shift both indices similarly; the difference is largely unaffected. Assuming that the minimum spectrum best represents the orbitally constant pulsar spectrum, we hold the pulsar parameters fixed at the best values for the minimum spectrum, add a power-law (IBS) component to the models, and fit the maximum and minimum spectra. In this case, the minimum spectrum does not require a power-law component () while the maximum spectrum does (). The model with a power-law component (, orbital average) fits the maximum spectrum better (). The results are similar if we let the amplitude of the pulsar component vary in order to mitigate the possibility of pulsar emission varying. This suggests that the orbitally-varying component has a soft power-law spectrum as expected in IBS models.
Although the steady increase in significance suggests that the modulation is not episodic, J2241 itself has a variability index of 61 in the 3FGL catalog (Acero et al., 2015), implying 10% significance for variability on a month time scale. To test this possibility, we performed a likelihood analysis to extract source fluxes in the 0.1–300 GeV band in 1 Ms time bins for J2241 and three variable and bright sources in the aperture (3FGL J2207.85345, 3FGL J2235.34835, 3FGL J2329.34955) while holding the other parameters fixed at the phase-averaged values. We then constructed a long-term light curve with the time bins having . The probability that the J2241 light curve is consistent with a constant is 0.06, not very different from the 3FGL value, implying no significant long-term variability.
2.2. X-ray data and Analysis
Since a number of spider binaries (BWs and RBs), especially the RB systems, show strong orbital modulation in the X-ray band, we examined the 20 ks of archival ACIS data collected on 2009 August 30 with the Chandra observatory. In an earlier analysis of this data set, Keith et al. (2011) modeled the source spectrum with blackbodies, as might be expected from the hot polar cap of the pulsar. However, some BWs and RBs show a power-law spectral component in the X-ray band, indicating emission from the IBS, so a re-examination of the ACIS spectrum seems appropriate.
We extracted counts in a aperture centered at the source position and computed the spectral response files using the specextract tool of CIAO 4.8. The background spectrum was extracted using an annular aperture with and . We then grouped the spectrum to have 1 event per spectral bin and fit the spectrum in the 0.3–10 keV band in XSPEC 12.9.0n using the statistic (Loredo, 1992). The results are shown in Table 2.
| modelaafootnotemark: | bbfootnotemark: | /dof | ||
|---|---|---|---|---|
| (keV) | (keV/) | |||
| BB | 59/64 | |||
| 2BB | 56/62 | |||
| PL | 48/64 | |||
| BB+PL | ccfootnotemark: | ddfootnotemark: | 45/63 |
Notes. is held fixed at .
aBB: blackbody, PL: power law.
b0.5–10 keV flux in units of .
cFrozen.
d Total flux in the 0.5–10 keV band in units of .
The BB flux is in the same units.
In all fits we held the hydrogen column density fixed at , the value used by Keith et al. (2011). Our single and double blackbody fits give temperatures and fluxes consistent with their earlier results. However, we find that a simple power-law model provides a better fit (; Loredo, 1992) corresponding to (3; Akaike, 1974), although the spectral index is relatively soft at . Since other spider binaries with non-thermal X-ray emission have a relatively hard spectrum (e.g., PSR J1959+2048; Huang et al., 2012), we also considered the possibility that the spectrum is composite, with a softer thermal component. Unfortunately, with only 82 events in the source region we cannot fit for multiple spectral parameters, so we fixed the hard power law at a typical , and find a plausible keV for the black body spectral component, accounting for about half the flux. As expected is even less for this composite model (Table 2), but the decrease is insufficient to require an extra component, so we must await deeper X-ray observations to see if the non-thermal emission is required.
We also folded the ACIS counts on our derived orbital ephemeris. After exposure correction, the resulting light curve is flat, with a K-S probability of constancy of 87%. Again deeper X-ray integrations will be needed to probe the spectrum and modulation of this component.
3. Discussion and Conclusions
We have analyzed high-energy data for the BW pulsar J2241 collected with Chandra and Fermi. We find that in the low-energy gamma-ray band the source exhibits orbital modulation peaking near the superior conjunction of the pulsar. Motivated by this temporal signature of IBS in the LAT data, we investigate the gamma-ray spectrum for the IBS power-law emission, and find that there seems to be an underlying power-law emission but the emission could be from a known 3FHL source; no clear signature of IBS is found in the orbital-phase-averaged LAT spectrum of J2241. However, we find that the orbital hump spectrum is softer than the dip spectrum and that a power-law component is detected in the hump when subtracting the dip spectrum. This suggests that a part of the power-law emission may be from the IBS. In the X-ray band we see no strong orbital modulation, although the sensitivity is low due to limited source counts. However, we do find that the X-ray spectral fits are improved if a power-law component is included, suggesting the presence of non-thermal IBS emission that might be probed with a deeper observation.
In pulsar binaries, it is believed that X-rays and low-energy gamma rays are produced by synchrotron emission of shock-accelerated electrons in the IBS. When the pulsar-wind momentum flux dominates that of the companion, the IBS wraps around the secondary (e.g., Romani & Sanchez, 2016; Wadiasingh et al., 2017). Shock-accelerated electrons experience acceleration due to adiabatic expansion as they flow along this surface (Bogovalov et al., 2008), leading to modest bulk Lorentz factors. Thus the IBS emission is beamed along the tangent of the shock. For a pulsar-wind dominated shock we then expect IBS emission centered around phase , at pulsar superior conjunction, as for J2241 (Figure 2 left). With the Earth line of sight tangent to the IBS we would get a single peak; higher inclinations can produce a double peak. Thus our sub-GeV modulation is consistent with a Doppler-boosted emission from an IBS.
There is also a suggestion of a local maximum in Figure 2 (left) at . The significance is very low (-test ), so it is likely just a statistical fluctuation. However, in principle, peaks at both phases can be accommodated if the companion wind strength fluctuates so that the momentum ratio of the pulsar and the companion winds varies about 1. Perhaps for J2241 the typical state has so that the IBS wraps around the companion star (giving a peak at phase 0.25) while occasionally increases to so that the IBS encloses the pulsar and a peak appears at in the time-averaged LAT orbital light curve. If there were other strong evidence for episodic variability, then correlating the LAT light curve with these states could separate the two cases.
Evidence for modulation in the gamma-ray light curve has been claimed in two other pulsar binaries, both with sub-stellar companions (PSR J1959+2048, PSR J13113430; Wu et al., 2012; Xing & Wang, 2015; An et al., 2017). For these, the modulation was strongest at high energies ( GeV), although with limited significance, this trend is not very strong. In contrast for J2241 our best evidence for modulation is seen in the low-energy band. Here we might expect the IBS power-law emission to best stand out from the very hard pulsed emission. Unlike PSR J13113430 we find the strongest modulation signal when we include all spin phases in the analysis. Thus without pulse phase cuts the low-energy spectral cut may help isolate a modulated IBS signal. If IBS emission is dominated by synchrotron, we expect that in the plasma rest frame the spectral peak is below MeV, due to radiation reaction limits. We would then require bulk Doppler boosting to shift the IBS emission into the LAT band (Bogovalov et al., 2008). We can speculate that the bulk Doppler factor is lower for J2241 than the other two sources, leaving the beamed IBS emission with a sub-GeV peak. The synchrotron emission implies an effective index for the electrons contributing to the LAT flux. Then with Doppler boosted modulation (Figure 2) we would infer an IBS bulk (e.g., An & Romani, 2017). Inverse-Compton scattering (ICS) processes may also be important for the higher-energy emission in other sources (e.g., Bednarek, 2014).
It will be especially helpful to measure the J2241 system inclination. IBS emission is most visible at higher inclinations, as for PSR J1959+2048 (; Reynolds et al., 2007) and PSR J13113430 (; Romani et al., 2015). The broad hump of the J2241 -ray peak suggests an intermediate inclination. Keith et al. (2011) do not see evidence of radio eclipses or dispersion delay in this binary, suggesting that the inclination is not very large. Optical imaging and spectroscopy may help to constrain the inclination value (e.g., Romani & Sanchez, 2016; Wadiasingh et al., 2017). Fermi LAT will keep collecting data, and additional X-ray observations can test for IBS emission. While J2241 is too faint to be detected, NuSTAR observations of brighter, hard power-law sources might help connect these two components.
In sum this is the third companion-evaporating spider binary to show evidence for orbital modulation in the -ray band. Interestingly all three have sub-stellar companions and so are of the BW or Tidarren type. The RB systems with stellar mass companions often show strong modulation in the X-ray band. For J2241 such modulation, if present, is much weaker. It will be interesting to examine the rest of the spider population to see if this dichotomy persists and to probe its physical origin.
The Fermi-LAT Collaboration acknowledges support for LAT development, operation and data analysis from NASA and DOE (United States), CEA/Irfu and IN2P3/CNRS (France), ASI and INFN (Italy), MEXT, KEK, and JAXA (Japan), and the K.A. Wallenberg Foundation, the Swedish Research Council and the National Space Board (Sweden). Science analysis support in the operations phase from INAF (Italy) and CNES (France) is also gratefully acknowledged. This work performed in part under DOE Contract DE-AC02-76SF00515. This research was supported by Basic Science Research Program through the National Research Foundation of Korea (NRF) funded by the Ministry of Science, ICT & Future Planning (NRF-2017R1C1B2004566). Support was also obtained from NASA under grant 80NSSC17K0024. Work at NRL is supported by NASA.
References
- Abdo et al. (2013) Abdo, A. A., Ajello, M., Allafort, A., et al. 2013, ApJS, 208, 17
- Acero et al. (2015) Acero, F., Ackermann, M., Ajello, M., et al. 2015, ApJS, 218, 23
- Acero et al. (2016) —. 2016, ApJS, 223, 26
- Ackermann et al. (2015) Ackermann, M., Ajello, M., Albert, A., et al. 2015, ApJ, 799, 86
- Ajello et al. (2017) Ajello, M., Atwood, W. B., Baldini, L., et al. 2017, ApJS, 232, 18
- Akaike (1974) Akaike, H. 1974, IEEE Transactions on Automatic Control, 19, 716
- An & Romani (2017) An, H., & Romani, R. W. 2017, ApJ, 838, 145
- An et al. (2017) An, H., Romani, R. W., Johnson, T., Kerr, M., & Clark, C. J. 2017, ApJ, 850, 100
- Arumugasamy et al. (2015) Arumugasamy, P., Pavlov, G. G., & Garmire, G. P. 2015, ApJ, 814, 90
- Atwood et al. (2013) Atwood, W., Albert, A., Baldini, L., et al. 2013, ArXiv e-prints, arXiv:1303.3514
- Atwood et al. (2009) Atwood, W. B., Abdo, A. A., Ackermann, M., et al. 2009, ApJ, 697, 1071
- Bednarek (2014) Bednarek, W. 2014, A&A, 561, A116
- Bogovalov et al. (2008) Bogovalov, S. V., Khangulyan, D. V., Koldoba, A. V., Ustyugova, G. V., & Aharonian, F. A. 2008, MNRAS, 387, 63
- D’Ammando (2010) D’Ammando, F. 2010, The Astronomer’s Telegram, 2783
- de Jager et al. (1989) de Jager, O. C., Raubenheimer, B. C., & Swanepoel, J. W. H. 1989, A&A, 221, 180
- Edwards et al. (2006) Edwards, R. T., Hobbs, G. B., & Manchester, R. N. 2006, MNRAS, 372, 1549
- Gentile et al. (2014) Gentile, P. A., Roberts, M. S. E., McLaughlin, M. A., et al. 2014, ApJ, 783, 69
- Huang et al. (2012) Huang, R. H. H., Kong, A. K. H., Takata, J., et al. 2012, ApJ, 760, 92
- Keith et al. (2011) Keith, M. J., Johnston, S., Ray, P. S., et al. 2011, MNRAS, 414, 1292
- Kerr (2011) Kerr, M. 2011, ApJ, 732, 38
- Loredo (1992) Loredo, T. J. 1992, in Statistical Challenges in Modern Astronomy, ed. E. D. Feigelson & G. J. Babu, 275–297
- Luo et al. (2018) Luo, J., Ransom, S. M., Demorest, P., et al. 2018, in American Astronomical Society Meeting Abstracts, Vol. 231, American Astronomical Society Meeting Abstracts 231, 453.09
- Reynolds et al. (2007) Reynolds, M. T., Callanan, P. J., Fruchter, A. S., et al. 2007, MNRAS, 379, 1117
- Roberts et al. (2015) Roberts, M. S. E., McLaughlin, M. A., Gentile, P. A., et al. 2015, ArXiv e-prints, arXiv:1502.07208
- Romani et al. (2015) Romani, R. W., Filippenko, A. V., & Cenko, S. B. 2015, ApJ, 804, 115
- Romani & Sanchez (2016) Romani, R. W., & Sanchez, N. 2016, ApJ, 828, 7
- Wadiasingh et al. (2017) Wadiasingh, Z., Harding, A. K., Venter, C., Böttcher, M., & Baring, M. G. 2017, ApJ, 839, 80
- Wu et al. (2012) Wu, E. M. H., Takata, J., Cheng, K. S., et al. 2012, ApJ, 761, 181
- Xing & Wang (2015) Xing, Y., & Wang, Z. 2015, ApJ, 804, L33