Bi-Arrhenius diffusion and surface trapping of 8Li+ in rutile TiO2
Abstract
We report measurements of the diffusion rate of isolated ion-implanted 8Li+ within of the surface of oriented single-crystal rutile \ceTiO2 using a radiotracer technique. The -particles from the 8Li decay provide a sensitive monitor of the distance from the surface and how the depth profile of 8Li evolves with time. The main findings are that the implanted \ceLi^+ diffuses and traps at the surface. The -dependence of the diffusivity is described by a bi-Arrhenius expression with activation energies of above , whereas at lower temperatures it has a much smaller barrier of . We consider possible origins for the surface trapping, as well the nature of the low- barrier.
It is well known Johnson (1964); Johnson and Krouse (1966) that \ceLi^+ diffusion in rutile \ceTiO2 through the -axis channels is extremely fast, greatly surpassing all other interstitial cations Van Orman and Crispin (2010), with a room temperature diffusion coefficient exceeding many modern solid-state \ceLi electrolytes Bachman et al. (2016). A major limitation to its use as an electrode material in Li-ion batteries is its limited \ceLi uptake at room temperature Murphy et al. (1983); Zachau-Christiansen et al. (1988); however, the discovery that using nanosized crystallites mitigates this issue Hu et al. (2006) has led to renewed interest in its applicability Reddy et al. (2013).
There are a number of poorly understood aspects of rutile lithiation, including the cause of the limited \ceLi^+ uptake, as well as why reported Li diffusion rates differ by orders of magnitude, even under the same experimental conditions Johnson (1964); Kanamura et al. (1987); Churikov et al. (2004); Bach et al. (2010); Churikov et al. (2014); McFadden et al. (2017). Theoretical studies (see e.g., Koudriachova et al. (2002); Gligor and de Leeuw (2006); Kerisit et al. (2009a); Yildirim et al. (2012); Kerisit et al. (2014); Jung et al. (2014); Arrouvel et al. (2015)) have been unable to reproduce the characteristics of \ceLi^+ migration found in experiments Johnson (1964); Bach et al. (2010); McFadden et al. (2017). A direct technique applicable to the nanoscale could help resolve these issues. To this end, we developed a variation to the classical radiotracer method, the 8Li -radiotracer method, which uses the attenuation of the progeny -particles from the radioactive decay of 8Li, to study nanoscale \ceLi diffusion. This method differs from conventional radiotracer diffusion experiments in several key aspects: (a) it is non-destructive (b) it is sensitive to motions on the nanometer scale Ishiyama et al. (2016) (c) it can be applied to thin films and heterostructures and (d) it is amenable for the use of short-lived isotopes ().
In this study, we employ the -radiotracer method to extract the diffusion coefficient and its activation energy for isolated \ceLi in rutile \ceTiO2 and show that Li+ traps at the rutile surface. In addition, we report that the nanoscale \ceLi diffusion exhibits bi-Arrhenius behavior. The high- (above ) activation energy and diffusion rate are in agreement with previous studies. The low- behavior is discussed in the context of the recently reported Li-Ti3+ polaron complex McFadden et al. (2017); here we suggest that part of that signal is also connected to \ceLi hopping/diffusion.
The experiment was performed using the ISAC facility at TRIUMF Morris (2014), in Vancouver, Canada. The samples were commercial chemo-mechanically polished (roughness ) single crystal rutile \ceTiO2 substrates (CRYSTAL GmbH) with typical dimensions of . The surfaces were free of macroscopic defects under 50x magnification.
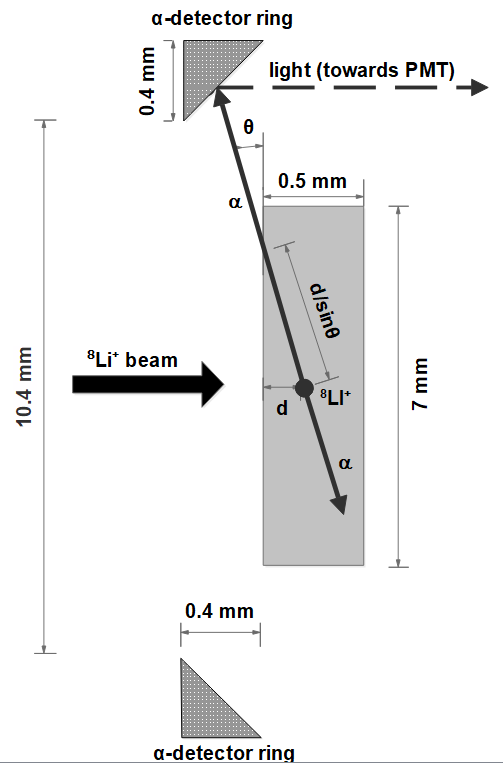
In the experiment, a short beam pulse of low energy ( ) 8Li+ ions is implanted close to the surface of the rutile targets (at an average depth of ) housed in an ultra-high vacuum cold finger cryostat Morris (2014); Salman et al. (2004). The energy of the beam defines the initial Li+ implantation profile. Upon arrival, the \ce^8Li^+ starts to diffuse through the sample and undergoes -decay to \ce^8Be which then decays (immediately) into two energetic -particles, each with a mean energy of . Due to their rapid attenuation inside the sample, the highest energy -particles escaping the sample originate from 8Li+ that have diffused back closer to the surface.
To further amplify the sensitivity to \ce^8Li^+ near the surface, the -detector is placed at a grazing angle, , relative to the surface, as shown in Fig. 1. The -detector in our setup is an \ceAl ring, whose inside surface is cut at and coated with a thin layer of \ceAg-doped \ceZnS, a well known scintillator sensitive to -particles Asada et al. (1959). The light from the ZnS:Ag scintillator is collected in the forward direction using two lenses which focus the light onto the photo-cathode of a fast photomultiplier (PMT). The second lens and the PMT are positioned outside the vacuum chamber, behind a transparent viewport. The PMT pulses have a large signal to noise ratio () and pass through a timing filter amplifier to be discriminated, so that only the top of pulses above the noise level are counted.
The diffusion rate of \ceLi inside the sample is directly related to the time it takes to reach the surface, which in turn relates to the -rate as a function of time. This method has intrinsic time- and length-scales of and , respectively, which leads to a theoretical sensitivity to the diffusion rate from to . This technique thus covers an optimal range of for battery materials. However, our effective sensitivity limit is closer to , determined by experimental factors such as the finite counting statistics and the existence of small distortions due to pileup in the detector response. In addition, the experimental sensitivity is somewhat higher for a lower implantation energy (see insert of Fig. 4).
In situations where \ceLi^+ is immobile, the probability of detecting an for any given decay event is time-independent and the measured -counts follow the decay rate of 8Li. This can be monitored conveniently using the high energy -particles from the 8Li decay, which are weakly attenuated over these distances. Thus, the ratio of counts is constant in time. On the other hand, when \ceLi^+ is mobile, the ratio is time-dependent when the mean diffusion length in the 8Li lifetime is comparable to the mean depth of implantation, reflecting the fact that the 8Li+ depth distribution is evolving in time. The information on \ceLi diffusion comes from the time evolution of the -signal. The absolute -to- ratio, i.e., the baseline ratio of , in the absence of diffusion, depends on experimental factors such as detector efficiencies, therefore in order to account for these systematics, each -spectrum is self-normalized to start from unity at time zero, i.e., Ishiyama et al. (2015).
In order to extract the \ceLi diffusion rate, the experimentally acquired normalized was compared to a library of simulated signals. To this end, we performed numerical solutions to Fick’s laws in 1D to generate the time-evolved depth distribution of 8Li+, accounting for the boundary conditions of the crystal surface and the initial 8Li+ stopping profile as simulated by the SRIM Monte Carlo package Ziegler et al. (2010). is then obtained by multiplying each bin of the depth profile of 8Li with the probability of detecting an emitted at that depth. The -detection probability versus depth was extracted using the Geant4 J. Allison et al. (2016) simulation package. The qualitative characteristics of were found to depend heavily on whether the diffusing Li+ ions accumulate or reflect upon reaching the sample surface (see Fig. 2), implying that one can unambiguously infer the 8Li+ behavior at the surface, i.e., whether it is trapped or reflected. Furthermore, deviates significantly from the simple exponential decay of 8Li () with increasing diffusion rate.
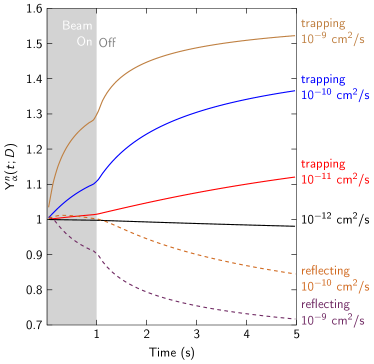
With an accumulating boundary condition at the surface, faster diffusion results in a monotonically increasing , while a reflecting boundary condition leads to that decreases with time, since the overall mean distance from the surface will then increase with time as the \ceLi migrates away from the surface back to the bulk of the sample, towards the uniform depth distribution. Between these two ideal cases, there could be a non-zero trapping probability at the sample’s surface. For a fixed diffusivity , gradually evolves from looking reflective-like (), towards resembling the accumulating condition (for ). Note that after each reflection, the \ceLi^+ will continue their random walk, so for any non-zero value of , most Li ions will eventually (after several reflections) get trapped at the surface if the diffusion is fast enough.
A technique similar to the one discussed here has been developed by Jeong et al. Jeong et al. (2005) for \ceLi^+ diffusion on micrometer and, recently, by Ishiyama et al. Ishiyama et al. (2016) on a nanometer length scales; however, the experiment reported here differs in a few key ways. In particular, the 8Li implantation rates accessible at TRIUMF (typically 106-107 8Li+/s) are 1-2 orders of magnitude larger Ishiyama et al. (2016), which allows the -detector to be placed at a grazing angle ( versus o Ishiyama et al. (2015)). This detector configuration significantly decreases the -counts, but greatly enhances the sensitivity to the near-surface region. In addition, the ZnS:Ag ring detector used in the present setup is much simpler and easier to install close to the sample in UHV compared to a Si detector Ishiyama et al. (2015), although it has less energy resolution.
Using this technique, we performed -radiotracer measurements on rutile \ceTiO2 at various temperatures with two beam energies (10 and ) and two sample orientations. As \ceLi^+ is known to diffuse primarily along the -axis of rutile, if the -axis is oriented parallel to the surface (perpendicular to the beam), then the 8Li+ motion should not change the initial implantation profile. Since the -plane diffusivity , is expected to be time-independent. On the other hand, if the -axis is perpendicular to the surface, then the depth distribution of lithium should be evolving with time, since .
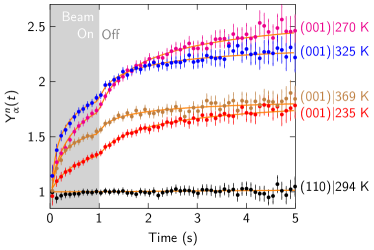
In Fig. 3 we compare the measured normalized -yield, , for the -axis parallel and perpendicular to the surface. As expected, the time spectrum for the orientation of \ceTiO2 rutile (-axis parallel to the surface) is completely flat at , indicating that the -plane diffusion rate is lower than the theoretical detection limit (Fig. 2), consistent with other studies reporting an -plane diffusion rate of or lower Johnson (1964). Also shown in Fig. 3 are a few examples of experimental data for the orientation in the range of , with the corresponding fits to the model described above.
To fit the data, we used a custom C++ code applying the MINUIT James and Roos (1975) minimization functionalities of ROOT Brun and Rademakers (1997) to compare the signals to the library of calculated spectra. The free parameters of the fit were and . All spectra at both implantation energies ( and ) were fitted simultaneously with a shared value. For the orientation increases rapidly with time, approaching saturation, indicating that lithium diffuses fast along the -axis and gets trapped at (or within few of) the surface (see Fig. 2). For , the global value is completely insensitive to , but for , the quality of the fits deteriorates rapidly. This is the first unambiguous evidence for Li trapping (with at least probability) at the surface. There is no evidence of Li de-trapping up to , since at that temperature reaches saturation after and any Li surface de-trapping would lead to an observable decrease of at later times. The non-zero trapping probability is most likely related to the reported difficulty of intercalating Li into rutile, as the Li ions would tend to stick at or near the surface rather than diffusing into the bulk.
It is not clear whether the \ceLi^+ surface trapping is caused by an electrostatic potential well (similar to \ceH in \cePd Okuyama et al. (1998)), a partially reconstructed surface Diebold (2003), or by a chemical sink either due to an adsorbate, or a solid state reaction at the surface (e.g., forming cubic \ceLiTiO2). Subsequent measurements of an adsorbate-free rutile sample, as well as samples capped with thin layers of materials capable of altering the surface chemistry are needed to resolve this question.
Turning to the values of extracted using the above analysis (see Fig. 4), they reveal a bi-Arrhenius relationship of the form:
| (1) |
where is the activation energy and is the prefactor of each component. These were found to be and for the high- component and and for the low- component, respectively. This extracted is in excellent agreement with values deduced by other techniques Johnson (1964); Bach et al. (2010); McFadden et al. (2017) and the diffusion rates at high temperatures are very similar to the ones found in rutile nanorods using impedance spectroscopy Bach et al. (2010).
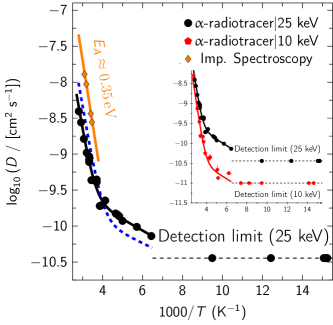
Both data sets acquired with beam energies of 10 and yield virtually the same bi-Arrhenius activation energies and they are in agreement at high-, but the low- component of the data is shifted lower by about an order of magnitude. For trapping probability , the apparent gap narrows and for is about half an order of magnitude wide. The persistency of the gap suggests that it might be related to either a discrepancy between the SRIM and the actual implantation profiles (e.g., due to channeling Beals et al. (2003)), or due to some small random disorder close to the surface parameterized by some energy scale (). At higher temperatures when its effect would diminish. Both these effects would affect the (closer to the surface) data more than the and would become irrelevant at fast diffusivities, explaining the agreement of the two sets at high temperatures and why the diffusion seems slower at low- for the data.
A bi-Arrhenius relationship for diffusivity is not uncommon; in vacancy ion conductors Hooton and Jacobs (1988), it may occur from a crossover between a region at high-, where vacancies are thermally generated, to a region at lower with a shallower slope. As -radiotracer is always only measuring the diffusion of Li+, rather than the net ionic conductivity, the origin of the two Arrhenius components can’t be the same as above. While we cannot be conclusive about it, we consider some possibilities.
We first consider a recent -NMR experiment on rutile McFadden et al. (2017), which also used an implanted 8Li+ beam on similar crystals. The -NMR measurements revealed two peaks in the relaxation rate , one below and one above .
Below , a barrier was attributed to dynamics of electron-polarons in the vicinity of the implanted ion Kerisit et al. (2009b); Brant et al. (2013). In principle, these dynamics might not be diffusive, e.g. if the 8Li+ is static and the polaron is thermally trapped by the Li and cycles through trapping and detrapping. Nonetheless, our current measurement really shows that there is some long range diffusion of 8Li+ at low-, with a barrier significantly different than high-. While our is of a similar magnitude to that found with -NMR, it is also compatible with the diffusion barrier predicted from theory for isolated \ceLi in rutile Koudriachova et al. (2001, 2002); Gligor and de Leeuw (2006); Kerisit et al. (2009a); Yildirim et al. (2012); Kerisit et al. (2014); Jung et al. (2014); Arrouvel et al. (2015). The -radiotracer cannot distinguish whether \ceLi moves either as a simple interstitial, or as part of a Li-polaron complex, it would only identify their weighted average contribution to the motion of \ce^8Li^+. The similarity of the observed activation energy at low temperatures to the theoretical value suggests that a small fraction of the \ceLi^+ interstitials does not combine with a polaron, but rather diffuses as a simple ion. If this fraction is small, that would explain why the low- prefactor is so much smaller than the high-.
It seems possible that the larger activation energy observed above may involve diffusion of a more complex object, possibly a Li-polaron complex, or it could be related to a disassociation energy of Li+ with the polarons, which are known to form Coulomb bond defect complexes. Indeed, theory predicts a diffusion barrier of for the Li-polaron complex and a disassociation energy of Kerisit et al. (2009b), both comparable to the high- barrier found here. The Li-polaron complex is overall electrically neutral, so its movement should contribute to the diffusivity of Li but not to the ionic conductivity in terms of charge transport. An electric field would not cause it to move - unless it was strong enough to destabilize the complex (strong potential gradient). Thus, if it is a neutral Li-polaron complex moving at high-, one would expect the impedance measurement to yield a very different Arrhenius slope.
The much larger prefactor above , compared to low-, is also quite intriguing and is further evidence that these are two very different mechanisms for diffusion of Li in rutile. Indeed, , when written in terms of frequency, yields , which is in the - range one would normally expect from phonons driving a thermally activated motion. Note that this frequency is 5000 times smaller than what was found with -NMR McFadden et al. (2017), as well as with optical absorption Johnson (1964), which infer indirectly, whereas this is a direct measurement.
In summary, we used the radioactive -decay of 8Li to study \ceLi diffusion in a single crystal rutile \ceTiO2 in the range of . The nanoscale Li diffusion rate was found to exhibit bi-Arrhenius behavior. We report a high- activation energy of , in agreement with measurements carried out with different techniques Johnson (1964); Bach et al. (2010); McFadden et al. (2017). At low temperatures, a second Arrhenius component was revealed, with an activation energy of . We suggest that this might be related to a small fraction of the Li+ that does not bind to a Li-polaron complex but rather hops as a simple interstitial with an activation energy near theoretical calculations. In addition, we found evidence that \ceLi traps at the surface, which could contribute to the reduced \ceLi uptake at room temperature. We believe that this technique can shed new light on the \ceLi motion in Li-ion battery materials and across their interfaces.
Acknowledgements.
Special thanks to R. Abasalti, D. Vyas and M. McLay for all their excellent technical support. This work was supported by: NSERC Discovery Grants to R.F.K. and W.A.M.; J.S. was supported by Japan Society for the Promotion Science (JSPS) KAKENHI Grant No. JP18H01863; and IsoSiM fellowships to A.C. and R.M.L.M. TRIUMF receives federal funding via a contribution agreement with the National Research Council of Canada.References
- Johnson (1964) O. W. Johnson, Phys. Rev. 136, A284 (1964).
- Johnson and Krouse (1966) O. W. Johnson and H. R. Krouse, J. Appl. Phys. 37, 668 (1966).
- Van Orman and Crispin (2010) J. A. Van Orman and K. L. Crispin, Rev. Mineral. Geochem. 72, 757 (2010).
- Bachman et al. (2016) J. C. Bachman, S. Muy, A. Grimaud, H.-H. Chang, N. Pour, S. F. Lux, O. Paschos, F. Maglia, S. Lupart, P. Lamp, L. Giordano, and Y. Shao-Horn, Chem. Rev. 116, 140 (2016).
- Murphy et al. (1983) D. W. Murphy, R. J. Cava, S. M. Zahurak, and A. Santoro, Solid State Ionics 9–10, 413 (1983).
- Zachau-Christiansen et al. (1988) B. Zachau-Christiansen, K. West, T. Jacobsen, and S. Atlung, Solid State Ionics 28–30, 1176 (1988).
- Hu et al. (2006) Y.-S. Hu, L. Kienle, Y.-G. Guo, and J. Maier, Adv. Mater. 18, 1421 (2006).
- Reddy et al. (2013) M. V. Reddy, G. V. Subba Rao, and B. V. R. Chowdari, Chem. Rev. 113, 5364 (2013).
- Kanamura et al. (1987) K. Kanamura, K. Yuasa, and Z. Takehara, J. Power Sources 20, 127 (1987).
- Churikov et al. (2004) A. V. Churikov, V. A. Zobenkova, and K. I. Pridatko, Russ. J. Electrochem. 40, 63 (2004).
- Bach et al. (2010) S. Bach, J. P. Pereira-Ramos, and P. Willman, Electrochim. Acta. 55, 4952 (2010).
- Churikov et al. (2014) A. V. Churikov, A. V. Ivanishchev, A. V. Ushakov, and V. O. Romanova, J. Solid State Electrochem. 18, 1425 (2014).
- McFadden et al. (2017) R. M. L. McFadden, T. J. Buck, A. Chatzichristos, C.-C. Chen, K. H. Chow, D. L. Cortie, M. H. Dehn, V. L. Karner, D. Koumoulis, C. D. P. Levy, C. Li, I. McKenzie, R. Merkle, G. D. Morris, M. R. Pearson, Z. Salman, D. Samuelis, M. Stachura, J. Xiao, J. Maier, R. F. Kiefl, and W. A. MacFarlane, Chem. Mater. 29, 10187 (2017).
- Koudriachova et al. (2002) M. V. Koudriachova, N. M. Harrison, and S. W. de Leeuw, Phys. Rev. B 65, 235423 (2002).
- Gligor and de Leeuw (2006) F. Gligor and S. W. de Leeuw, Solid State Ionics 177, 2741 (2006).
- Kerisit et al. (2009a) S. Kerisit, K. M. Rosso, Z. Yang, and J. Liu, J. Phys. Chem. C 113, 20998 (2009a).
- Yildirim et al. (2012) H. Yildirim, J. P. Greeley, and S. K. R. S. Sankaranarayanan, Phys. Chem. Chem. Phys. 14, 4565 (2012).
- Kerisit et al. (2014) S. Kerisit, A. M. Chaka, T. C. Droubay, and E. S. Ilton, J. Phys. Chem. C 118, 24231 (2014).
- Jung et al. (2014) J. Jung, M. Cho, and M. Zhou, AIP Adv. 4, 017104 (2014).
- Arrouvel et al. (2015) C. Arrouvel, T. C. Peixoto, M. E. G. Valerio, and S. C. Parker, Comput. Theor. Chem. 1072, 43 (2015).
- Ishiyama et al. (2016) H. Ishiyama, S. C. Jeong, Y. X. Watanabe, Y. Hirayama, N. Imai, H. S. Jung, H. Miyatake, M. Oyaizu, A. Osa, Y. Otokawa, M. Matsuda, K. Nishio, H. Makii, T. K. Sato, N. Kuwata, J. Kawamura, H. Ueno, Y. H. Kim, S. Kimura, and M. Mukai, Nucl. Instrum. Methods Phys. Res., Sect. B 376, 379 (2016).
- Morris (2014) G. D. Morris, Hyperfine Interact. 225, 173 (2014).
- Salman et al. (2004) Z. Salman, E. P. Reynard, W. A. MacFarlane, K. H. Chow, J. Chakhalian, S. R. Kreitzman, S. Daviel, C. D. P. Levy, R. Poutissou, and R. F. Kiefl, Phys. Rev. B 70, 104404 (2004).
- Asada et al. (1959) T. Asada, M. Masuda, M. Okumura, and J. Okuma, Journal of the Physical Society of Japan 14, 1766 (1959).
- Ishiyama et al. (2013) H. Ishiyama, S.-C. Jeong, Y. Watanabe, Y. Hirayama, N. Imai, H. Miyatake, M. Oyaizu, I. Katayama, M. Sataka, A. Osa, Y. Otokawa, M. Matsuda, and H. Makii, Jpn. J. Appl. Phys. 52, 010205 (2013).
- Ishiyama et al. (2015) H. Ishiyama, S. C. Jeong, Y. X. Watanabe, Y. Hirayama, N. Imai, H. Miyatake, M. Oyaizu, A. Osa, Y. Otokawa, M. Matsuda, K. Nishio, H. Makii, T. K. Sato, N. Kuwata, J. Kawamura, A. Nakao, H. Ueno, Y. H. Kim, S. Kimura, and M. Mukai, Nucl. Instrum. Methods Phys. Res., Sect. B 354, 297 (2015).
- Ziegler et al. (2010) J. F. Ziegler, M. D. Ziegler, and J. P. Biersack, Nucl. Instrum. Methods Phys. Res., Sect. B 268, 1818 (2010).
- J. Allison et al. (2016) J. Allison et al., Nucl. Instrum. Methods Phys. Res., Sect. A 835, 186 (2016).
- Jeong et al. (2005) S.-C. Jeong, I. Katayama, H. Kawakami, Y. Watanabe, H. Ishiyama, H. Miyatake, M. Sataka, S. Okayasu, H. Sugai, S. Ichikawa, K. Nishio, T. Nakanoya, N. Ishikawa, Y. Chimi, T. Hashimoto, M. Yahagi, K. Takada, B. C. Kim, M. Watanabe, A. Iwase, T. Hashimoto, and T. Ishikawa, Nucl. Instrum. Methods Phys. Res., Sect. B 230, 596 (2005).
- James and Roos (1975) F. James and M. Roos, Comput. Phys. Commun. 10, 343 (1975).
- Brun and Rademakers (1997) R. Brun and F. Rademakers, Nucl. Instrum. Methods Phys. Res., Sect. A 389, 81 (1997).
- Okuyama et al. (1998) H. Okuyama, W. Siga, N. Takagi, M. Nishijima, and T. Aruga, Surface Science 401, 344 (1998).
- Diebold (2003) U. Diebold, Surf. Sci. Rep. 48, 53 (2003).
- Beals et al. (2003) T. Beals, R. Kiefl, W. MacFarlane, K. Nichol, G. Morris, C. Levy, S. Kreitzman, R. Poutissou, S. Daviel, R. Baartman, and K. Chow, Physica B: Condensed Matter 326, 205 (2003).
- Hooton and Jacobs (1988) I. E. Hooton and P. W. M. Jacobs, Canadian Journal of Chemistry 66, 830 (1988).
- Kerisit et al. (2009b) S. Kerisit, K. M. Rosso, Z. Yang, and J. Liu, The Journal of Physical Chemistry C 113, 20998 (2009b).
- Brant et al. (2013) A. T. Brant, N. C. Giles, and L. E. Halliburton, Journal of Applied Physics 113, 053712 (2013).
- Koudriachova et al. (2001) M. V. Koudriachova, N. M. Harrison, and S. W. de Leeuw, Phys. Rev. Lett. 86, 1275 (2001).