7Li evolution in the thin and thick disks of the Milky Way
Abstract
Recent detection of the isotope 7Be (that decays into 7Li) in the outburst of classical novae confirms the suggestion made in the 70s that novae could make 7Li. We reconsidered the role of novae as producers of 7Li by means of a detailed model of the chemical evolution of the Milky Way. We showed that novae could be the Galactic 7Li source accounting for the observed increase of Li abundances in the thin disk with stellar metallicity. The best agreement with the upper envelope of the observed Li abundances is obtained for a delay time of 1 Gyr for the nova production and for an effective 7Li yield of M☉ over the whole nova life. Lithium in halo stars is depleted by 0.35 dex, assuming the pristine abundance from standard big bang nucleosynthesis. We elaborate a model that matches the pristine stellar abundances, assuming that all stars are depleted by 0.35 dex. In this case, the delay remains the same, but the Li yields are doubled compared to the previous case. This model also has the merit to match the Li abundance in meteorites and young TTauri stars. The thick disk model, adopting the parameters derived for the thin disk, can also explain the absence of increase of Li abundances in its stars. The thick disk is old, but formed and evolved in a time shorter than that required by novae to contribute significantly to 7Li. Therefore, no 7Li enhancement is expected in thick disk stars. We show that the almost constant Li abundance in the thick disk results from the compensation of stellar astration by spallation processes.
keywords:
stars: individual V5668 Sgr; stars: novae – nucleosynthesis, abundances; Galaxy: evolution – abundances1 Introduction
7Li nuclei are the heaviest ones produced in significant amounts during the Big Bang. The primordial 7Li production is a sensitive function of the baryon-to-photon ratio and can be estimated in the framework of standard primordial nucleosynthesis once the baryon density is taken either from the primordial deuterium abundance or from the fluctuations of the cosmic microwave background (CMB). The expected primordial value is of A(Li) = 2.6 which is a factor of three to four higher than what measured in the halo dwarf stars (Spite & Spite, 1982). This discrepancy is normally referred to as the Cosmological Lithium problem. The problem became clear by the time WMAP measurement of universal baryon density was used to infer the primordial Li abundance within the standard primordial nucleosynthesis (Cyburt, Fields & Olive, 2003), although there were already earlier hints (Cayrel, 1998). More recently, the baryon density measured either by the Planck mission (Planck Collaboration et al., 2016) or by deuterium in quasar spectra confirmed the disagreement with the lithium abundance measured in the halo stars (Tanabashi et al., 2018). The origin of this discrepancy has still to be identified with confidence, but a possible stellar fix has been recently proposed by Fu et al. (2015). Since the present Li abundance as measured in meteorites (Krankowsky & Müller, 1964) or in the young TTauri stars is A(Li) 3.3, a Galactic source is required to account for the increase from the initial value of 2.6. The identification of these sources is generally referred to as the Galactic Lithium problem. A large variety of nucleosynthesis processes and sources was suggested so far. An established source is the spallation of atoms in the interstellar-medium by energetic cosmic rays. The same processes make also 6Li, 9Be and 10,11B. Thus, from the abundance of these isotopes, in particular 9Be, and by means of the relative cross-sections it is possible to estimate the fraction of 7Li produced by spallation. Spallation processes integrated along the Galactic life can account for at most 30% of the presently measured 7Li and require other source(s) to enrich the Galaxy to the present values. Other proposed sources are the spallation processes in the flares of low mass active stars, red giants (RG), asymptotic giant branch (AGB) stars, novae and neutrino induced nucleosynthesis in supernovae explosions. 7Li has been observed to be greatly enhanced in some AGB stars (Smith & Lambert, 1989, 1990) and the case of Li in red giants was nicely reviewed in Casey et al. (2016).
Different sources have different time scales for the production and therefore the rate of lithium increase is a different way to asses their relative contributions. However, the possible 7Li destruction inside a star complicates the picture. For instance, the Sun shows A(Li) = 1.04 which is more than two orders of magnitudes lower than the proto-solar nebula due to internal and poorly understood destruction. During the stellar evolution off the main sequence surface layers with lithium are mixed with more internal ones producing a Li diluition which can be nicely observed in the globular clusters, such as NGC 6397 (e.g. Lind et al., 2009).
Observations of metal poor stars show that 7Li remains constant at A(Li) 2.3 from the lowest metallicities up to approximately [Fe/H] 1 when the abundance starts to rise reaching the meteoritic value of A(Li) =3.3. at solar metallicities. After Rebolo, Beckman & Molaro (1988) it became common to assume the upper envelope of the distribution of 7Li abundances to trace the 7Li abundance evolution. Galactic chemical evolution (GCE) models of 7Li were pioneered by D’Antona & Matteucci (1991) and Romano et al. (1999) where the different contributions and time scales were discussed. In these models a shared feature is that the AGB or SNe do not contribute much to the 7Li production, and novae are potentially an important source. Matteucci, D’Antona & Timmes (1995) also studied the possible contribution of -process during SNe II explosions. The interplay of different sources was studied in the context of the GCE model of lithium by Travaglio et al. (2001), whereas Alibés, Labay & Canal (2002) analysed in particular the role of spallation for lithium, beryllium and boron. Prantzos (2012) concluded that 30% of the lithium content of our Galaxy at most can be produced by galactic cosmic rays, and a stellar origin is needed for the remaining fraction. Romano et al. (2001) and Prantzos et al. (2017) identified low-mass giant stars as the best candidates for reproducing the late rise off the lithium-metallicity plateau.
In fact, about 1-2 % of red giants show Li higher than A(Li) 1.5 that is the expected value predicted by standard stellar evolution theory due to evolution along the first giant branch (Casey et al., 2016; Smiljanic et al., 2018; Lyubimkov, 2016). The most Li-rich giant recently discovered by Yan et al. (2018) reaches the value of A(Li) = 4.51 . However, only about 30 other red giants show A(Li) greater than the meteoritic value, i.e. only about 0.1% of the red giants studied. The most promising explanation for this Li enrichment is similar to the Cameron - Fowler mechanism (Cameron & Fowler, 1971) proposed to explain the Li in AGB stars. However, in RG stars the introduction of the extra-mixing mechanism is required to bring fresh lithium to the surface (Sackmann & Boothroyd, 1999; Lattanzio et al., 2015). Another possible explanation is that the lithium comes from external pollution, for example in the case of an engulfment of planets or planetesimals during the evolution to the red giant branch Siess & Livio (1999). Whatever the origin the high A(Li) cannot be maintained for long time due to convection activity in these stars as also shown by the low percentage of RG which are Li rich (Yan et al., 2018). Therefore, their contribution to the Li enrichment of the interstellar medium remains quite uncertain.
The significant increase of the measurements provided by recente surveys revealed a different behaviour in the 7Li evolution between the thin and thick disk of the Milky Way. At the lower metallicity end the thick and thin disk stars show the same Li abundance (Molaro, Bonifacio & Pasquini, 1997). At higher metallicities the increase in Li was steeper in the thin than the thick disks by Guiglion et al. (2016) and Fu et al. (2018). The precise behaviour of 7Li abundance in the thick disk as a function of metallicity is still matter of debate. It was found constant and approximately at the same value of the most metal poor stars by Ramírez et al. (2012), decreasing by Delgado Mena et al. (2015) and Bensby & Lind (2018) and slightly increasing by Fu et al. (2018). The separation between thin and thick stars is not always straightforward and the presence of some contamination could explain the slightly different results for the thick disk. In any case, all these analyses show that the thick disk abundances are equal or lower than the thin disk ones of similar metallicities. An additional feature for thin disk stars emerged recently: Li abundances of stars above solar metallicity show lower values than at solar metallicity suggesting a puzzling decrease of lithium. Guiglion et al. (2016) and Prantzos et al. (2017) tried to explain these features in terms of stellar migration as it is has been done for the similar [O/Fe] versus [Fe/H] behaviour, but without achieving a robust conclusion.
Thermo-nuclear production of 7Be (that decays into 7Li) during nova explosions were proposed by Arnould & Norgaard (1975) and Starrfield et al. (1978). At temperatures of 150 million K 7Be is formed from the reaction 3He (, )7Be (Hernanz et al., 1996). To avoid destruction 7Be needs to be carried to cooler regions by convection on a short time scale as in the Cameron-Fowler mechanism (Cameron & Fowler, 1971). When these cooler regions are subsequently ejected, 7Be could be observed in absorption in the nova outburst (José & Hernanz, 1998). Predicted in the mid 70s, observational evidence of Li in a nova outburst has been found only recently by Izzo et al. (2015) who reported the possible detection of the 7Li i 6708 line in the spectra of Nova Centauri 2013 (V1369 Cen). This has been followed by the detection of the mother nuclei 7Be in the post-outburst spectra of classical novae by Tajitsu et al. (2015), Tajitsu et al. (2016), Molaro et al. (2016), Izzo et al. (2018) and Selvelli, Izzo & Molaro (2018). The observed 7Be decays into 7Li with a mean-life of 53 days and all 7Be observed ends up into 7Li. The relative abundance of 7Be/H has been measured in four classical novae with overproduction factors which range between 4 and 5 orders of magnitude over the meteoritic abundance. In this paper, we revise the 7Li evolution by considering this new evidence and see if we can reproduce the 7Li behaviour. We also explore whether a Li synthesis by classical novae could also explain the different 7Li behaviours observed in the thick disk of the Galaxy.
2 7Li Galactic Chemical evolution of the thin disk
2.1 Observational Data for the thin disk
The abundances for the Galactic thin disk stars are taken from the Ambre project (Guiglion et al., 2016) and from the data by Bensby & Lind (2018). In the Ambre project (Guiglion et al., 2016) lithium abundances for 7272 stars were derived. However, we use only their working sample of 3009 stars that comprises only dwarf stars. Bensby & Lind (2018) measured Li abundances for 420 dwarf stars and provided upper limits on the Li abundance for a further 121. We integrate the results of this data set with previous results (Bensby, Feltzing & Oey, 2014) for stellar ages, temperature and stellar kinematics, as defined by the calculated probability functions. As shown in Bensby & Lind (2018), some stars are not correctly classified as thick or thin disk by a chemical selection only, although it is successful in most cases. In fact, depending on alpha element the quality of the chemical selection changes significantly. Tiny differences in the chemical selection can change the outcome quite dramatically and the selection becomes increasingly difficult toward solar metallicity. We therefore consider the kinematical selection as the best one, and we use the chemical selection only when the kinematical information is not present. The kinematical parameters are not available in the Ambre data and therefore we use their chemical selection with 2671 thin disk stars. For the Ambre data we compute an upper envelope obtained by computing the mean over the five data points with the highest 7Li over 10 bins of 0.1 dex in [Fe/H] and after clipping for the outliers. The envelope is shown in Fig 2 with the shadowed area covering one standard deviation from the mean value. For Bensby & Lind (2018) data we do not compute the envelope due to the small number of stars and show only stars with effective temperature higher than 5900 K to partially exclude the main-sequence stars where internal stellar depletion is occurring. This temperature threshold is derived from Fig. 8 in Bensby & Lind (2018) and Fig. 11 in Lind et al. (2009). With this temperature cut off the sample is reduced to 116. To note that in general for stars with lower Li abundances it is unclear whether 7Li was partially depleted by convections or similar mechanisms or reflects a truly initial lower abundance.
2.2 Observational constraints to novae 7Li yields
Normally 7Li i is not detected in the spectra of novae outbursts and the first, and so far unique, Li i detection by Izzo et al. (2015) implies that the physical conditions in the ejecta of post-outburst novae only rarely permit the survival of neutral 7Li i. However, the recent detection of mother nuclei 7Be in the post-outburst spectra of all the novae where it was possible to study the presence of 7Be so far shows that thermonuclear production of 7Be is effectively taking place and is probably a common feature of classical novae.
For three novae the abundance of 7Be is estimated relatively to the Ca ii for unsaturated and resolved lines which are assumed to represent the abundances in the whole material ejected. The 7Be/H by number derived from the observations and corrected for the 7Be decay assuming all the 7Be has been made around the nova maximum. In Nova Herculis 1990 the abundance was also derived from the emission which takes into account the whole envelope and found of 2 10-5, consistent with the abundance derived from absorption lines (Selvelli, Izzo & Molaro, 2018). To note that the observed yields are significantly larger than the maximum theoretical yields predicted by the models of José & Hernanz (1998). On the long term 7Be 7Li and the derived fractions correspond to a 7Li logarithmic overabundances of 4 to 5 dex with respect to the meteoritic value of 1.3 10-9 (Lodders, Palme & Gail, 2009).
These overproduction factors imply a production factor of 10-9 per nova event assuming an ejected mass of 10-5 and a total production of 10-9 of Li during the whole nova life assuming a typical number of bursts of 104. A rate of 20 yr-1 of nova events in a Galaxy lifetime of 1010 yr producing 3 10-9 is enough to produce 600 which is comparable to that estimated to be present in the Milky Way. This simple estimation shows that novae could indeed be one of the main factories of 7Li in the Galaxy.
Therefore, we decide to reconsider the role of novae as main producers of 7Li in the Milky Way. To investigate this role, we implement the lithium production from novae in a detailed GCE model of the Milky Way thin disk (see next Section). We do not assume the observational yields into the modelling directly, given the spread in the observed abundances. We rather estimate the best set of parameters for lithium production by novae - described in the next Section -comparing the chemical evolution model results to the abundance measured in thin disk stars. Only at the end of this procedure we verify whether or not these theoretically computed yields are compatible with the observational constraints obtained from novae outbursts.
2.3 Thin Disk chemical evolution model
Our model for the thin disk adopts prescriptions similar to that used in Romano et al. (2010) and Grisoni et al. (2017). Grisoni et al. (2017) modified the original two infall frameworks (Chiappini, Matteucci & Gratton, 1997) and set the parameters to reproduce the elements and the metallicity distribution function determined in the AMBRE project at best. The initial mass function (IMF) is from Kroupa (2001), whereas the stellar lifetime are from Meynet & Maeder (2002). SNe Ia follows the single degenerate scheme as Matteucci & Greggio (1986) with a fraction of successful binary systems of 0.05 and iron yields from W7 model by Iwamoto et al. (1999). Iron nucleosynthesis for massive stars is from Kobayashi, Karakas & Umeda (2011). The main characteristic of the model is a prolonged exponential infall following this relation:
| (1) |
with timescale of = 4 Gyr and a total evolution which lasts for 10 Gyr.
The star formation follows this equation:
| (2) |
with a mild efficiency (=0.5).
2.3.1 Lithium nucleosynthesis
In this paper we assume that the principal producers of 7Li are nova systems. Given the relatively large spread in the lithium produced by novae, we study the space of the parameters that describes this production and we compare the results obtained by means of a detailed chemical evolution model to observational data of thin disk stars. The main assumptions are the following:
-
•
Only binary systems formed by stars in the mass range 0.8 M 8 can develop nova systems that produce 7Li and the main parameter is the fraction of these systems that actually develop nova systems and produce 7Li. The probability to form a binary system of a certain mass is weighted on the IMF as it is made of a single star with the same mass. Given our not perfect knowledge of the coupling between IMF and binaries, this method is a reasonable approximation and is similar to that developed in Matteucci & Greggio (1986) for the progenitors of SNe Ia. The maximum total mass of the binary is therefore 16. On the other hand, the minimum mass () of the binary would be 1.6; however, once we explored this parameter we obtained better results using =3. A model with =1.6 is presented to show the different outcome. The probability of configurations of primary and secondary stars are considered following this equation:
(3) where is the mass of the secondary divided by the total mass of the binary system and (Greggio & Renzini, 1983). In this way, contrary to most of the previous chemical evolution models considering lithium production from novae, we find a probability distribution of the mass of the secondary star.
-
•
7Li production takes place after the time required by the primary to evolve into a white dwarf plus a delay time which is the time the white dwarfs need to accumulate material to ignite the first nova outburst. Binaries with components of the same mass never develop a nova and, therefore, we consider 7Li producers only binaries with sufficient difference between the lifetimes of primary and secondary, namely .
-
•
Nova systems encounter several bursts along their whole life and a typical number is 104 bursts (Bath & Shaviv, 1978; Shara et al., 1986). In previous chemical evolution models, for mathematical and technical simplification a single lithium production event was considered to make the whole lithium of an entire life. In our work we improve this treatment and we consider multiple ejections instead of ejecting all the produced 7Li in as single event, as previously done. We find significant differences after considering more than a single burst. Ideally, we should take into account 104 bursts, but assuming an increasing number of ejections (up to 100), we note that these differences become negligible with more that five enrichments and to spare computational time we use five ejection events for each nova.
-
•
For the sake of simplicity, we assume that during their life all novae produce the same amount of 7Li and in all events regardless of the masses of the original binary systems, or the considered. We define this quantity and, as we will show in the next Section, the best value we find is . This simplified assumption is contradicted by present observations which show one order of magnitude difference in the novae where 7Be i.e. 7Lihas been measured. On the other hand, we prefer to keep the model as simple as possible. Moreover, this value is compatible with the observations and can be taken as a typical averaged amount.
In summary, in our model the nova nucleosynthesis of 7Li is fully described by three parameters: the delay time between the end of life of the primary star and the first nova outburst (), the number of binary systems which develop a nova () and the total 7Li produced by a nova in its lifetime .
By comparison with the observations we explore the space of these three parameters. For the parameter , we investigate timescales of 0, 1, 2 and 5 Gyr. The nova bursts probably will explode with different timescales depending on the mass loss of the secondary star, but a quantitative lower limit, i.e. the shortest timescale allowed, can be derived from the upper envelope of the data in the [Li/H] vs [Fe/H] or [Li/H] versus time.
The other two parameters, the nova yields and the nova rate , are degenerate in terms of 7Li production in the model since the total 7Li produced by a stellar generation is proportional to their product. Thus, in our modelling we keep the rate fixed and vary only . The comparison with the data is an effective constraint to their combined production. An estimation of uncertainties is obtained by applying a change of production of 33% to the standard value of = . We will also present a model with more extreme enhancement = that is able to recover the lithium abundance measured in meteorites.
The parameter varies the number of nova systems in the model results and also the number of bursts expected nowadays, assuming that each nova system produces 104 bursts. We take a value of =0.03 that provides a rate of nova bursts compatible with the yr -1 observed in the Galaxy at the present time (Shafter, 1997).
Lithium is normally destroyed inside the stars at temperatures of few million degrees and therefore the surface abundance is decreased by the stellar mixing. This process, i.e. the astration, is taken into account in our model by assuming that 7Li is destroyed completely in stars of all masses.
A known 7Li contribution comes from spallation of the cosmic rays with the nuclei in the interstellar medium. This production has a rather small impact that is not sufficient to account for all the observed lithium in our Galaxy. In our model, we consider this contribution starting from the observations of the stable isotope 9Be (Molaro et al., 1997; Smiljanic et al., 2009). 9Be is produced only by cosmic rays, and therefore by scaling this production it is possible to evaluate also the lithium production by cosmic rays. We obtain this relation for 7Li: , starting from the relation derived for 9Be by Smiljanic et al. (2009), and assuming as scaling ratio 7Li / 9Be 7.6 (Molaro et al., 1997). Their results are obtained by means of a linear fit applied to 73 stars belonging mostly to the halo (39) and the thick disk (27); only 6 stars belong to the thin disk and a star has equal chances to belong to the halo or to the thick disc. Possibly, it would be more accurate for our task to have more data for the thin disk. However, to our knowledge these are the best results available and they will have a limited impact - as we will see - on the final results for the thin disk. In Smiljanic et al. (2009), a linear fit is also computed for the thick disc. This could be specifically used for our thick disk model, but given the almost negligible difference, we keep the same prescription in both models.
Finally, also the contribution by AGB is considered. The theoretical yields computed by Ventura et al. (2013) are included in the chemical evolution model for stars in the mass range 1M6.
In the context of this paper, we made the assumption that the initial gas composition has 7Li abundance of A(Li)=2.25. This assumption is not critical as long as the reason which produces the disagreement with the Planck 7Li value does not depend on metallicity and affects all the stellar populations in the same way. To explore a possible solution for this disagreement, we also run a model with an initial A(Li)=2.6, so compatible with abundance of 7Li derived by measurements of the CMB of Planck.
2.4 Results for the thin disk
In this section we analyse the results obtained with our chemical evolution model for the thin disk.
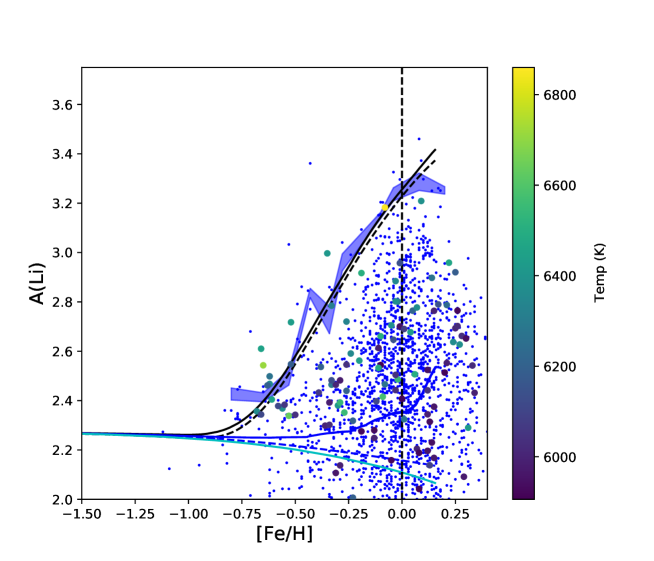
In Fig. 1 we show the thin disk chemical evolution with different 7Li factories: AGB stars, spallation of cosmic rays and novae taken separately or all together. For illustrative purposes, in the figure is also shown the extreme case where only astration is taken into account, namely when there is no 7Li production.
As displayed in Fig. 1, the AGB contribution to 7Li increases the 7Li by 0.05 dex. Therefore, we confirm that the enrichment due to AGB stars does not influence the overall chemical evolution of 7Li. This was also a result of Romano et al. (1999, 2001). We note that in the stellar evolution model considered (Ventura et al., 2013), lithium production can be activated efficiently only in intermediate mass stars ( 3), and the possible contribution from extra mixing processes in low mass red giant branch or AGB stars is not included.
The spallation of cosmic rays starts to play a role from a metallicity of [Fe/H]0.5, increasing by a factor of 2 (0.3 dex) the primordial level assumed here, and a factor of 3 (0.5 dex) compared to the lithium destroyed by astration. Thus, the total amount of 7Li is still dominated by a contribution from a different source. This was the result by Prantzos (2012).
Likely, the dominant source for 7Li is the nova contribution. In fact, the nova contribution assumed here with = and = 1 Gyr can reproduce the observed values and the general behaviour of the Galactic growth very well.
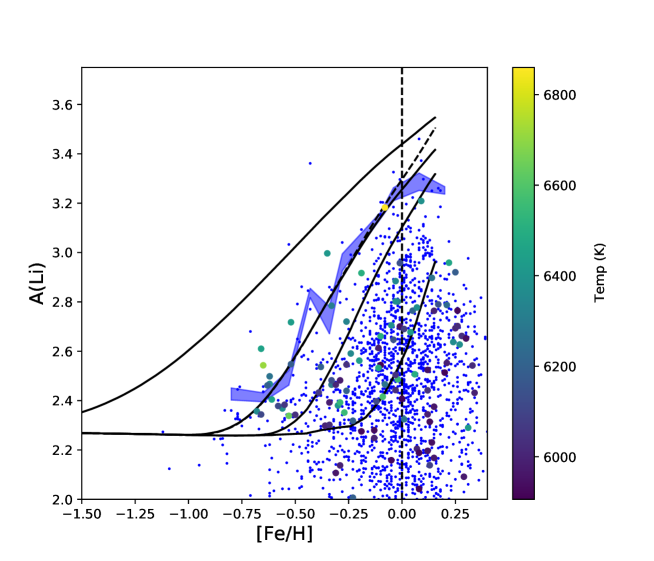
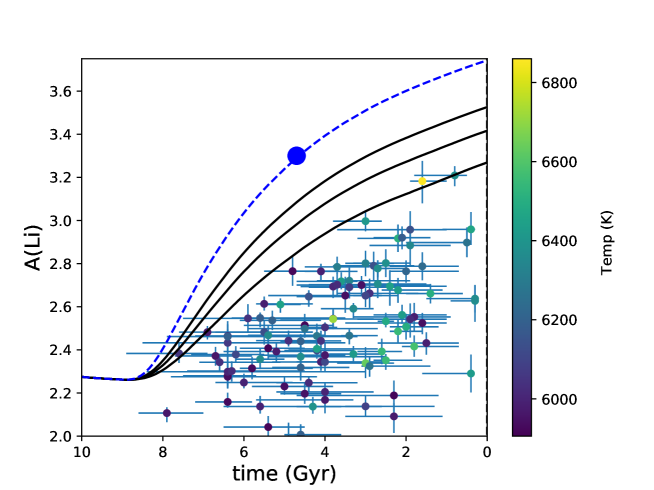
In Fig. 2 are shown the 7Li evolution results considering four different delay times for the start of 7Li enrichment, i.e. : 0, 1, 2 and 5 Gyr keeping fixed = per nova. For negligible delay-time (0 Gyr), the 7Li abundances start to rise almost immediately due to a very short time scale for the 7Li enrichment. In this case, the earliest effects are as short as 30Myr, the lifetime of a 8 star. There are some sparse data points close to this line and also above, nevertheless they are a negligible fraction and probably do not reflect the general behaviour. The concordance with the bulk of data requires a longer characteristic timescale. A timescale of 1 Gyr provides the best match to the upper envelope, whereas 2 Gyr for is slightly too long. We could actually search for the precise timescale to match the upper envelope, but given the uncertainties considered, we prefer to keep 1 Gyr as best value for . It is interesting to note that a delay of 5 Gyr is largely missing the upper envelope of the data, but still intercepts the stars with slightly lower 7Li . We can actually consider a more complex situation for the lithum chemical evolution in which stars with a lower initial value show their real initial lithium rather than a depleted value. In this case longer time-scales for could account for the observed spread below the envelope.
We also studied the impact of changing the lower limit for the mass of the binary system from 3 to 1.6 and this model is shown in Fig. 2 with a dashed line. The effects of a change at the lower end of the masses appear evident on long timescales, and indeed the trend of lithium above solar metallicity is steeper for the model with 1.6. Since the data appear not to have such steep trend, we use 3. We note that if we further increase , this will also impact the trend at intermediate metallicity (1[Fe/H]0) and will worsen the fit to the data. A possible solution would be to have mass dependent yields, but - as mentioned before - we prefer to keep modelling as simple as possible.
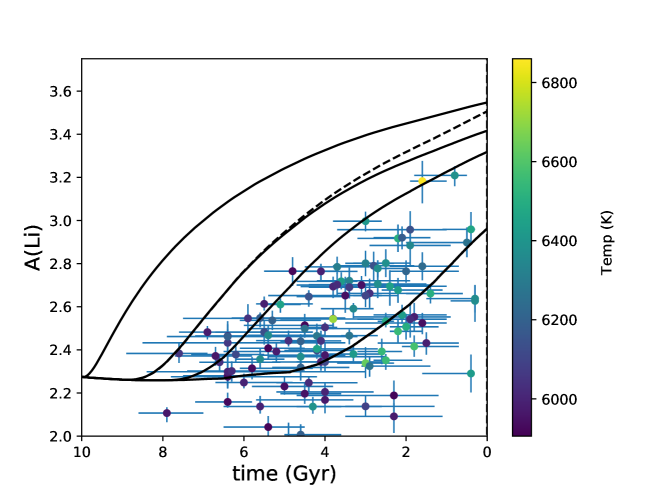
In Fig. 3, we use the ages derived for stars in Bensby, Feltzing & Oey (2014), instead of the usual proxy for the ages: [Fe/H]. In this case we cannot compute an upper envelope because of the low number of stars, but the timescale of 1 Gyr is a suitable value also in the space A(Li) vs Age. The model 2 Gyr appears the best in this plot, but we suspect that this can be due to the low number of stars available with ages. Still, this is the first time that chemical evolution model results for lithium are shown against the ages of the stars and the results are extremely good.
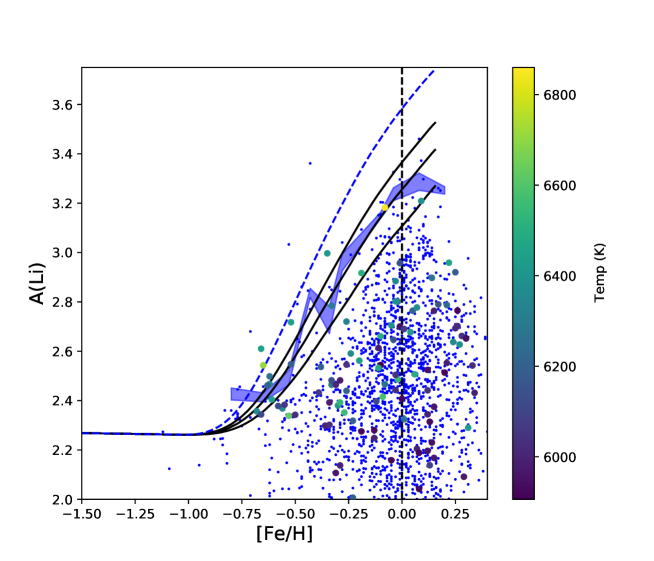
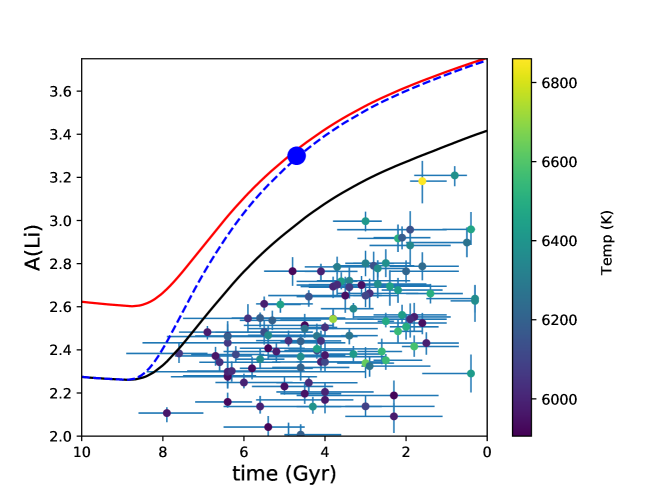
In Fig. 4, we explore the change in the evolution obtained by changing the 7Li yields. A new curve (blue line) is obtained by multiplying the standard value by a factor 2.3. We intend to study the impact of the variation of this parameter and we selected this extreme value to reproduce the solar Li abundance of 3.3 measured in meteorites formed at the time of solar system formation, 4.56 Gyr ago (cfr. Fig. 5). We note that this model overestimates the lithium abundance in all the thin disk stars, apart few extreme cases of AMBRE sample. Other two curves are instead obtained by a milder variation of 33% to the standard value of . The motivation of these new curves is to evaluate the variation needed to encompass the upper envelope of the AMBRE set of data, as shown in Fig. 4. In Fig. 4 we also note that the mild decrease of the yields mimics an increase in the but the curves are not identical and they can be discriminated in the future by an increased number of good quality observations of stars.
In Fig. 5 we show the same model results, but comparing A(Li) to ages. The model with the mildly decreased yields can intercept all the stars in the Bensby & Lind (2018) sample with very high 7Li abundance at given ages. This could be also obtained with a slightly longer , basically confirming the results in Fig. 4 using ages instead of [Fe/H].
In Fig. 5 the model with the increased by a factor of 2.3 predicts a lithium abundance too high when compared to the entire Bensby & Lind (2018) sample and matches only the solar system abundance measured in meteorites (by construction). We present a possible explanation to this problem, the solar lithium problem, in Sect. 2.4.1.
In summary, the model for the thin disk provides a of 1 Gyr, and an effective nova yield of showing that, apart from a relatively small contribution from cosmic rays and an even smaller contribution from AGB stars, the bulk of Galactic 7Li can be consistently made by novae which are able to provide not only the amount of 7Li at the end of the evolution but also the rate of increase of this element in the thin disk during its chemical evolution.
2.4.1 The solar lithium problem
As mentioned in the previous section, our model tuned for stellar observations fails to match the solar value. Only by increasing the effective yields by a factor of 2.3 the model reaches the solar abundance measured in meteorites. However, the meteorites value and the stellar determination may differ since they are obtained with different techniques and at two different moments of the stellar life and may not be directly comparable. In particular, the meteoritic value is not affected by pre main sequence depletion, contrary to stellar measurements (Molaro et al., 2012; Fu et al., 2015; Thévenin et al., 2017). In Fig. 6, we present a possible solution. The model pre-main sequence depletion (red line) is obtained increasing again by 2.3 times the yields from novae, so =4.14 , but starting from a primordial A(Li)=2.6 taken by the Big Bang nucleosynthesis. Interestingly, the meteorites value is matched and the model is also able to reach the lithium abundance in TTauri stars, extremely young objects.
Therefore, if we consider a simplified assumption that all stars suffer a depletion of approximately 0.35 dex during the pre-main sequence, the model falls back to the standard case (black line). If this is the case, the real effective yields from novae should be approximately 2 times larger than the obtained from stellar constraints and - according to our computation -= . We note that this value is still within the uncertainties of the lithium production from novae bursts.
3 7Li Galactic Chemical evolution of the thick disk
3.1 The Galactic thick disk
The Milky Way, like almost two thirds of disk galaxies, has two major disk components, the thin and the thick one with different histories and formation (Gilmore & Reid, 1983). At the solar vicinity, the thick disk dominates the stellar population at distances between 1 and 5 kpc above the Galactic plane and it is generally accepted to be the oldest part of the disk, i.e. older than 8-9 Gyr. The mechanism of formation of the thick disk is still debated. The proposed scenario includes vertical heating from infalling satellites (Quinn, Hernquist & Fullagar, 1993; Villalobos & Helmi, 2008), turbulent gas-rich disk phase at high redshift (Bournaud, Elmegreen & Martig, 2009; Forbes, Krumholz & Burkert, 2012), and massive gas rich satellites (Brook et al., 2005). Formation of thick disks by radial migration was also proposed as a mechanism by Schönrich & Binney (2009). This idea was challenged by Minchev et al. (2012), demonstrating that migrators in N-body models do not have any significant effect on disk thickening. Several groups have now supported these findings in more recent works (Martig, Minchev & Flynn, 2014; Grand et al., 2016), establishing this as a generic result of disk dynamics. In the most recently proposed model for the formation of thick disks by Minchev et al. (2015, 2017), it is shown that in galactic disks formed inside-out, mono-age populations (groups of coeval stars) are well fitted by single exponentials and always flare (the disk thickness increases with radius). In contrast, when the total stellar density is considered, a sum of two exponentials is required for a good fit, resulting in thin and thick disks which do not flare. Such a scenario explains why chemically- or age-defined thick disks are centrally concentrated (Bensby et al., 2011; Bovy et al., 2012), but geometrically thick populations in both observations of external edge-on galaxies (Comerón et al., 2012) and in the Milky Way (Robin et al., 1996; Jurić et al., 2008) extend beyond the thinner component. From this scenario, thick disk stars at the solar vicinity are the oldest mono-age populations.
3.2 7Li in thick disk stars
The first attempt to measure Li in thick disk stars was made by Molaro, Bonifacio & Pasquini (1997), who measured Li in seven metal poor thick disk stars and found an abundance of Li consistent with that of the halo stars. Romano et al. (1999) used the kinematical properties to separate the thin disk from the thick disk stars. In their sample there is also a thick disk star BD+01 3421 with [Fe/H]=0.5, but with a lithium abundance of A(Li)=2.11 which is much lower than the Li abundance of thin disk stars of similar metallicity. The lack of increase increase of Li abundance among the thick disk stars was established by Ramírez et al. (2012) on a larger data sample showing that the maximum thick disk lithium abundances remain close to the Spite plateau regardless of their metallicity. Delgado Mena et al. (2015) and Bensby & Lind (2018) even suggested that the thick disk lithium abundances decrease with increasing metallicity. Guiglion et al. (2016) used the AMBRE catalogue composed of stars and found that the highest lithium abundances seem to increase slightly with [Fe/H], from about Li = 2.0 up to 2.4 dex at [Fe/H]=-0.3. In the AMBRE sample the distribution of Li abundances in the thick disk clusters is at and dex, respectively. The higher value seems to correspond to an extension of the Spite plateau, while the lower values are likely due to lithium destruction in stellar interior. Fu et al. (2018) investigated the Li enrichment in the sample of 1399 stars of the CES iDR4 sample. By means of the chemical division proposed by Adibekyan et al. (2012), they identified 73 stars belonging to the thick disc. However, these generally have a relatively higher abundance of A(Li) 2.4, and possibly a modest rise at the highest metallicity.
3.3 7Li evolution model for the thick disk
In this Section, we probe the hypothesis that novae are the main Li source also in the thick disk by using the parameters that reproduce at best the lithium evolution in thin disk. We use the standard model and we do not test the pre-main sequence depletion model. In fact, given the available constraints, we prefer to adopt the model able to reproduce the stellar observations. In our model the thick and thin disks evolve independently from each other without any exchange of gas or stars. Our approach is similar to that followed by Grisoni et al. (2017) for the [/elements]. Instantaneous recycling is relaxed and the stellar lifetimes are taken into account as for our thin disk model.
The thick disk is characterised by a more intense star formation history than the thin disk. There is a quicker evolution with a stronger efficiency (=3) and a shorter time scale of 0.1 Gyr for infall. The chemical evolution lasts for 2 Gyr, but with only residual star formation after approximately 1.2 Gyr. These parameters are well suited to account for the oldest mono-age populations, following the scenario presented in Minchev et al. (2017). For the rest, the model is identical to that of the thin disk.
3.4 Results for the thick disc
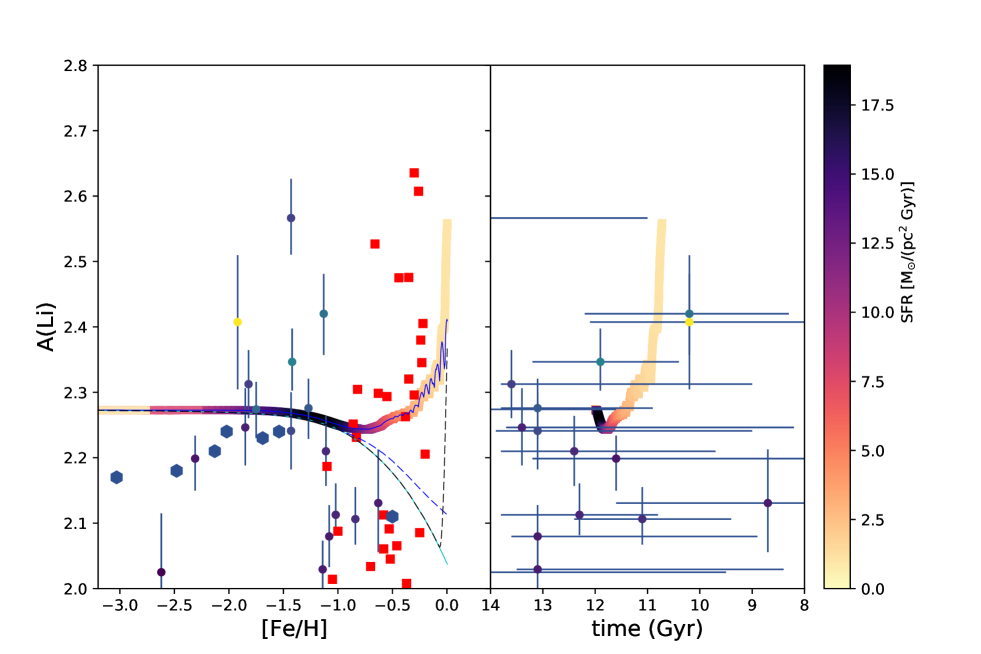
Our model with of 1 Gyr, and with the same Li yields derived for the thin disk stars predicts no increase in the 7Li abundance for thick disk stars up to [Fe/H]=0.2. This is because the time of the evolution of the thick disk is shorter than the characteristic time in which novae start to contribute with Li. At variance with the thin disk evolution our model for the thick disk predicts no Li increase in excellent agreement with the observational result. Actually, if we consider only novae production, 7Li should decrease and is kept about constant under the action of spallation processes that is the only active nucleosynthetic process in the thick disk. Bensby & Lind (2018) for the first time provide an age estimation for the thick disk stars. These ages are compatible with an old thick disk as we have assumed in our model. We note however that some stars have relatively younger ages (and fewer ones older). We cannot explain the ages of this younger population. They can be due to a false thick disk identification or a problem in measuring the ages. Our model produces a thick disk in a relatively short time-scale of 2 Gyr. Thus, assuming that the formation of the thick disk started 12 Gyr ago, its star formation was over about 10 Gyr ago. Following Bensby & Lind (2018) we consider bona fide thick disk stars the ones with an age greater than 8 Gyr. The result of our model for the thick disk in the A(Li) vs age space is shown in Fig. 7. Given the uncertainties in the age determination there is a substantial agreement with the model.
At the high metallicity end [Fe/H]=0.2 our model predicts a sharp increase of the 7Li abundance reaching values up to A(Li)2.6. This is because novae start to contribute significantly. However, the very mild SFR that characterises this phase would effectively mark the end of stellar formation of the thick disk. Our threshold for stellar formation is conservatively set at 1 , while, for comparison, was set to 4 in Chiappini, Matteucci & Gratton (1997) for the thick-halo phase. It is not clear whether there is a real chance to find stars of the thick disk in this area, but if they are, according to our model, they should show relatively higher Li abundances than the average of thick disk stars.
4 Conclusion
The idea that nova systems could produce lithium dates back to the mid 70s by Arnould & Norgaard (1975) and Starrfield et al. (1978). They applied to the novae the idea put forward by Cameron-Fowler (Cameron & Fowler, 1971) to explain high 7Li abundances in some luminous red giants. This possibility was then incorporated in the Galactic chemical 7Li evolution models by D’Antona & Matteucci (1991) and Romano et al. (1999) together with other possible Li sources to explain the 7Li behaviour. However, the non detection of the 7Li i line in the novae outbursts led these authors to favour low mass red giants as the most likely Li source (Romano et al., 2001; Prantzos et al., 2017). Observational evidence has been found only recently with the systematic detection of the mother nuclei 7Be in the post-outburst spectra of classical novae by Tajitsu et al. (2015), Tajitsu et al. (2016), Molaro et al. (2016), Izzo et al. (2018) and Selvelli, Izzo & Molaro (2018). The observed 7Be decays into 7Li with a mean-life of 53 days and all observed 7Be decays into 7Li. Moreover, the 7Be/H has been measured with abundances that are higher than the novae theoretical models and provide overproduction factors between 4 and 5 dex over the meteoritic abundance of 7Li. The total amount of 7Li produced by a nova is quite uncertain since it depends on the ejected mass and on the number of outbursts a novae experiences in its whole life.
In this paper we have revised the 7Li evolution by considering these most recent observations. By means of a detailed chemical evolution model for the thin disk we have shown that nova systems start to enrich the interstellar 7Li with a delay of about 1 Gyr. In order to match the increase of Galactic 7Li observed in the thin disk, an effective yield of of 7Li per nova in a whole life is required. It is quite remarkable that this value is consistent with what inferred in novae outbursts. Considering that there is an average 7Li mass ejection of in a nova event and that there are about 104 events per nova, we obtain a yield of per nova, which is remarkably close to our model derived yields considering the uncertainties in all parameters. This model is tuned to reproduce the Li observations in stars and fails to reproduce the meteoritic-solar value 4.56 Gyrs ago. However, it has been suggested that stellar abundances could have been affected by pre-main sequence destruction (Molaro et al., 2012; Fu et al., 2015; Thévenin et al., 2017). In this context, we are able to reproduce the stellar trend increasing by two the standard effective yields, starting from the primordial value inferred by big bang nucleosynthesis and assuming a depletion of 0.35 dex during the pre-main sequence. This pre-main sequence depletion model matches the lithium abundance measured in the meteorites and young TTauri stars.
We have also applied the parameters derived from the thin disk 7Li evolution to a model for the thick disk. In this way we have shown that assuming the classical novae as the main 7Li factory we can also explain the absence of any 7Li enhancement observed in the thick disk stars. We have found that the 7Li does not decrease due to astration thanks to spallation processes, that is the only active nucleosynthetic process in the thick disk. Thus, the 7Li abundance can be used as a test to confirm or to reject the belonging to the thick disk population. This can be considered as a new criterium to be used in combination with the more popular -knee.
Extrapolating these results to the dwarf galaxies satellites of our Milky Way, we expect the 7Li abundances in stars to show an enhancement in 7Li only for those galaxies with a star formation history long enough to provide novae products to contribute to the gas enrichments. Thus, no 7Li abundance above A(Li)= 2.3 is expected in very small objects as ultra faint galaxies which evolve in short time scales relative to the novae evolution. An important test will be the Galactic Bulge which is likely to fall into this category, at least its older and metal-poor population (Cescutti, Chiappini & Hirschi, 2018). We intend to extend our prediction also to this structure of the Milky Way as soon as we have new 7Li abundance determinations in stars belonging to this component.
Acknowledgments
GC and PM thank Thomas Bensby, Xiaoting Fu and Guillaume Guiglion for sharing their data and useful discussions. GC also thanks Ivan Minchev for his advice in the section of the thick disk. G.C. acknowledges financial support from the European Union Horizon 2020 research and innovation programme under the Marie Skłodowska-Curie grant agreement No. 664931. This work has been partially supported by the the EU COST Action CA16117 (ChETEC).
References
- Adibekyan et al. (2012) Adibekyan V. Z., Sousa S. G., Santos N. C., Delgado Mena E., González Hernández J. I., Israelian G., Mayor M., Khachatryan G., 2012, A&A, 545, A32
- Alibés, Labay & Canal (2002) Alibés A., Labay J., Canal R., 2002, ApJ, 571, 326
- Arnould & Norgaard (1975) Arnould M., Norgaard H., 1975, A&A, 42, 55
- Bath & Shaviv (1978) Bath G. T., Shaviv G., 1978, MNRAS, 183, 515
- Bensby et al. (2011) Bensby T., Alves-Brito A., Oey M. S., Yong D., Meléndez J., 2011, ApJ, 735, L46
- Bensby, Feltzing & Oey (2014) Bensby T., Feltzing S., Oey M. S., 2014, A&A, 562, A71
- Bensby & Lind (2018) Bensby T., Lind K., 2018, ArXiv e-prints
- Bournaud, Elmegreen & Martig (2009) Bournaud F., Elmegreen B. G., Martig M., 2009, ApJ, 707, L1
- Bovy et al. (2012) Bovy J., Rix H.-W., Liu C., Hogg D. W., Beers T. C., Lee Y. S., 2012, ApJ, 753, 148
- Brook et al. (2005) Brook C. B., Gibson B. K., Martel H., Kawata D., 2005, ApJ, 630, 298
- Cameron & Fowler (1971) Cameron A. G. W., Fowler W. A., 1971, ApJ, 164, 111
- Casey et al. (2016) Casey A. R. et al., 2016, MNRAS, 461, 3336
- Cayrel (1998) Cayrel R., 1998, Space Sci. Rev., 84, 145
- Cescutti, Chiappini & Hirschi (2018) Cescutti G., Chiappini C., Hirschi R., 2018, in IAU Symposium, Vol. 334, Rediscovering Our Galaxy, Chiappini C., Minchev I., Starkenburg E., Valentini M., eds., pp. 94–97
- Chiappini, Matteucci & Gratton (1997) Chiappini C., Matteucci F., Gratton R., 1997, ApJ, 477, 765
- Comerón et al. (2012) Comerón S. et al., 2012, ApJ, 759, 98
- Cyburt, Fields & Olive (2003) Cyburt R. H., Fields B. D., Olive K. A., 2003, Physics Letters B, 567, 227
- D’Antona & Matteucci (1991) D’Antona F., Matteucci F., 1991, A&A, 248, 62
- Delgado Mena et al. (2015) Delgado Mena E. et al., 2015, A&A, 576, A69
- Forbes, Krumholz & Burkert (2012) Forbes J., Krumholz M., Burkert A., 2012, ApJ, 754, 48
- Fu et al. (2015) Fu X., Bressan A., Molaro P., Marigo P., 2015, MNRAS, 452, 3256
- Fu et al. (2018) Fu X. et al., 2018, A&A, 610, A38
- Gilmore & Reid (1983) Gilmore G., Reid N., 1983, MNRAS, 202, 1025
- Grand et al. (2016) Grand R. J. J., Springel V., Gómez F. A., Marinacci F., Pakmor R., Campbell D. J. R., Jenkins A., 2016, MNRAS, 459, 199
- Greggio & Renzini (1983) Greggio L., Renzini A., 1983, A&A, 118, 217
- Grisoni et al. (2017) Grisoni V., Spitoni E., Matteucci F., Recio-Blanco A., de Laverny P., Hayden M., Mikolaitis Ŝ., Worley C. C., 2017, MNRAS, 472, 3637
- Guiglion et al. (2016) Guiglion G., de Laverny P., Recio-Blanco A., Worley C. C., De Pascale M., Masseron T., Prantzos N., Mikolaitis Š., 2016, A&A, 595, A18
- Hernanz et al. (1996) Hernanz M., Jose J., Coc A., Isern J., 1996, ApJ, 465, L27
- Iwamoto et al. (1999) Iwamoto K., Brachwitz F., Nomoto K., Kishimoto N., Umeda H., Hix W. R., Thielemann F.-K., 1999, ApJS, 125, 439
- Izzo et al. (2015) Izzo L. et al., 2015, ApJ, 808, L14
- Izzo et al. (2018) Izzo L. et al., 2018, MNRAS
- José & Hernanz (1998) José J., Hernanz M., 1998, ApJ, 494, 680
- Jurić et al. (2008) Jurić M. et al., 2008, ApJ, 673, 864
- Kobayashi, Karakas & Umeda (2011) Kobayashi C., Karakas A. I., Umeda H., 2011, MNRAS, 414, 3231
- Krankowsky & Müller (1964) Krankowsky D., Müller O., 1964, Geochim. Cosmochim. Acta, 28, 1625
- Kroupa (2001) Kroupa P., 2001, MNRAS, 322, 231
- Lattanzio et al. (2015) Lattanzio J. C., Siess L., Church R. P., Angelou G., Stancliffe R. J., Doherty C. L., Stephen T., Campbell S. W., 2015, MNRAS, 446, 2673
- Lind et al. (2009) Lind K., Primas F., Charbonnel C., Grundahl F., Asplund M., 2009, A&A, 503, 545
- Lodders, Palme & Gail (2009) Lodders K., Palme H., Gail H.-P., 2009, Landolt Börnstein
- Lyubimkov (2016) Lyubimkov L. S., 2016, Astrophysics, 59, 411
- Martig, Minchev & Flynn (2014) Martig M., Minchev I., Flynn C., 2014, MNRAS, 443, 2452
- Matteucci, D’Antona & Timmes (1995) Matteucci F., D’Antona F., Timmes F. X., 1995, A&A, 303, 460
- Matteucci & Greggio (1986) Matteucci F., Greggio L., 1986, A&A, 154, 279
- Meynet & Maeder (2002) Meynet G., Maeder A., 2002, A&A, 390, 561
- Minchev et al. (2012) Minchev I., Famaey B., Quillen A. C., Dehnen W., Martig M., Siebert A., 2012, A&A, 548, A127
- Minchev et al. (2015) Minchev I., Martig M., Streich D., Scannapieco C., de Jong R. S., Steinmetz M., 2015, ApJ, 804, L9
- Minchev et al. (2017) Minchev I., Steinmetz M., Chiappini C., Martig M., Anders F., Matijevic G., de Jong R. S., 2017, ApJ, 834, 27
- Molaro et al. (1997) Molaro P., Bonifacio P., Castelli F., Pasquini L., 1997, A&A, 319, 593
- Molaro, Bonifacio & Pasquini (1997) Molaro P., Bonifacio P., Pasquini L., 1997, MNRAS, 292, L1
- Molaro et al. (2012) Molaro P., Bressan A., Barbieri M., Marigo P., Zaggia S., 2012, Memorie della Societa Astronomica Italiana Supplementi, 22, 233
- Molaro et al. (2016) Molaro P., Izzo L., Mason E., Bonifacio P., Della Valle M., 2016, MNRAS, 463, L117
- Planck Collaboration et al. (2016) Planck Collaboration et al., 2016, A&A, 594, A13
- Prantzos (2012) Prantzos N., 2012, A&A, 542, A67
- Prantzos et al. (2017) Prantzos N., de Laverny P., Guiglion G., Recio-Blanco A., Worley C. C., 2017, A&A, 606, A132
- Quinn, Hernquist & Fullagar (1993) Quinn P. J., Hernquist L., Fullagar D. P., 1993, ApJ, 403, 74
- Ramírez et al. (2012) Ramírez I., Fish J. R., Lambert D. L., Allende Prieto C., 2012, ApJ, 756, 46
- Rebolo, Beckman & Molaro (1988) Rebolo R., Beckman J. E., Molaro P., 1988, A&A, 192, 192
- Robin et al. (1996) Robin A. C., Haywood M., Creze M., Ojha D. K., Bienayme O., 1996, A&A, 305, 125
- Romano et al. (2010) Romano D., Karakas A. I., Tosi M., Matteucci F., 2010, A&A, 522, A32+
- Romano et al. (1999) Romano D., Matteucci F., Molaro P., Bonifacio P., 1999, A&A, 352, 117
- Romano et al. (2001) Romano D., Matteucci F., Ventura P., D’Antona F., 2001, A&A, 374, 646
- Sackmann & Boothroyd (1999) Sackmann I.-J., Boothroyd A. I., 1999, ApJ, 510, 217
- Schönrich & Binney (2009) Schönrich R., Binney J., 2009, MNRAS, 396, 203
- Selvelli, Izzo & Molaro (2018) Selvelli P., Izzo L., Molaro P., 2018, in prep.
- Shafter (1997) Shafter A. W., 1997, ApJ, 487, 226
- Shara et al. (1986) Shara M. M., Livio M., Moffat A. F. J., Orio M., 1986, ApJ, 311, 163
- Siess & Livio (1999) Siess L., Livio M., 1999, MNRAS, 304, 925
- Smiljanic et al. (2018) Smiljanic R. et al., 2018, ArXiv e-prints
- Smiljanic et al. (2009) Smiljanic R., Pasquini L., Bonifacio P., Galli D., Gratton R. G., Randich S., Wolff B., 2009, A&A, 499, 103
- Smith & Lambert (1989) Smith V. V., Lambert D. L., 1989, ApJ, 345, L75
- Smith & Lambert (1990) Smith V. V., Lambert D. L., 1990, ApJS, 72, 387
- Spite & Spite (1982) Spite F., Spite M., 1982, A&A, 115, 357
- Starrfield et al. (1978) Starrfield S., Truran J. W., Sparks W. M., Arnould M., 1978, ApJ, 222, 600
- Tajitsu et al. (2015) Tajitsu A., Sadakane K., Naito H., Arai A., Aoki W., 2015, Nature, 518, 381
- Tajitsu et al. (2016) Tajitsu A., Sadakane K., Naito H., Arai A., Kawakita H., Aoki W., 2016, ApJ, 818, 191
- Tanabashi et al. (2018) Tanabashi M. et al., 2018, Phys. Rev. D, 98, 030001
- Thévenin et al. (2017) Thévenin F., Oreshina A. V., Baturin V. A., Gorshkov A. B., Morel P., Provost J., 2017, A&A, 598, A64
- Travaglio et al. (2001) Travaglio C., Randich S., Galli D., Lattanzio J., Elliott L. M., Forestini M., Ferrini F., 2001, ApJ, 559, 909
- Ventura et al. (2013) Ventura P., Di Criscienzo M., Carini R., D’Antona F., 2013, MNRAS, 431, 3642
- Villalobos & Helmi (2008) Villalobos Á., Helmi A., 2008, MNRAS, 391, 1806
- Yan et al. (2018) Yan H.-L. et al., 2018, Nature Astronomy