A Redshift Survey of the Nearby Galaxy Cluster Abell 2107: Global Rotation of the Cluster and its Connection to Large-scale Structures in the Universe
Abstract
We study the rotational motion of the galaxy cluster Abell 2107 at redshift and its connection to nearby large-scale structures using a large amount of spectroscopic redshift data. By combining 978 new redshifts from the MMT/Hectospec observations with data in the literature, we construct a large sample of 1968 galaxies with measured redshifts at clustercentric radius . Our sample has high (80%) and spatially uniform completeness at -band apparent magnitude . We first apply the caustic method to the sample and identify 285 member galaxies of Abell 2107 at . Then the rotation amplitude and the position angle of rotation axis are measured. We find that the member galaxies show strong global rotation at (0.6) with a significance of , which is confirmed by two independent methods. The rotation becomes weaker in outer regions. There are at least five filamentary structures that are connected to the cluster and that consist of known galaxy groups. These structures are smoothly connected to the cluster, which seem to be inducing the global rotation of the cluster through inflow of galaxies.
1 INTRODUCTION
Galaxy clusters are the largest gravitationally bound systems in the universe, which are often formed in places where large-scale filaments meet. Matter accretes into a cluster through such filaments that are stretched to different directions. As a result, there is usually no preferred direction in the motion of the matter in clusters, which means that, overall, cluster galaxies present random motions. This is why clusters are generally considered as a pressure-supported system rather than a rotation-supported system. However, several observational studies found some clusters with non-negligible global rotation (Materne & Hopp, 1983; Oegerle & Hill, 1992; Tovmassian, 2002; Kalinkov et al., 2005; Hwang & Lee, 2007; Hand et al., 2012; Tovmassian, 2015; Manolopoulou & Plionis, 2017).
The observed global rotation of clusters has been inferred from spatial segregation of velocity of cluster galaxies (Oegerle & Hill, 1992), or velocity gradient with respect to either clustrocentric distance along an axis (Kalinkov et al., 2005) or position angle (Hwang & Lee, 2007). However, some studies suggest that such observations could be explained by mechanisms other than cluster rotation. One of them is the presence of substructures that overlap along the line-of-sight direction. It is not easy to distinguish the two cases: a single rotating cluster vs. a system with two overlapping clusters. Nevertheless, there are several clusters that show the spatially segregated velocity structure or velocity gradient without strong evidence of subclustering, which is consistent with cluster rotation. For example, Abell 2107 (A2107 hereafter), first claimed by Oegerle & Hill (1992) as a rotating cluster, shows a Gaussian velocity distribution, modest velocity dispersion, and a single number-density peak, which strongly suggest that A2107 is a single cluster in rotation. Hwang & Lee (2007) have identified six probable rotating clusters that show spatial segregation of galaxy velocities with a single number-density peak from the sample of 899 clusters in the Sloan Digital Sky Survey (SDSS, York et al. 2000). Although the number of rotating clusters is not so large, the global rotation can affect the cluster mass measurement that is usually based on the assumption of no rotation in clusters (e.g. Limber & Mathews, 1960; The & White, 1986; Merritt, 1988; Diaferio & Geller, 1997a; Diaferio, 1999) and the measurement of the kinetic Sunyaev-Zel’dovich effect (e.g. Cooray & Chen, 2002; Chluba & Mannheim, 2002).
There are several methods to measure the global rotation of clusters (Kalinkov et al., 2005; Hwang & Lee, 2007; Manolopoulou & Plionis, 2017). Each method has its own pros and cons, but all of them are limited by the projection effect; it is difficult to know the direction of the three-dimensional rotation axis. To quantify well the global rotation of clusters under such limitation, it is important to use a dense sample of cluster galaxies (Takizawa, 2000; Manolopoulou & Plionis, 2017). Moreover, a velocity field of a cluster is a combination of random motion and ordered rotational motion, and thus the signal of the rotational motion could be noisy. This could be overcome through dense sampling as well. We therefore observe the well-known relaxed, rotating cluster A2107 to densely sample the galaxies around the cluster at clustercentric radius (2.06Mpc). The resulting sampling density of our survey by combining the data in the literature is more than twice denser than the ones in previous studies.
Another important issue regarding the cluster rotation is to understand the origin of the rotation. Theoretically, off-axis merging of two clusters (Peebles, 1969; Ricker, 1998; Takizawa, 2000; Roettiger & Flores, 2000), global rotation of the universe (Li, 1998), and mass accretion from surrounding large-scale structures can be responsible for the acquired angular momentum of clusters. The off-axis merging scenario could be examined by the study of merging history with X-ray data. A2107 has been known to have a regular X-ray morphology (Buote & Tsai, 1996, see contours in Figure 1 of this study) without strong evidence of merging (Fujita et al., 2006; Laganá et al., 2010). However, detailed analysis of the X-ray data (e.g. temperature map) is limited only to the central region (). This makes it difficult for us to fully understand the kinematics of the intracluster medium (ICM) of A2107, which is crucial for predicting the merging history. On the other hand, if the universe is globally rotating, it is expected that celestial objects obtain angular momentum upon their formation (Li, 1998; Godłowski et al., 2003). This theory predicts a correlation between the angular momentum and the mass of the system. To test the prediction from this theory about cluster rotation (i.e. rotation induced by the global rotation of the universe), we need data for many clusters over a wide range of masses; this requires a systematic survey of clusters. The third scenario for the origin of the cluster rotation (i.e. mass accretion from surrounding large-scale structures) could be tested with wide-field spectroscopic survey data. Thanks to large surveys including SDSS and 2dF Galaxy Redshift Survey (2dFGRS, Colless et al. 2001), we are in a good position to investigate this possibility.
In this study, we aim to better measure the global rotation of A2107 using the dense sample of galaxies from our redshift survey. With a focus on the mass accretion from large-scale structures as a possible origin of the cluster rotation, we will examine velocity fields of the large-scale structures around A2107 and their connections to the cluster using the combined data of the SDSS and our MMT/Hectospec observations. We also search for counterparts of the structures among known galaxy groups and clusters in SDSS.
This paper is part of the KIAS redshift survey of nearby galaxy groups and clusters, which aims to construct dense samples of group/cluster galaxies for the studies of kinematics and stellar populations (Song et al., 2017; Deshev et al., 2017; Park et al., 2018). This paper is constructed as follow. In Section 2, we describe the observational data obtained from the MMT/Hectospec redshift survey. We determine the cluster membership in Section 3, and present the results from the analysis of global rotation of A2107 in Section 4. We discuss the origin of angular momentum in the cluster in Section 5, and summarize the results in Section 6. Throughout, we adopt flat CDM cosmological parameters: km s-1 Mpc-1, , and . All quoted errors in measured quantities are 1.
2 DATA
2.1 Photometric Data
We select targets for spectroscopic observations from the photometric data of the SDSS data release 12 (DR12; Alam et al., 2015). The goal of the spectroscopic survey in this study is to cover the large area around A2107 with high completeness and uniformity. To achieve this goal, we select galaxies without measured redshifts in the literature from the photometric data (i.e. extended sources based on the probPSF parameter in the SDSS database ; see Section 4.2 of Strauss et al. 2002 for the star-galaxy separation in detail), and impose no selection criteria other than magnitude; we assign higher priority to brighter galaxies in -band apparent magnitude ().111 The first and second subscripts denote a photometric band and a model used to measure magnitudes, respectively. The subscript 0 of magnitudes represents magnitudes after the Galactic extinction correction.
2.2 Spectroscopic Observations and Data Reduction
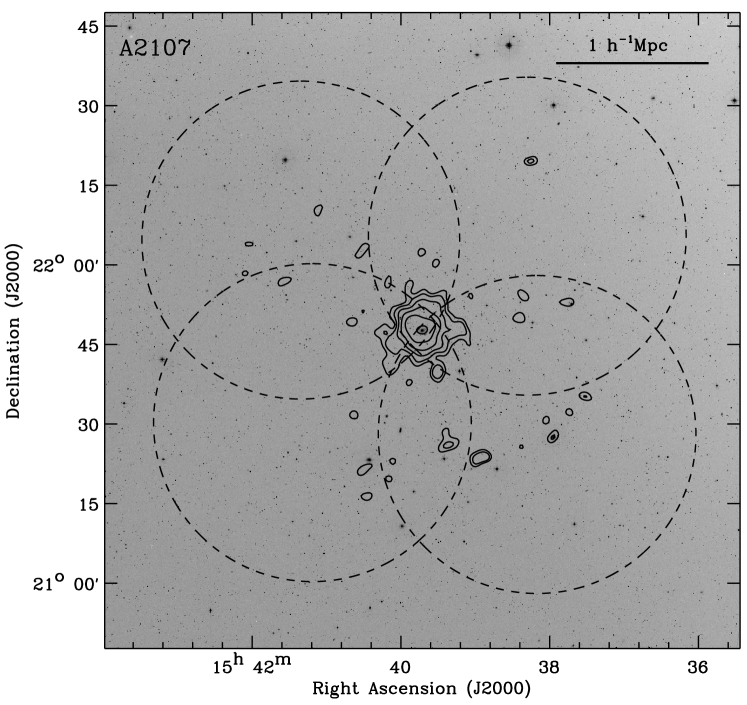
We use the Hectospec installed on the MMT 6.5m telescope for spectroscopic observations (Fabricant et al., 1998, 2005). The Hectospec is a 300 fiber multi-object spectrograph with a circular field of view (FOV) of diameter. We use the 270 line mm-1 grating of Hectospec that provides a dispersion of 1.2 pixel-1 and a resolution of 6. We observe four fields with 315 (or 20) minute exposure each, and obtained spectra covering the wavelength range 3500–9150. To cover the large area around A2107, we positioned the four fields around the cluster as shown in Figure 1 (dashed circles). The positions of the four MMT/Hectospec fields and the numbers of targets are summarized in Table 1.
We reduce the Hectospec spectra with HSRED v2.0, which is an updated reduction pipeline originally developed by Richard Cool. We then use RVSAO (Kurtz & Mink, 1998) to determine the redshifts by cross-correlating the spectra with templates. RVSAO gives the Tonry & Davis (1979)’s -value for each spectrum, which is an indicator of cross-correlation reliability; we select only those galaxies with , consistent with the limit confirmed by visual inspection (Geller et al., 2014b, 2016). In the end, we obtain 978 reliable redshifts from the observations of 1023. The main reason why we could not determine the reliable redshifts for the 45 objects is because of their spectra with low signal-to-noise ratios. We combine these data with those from the SDSS DR12 (Alam et al., 2015) and from the literature. In total, we have 1968 redshifts at : 978 from our MMT/Hectospec observations, 977 from the SDSS DR12, five from Cava et al. (2009), three from Oegerle & Hill (1992), three from Smith et al. (2004), one from White et al. (2000), and one from the FAST Spectrograph Archive.222 http://tdc-www.harvard.edu/cgi-bin/arc/fsearch
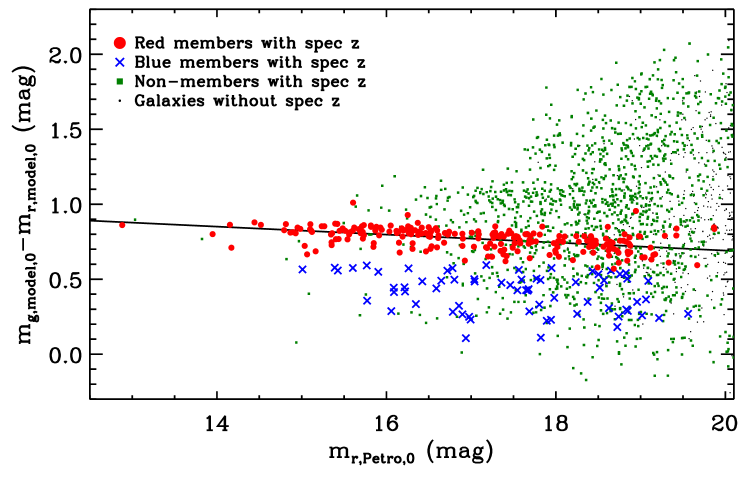
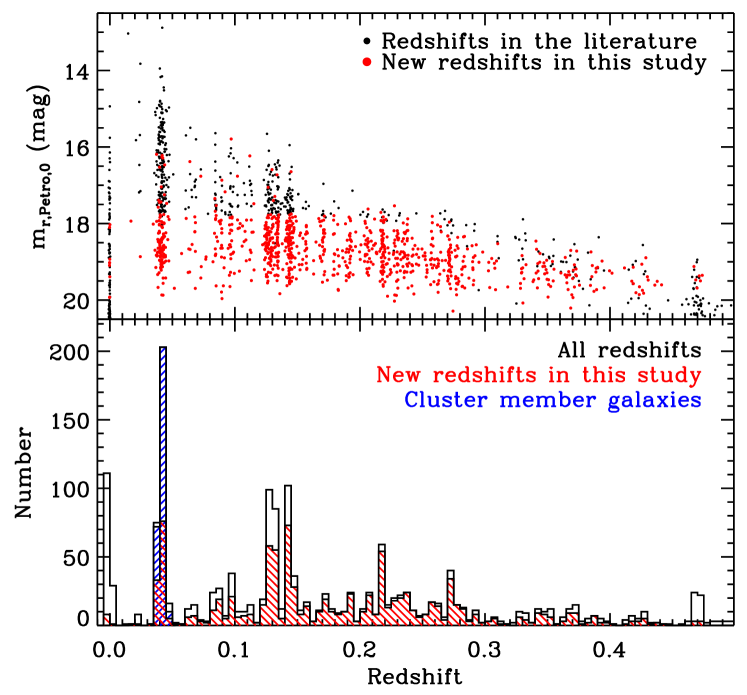
Figure 2 shows a color-magnitude distribution of the objects at . Galaxies with measured redshifts are denoted by symbols in color, while those without spectra are denoted by black dots. Because we have not imposed any selection criteria for the targets of spectroscopic observations (See Section 2.1), colored symbols (red filled circles, blue crosses, and green squares) cover the whole color range without having any exclusion region. Their distribution clearly shows the red sequence of A2107. We use the cluster member galaxies (see Section 3 for the member selection) to determine the best-fit relation of the red sequence, which is
| (1) |
(solid black line in Figure 2). The rms scatter around this relation is 0.056 mag. We divide cluster member galaxies into red (red dots) and blue (blue crosses) populations using the line blueward of the best-fit red-sequence relation (Sánchez-Blázquez et al., 2009; Rines et al., 2013; Geller et al., 2014a; Hwang et al., 2014). Green squares are foreground or background galaxies.
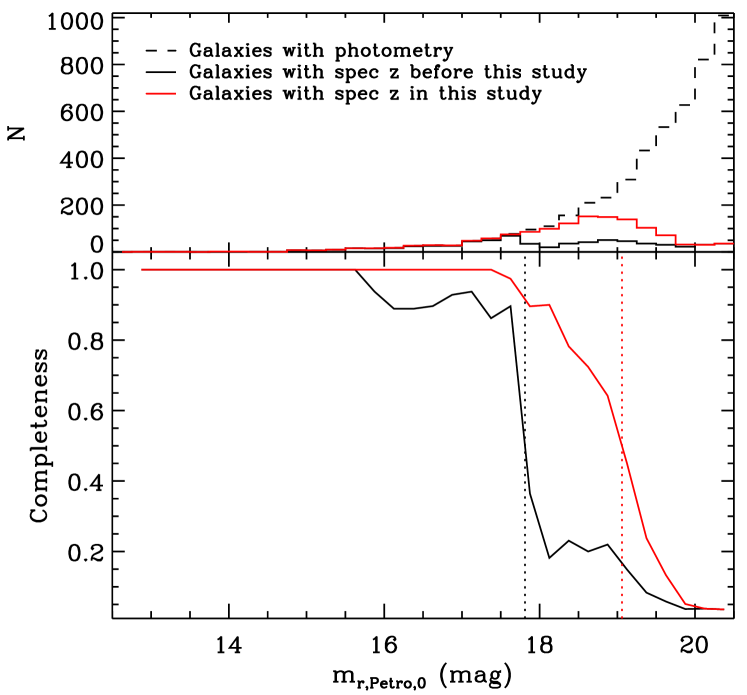
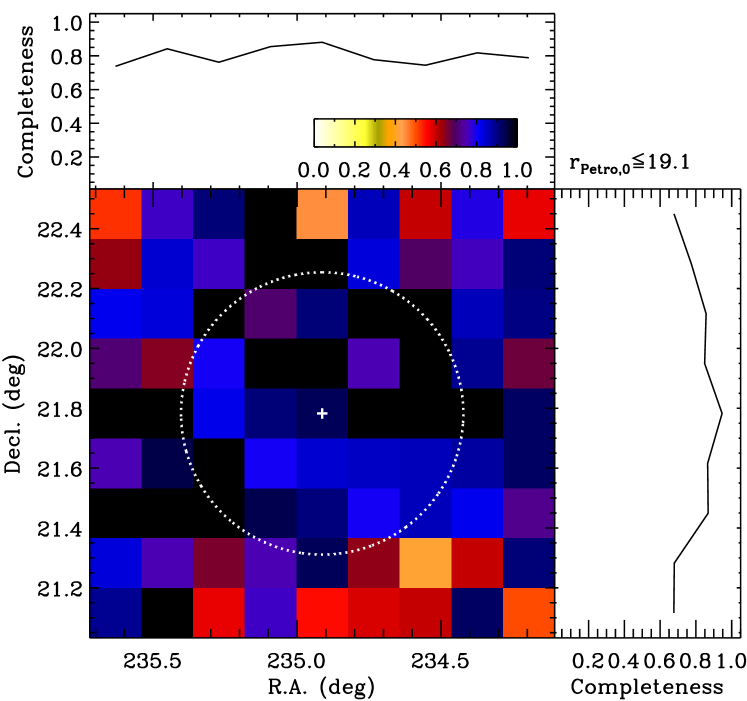
Figure 3 shows how complete the redshift data in the field of A2107 () are before and after our MMT/Hectospec survey as a function of -band apparent magnitude. In the top panel, the black dashed line denotes the number of galaxies regardless of redshift measurements, and the black and red solid lines denote the numbers of galaxies with measured redshifts before and after this survey, respectively. The bottom panel shows the spectroscopic completenesses before (black) and after (red) the survey, which are calculated by the numbers of measured redshifts (i.e. solid lines in the top panel) divided by the number of extended objects (i.e. dashed line in the top panel). The vertical lines indicate the magnitude where the completeness starts to drop below 50%. That magnitude limit is increased more than one magnitude by including our new redshift data (from to ). The cumulative completeness at is also increased significantly from 60% to 80%. The bottom-left panel of Figure 4 shows the cumulative completeness at as functions of R.A. and decl. The top and right panels display the integrated completenesses over the decl. and R.A. ranges, respectively. All the three panels show that our redshift survey uniformly covers the cluster as planned.
Figure 5 displays the distributions of galaxies as a function of redshift. The top panel shows -band apparent magnitudes of galaxies. Black and red dots represent galaxies with measured redshifts from the literature and our MMT/Hectospec survey, respectively. Most targets in our survey are in the magnitude range of –, and many of them are background objects behind the cluster (i.e. red histogram in the bottom panel). The black one shows the total redshift distribution, while the blue one shows the distribution for the cluster member galaxies around . Interestingly, the histograms shows several peaks other than A2107 corresponding to other galaxy groups, but we focus only on A2107 in this study.
3 CLUSTER MEMBERSHIP WITH THE CAUSTIC TECHNIQUE
Motions of galaxies bound in cluster gravitational potential well shape their distribution in a phase space of the radial velocity and projected clustercentric radius, resulting in a characteristic trumpet-shaped pattern in relaxed clusters. The edges of this distribution, so-called caustics, correspond to the escape velocity at each radius (Kaiser, 1987; Regos & Geller, 1989; Diaferio & Geller, 1997b). Diaferio & Geller (1997b) and Diaferio (1999) developed the caustic technique, which defines the trumpet-shaped pattern in the phase space and separates cluster galaxies from foreground and background galaxies. Briefly, the technique smooths the density distribution in the phase space with an adaptive kernel, and finds the location of the caustics where the density reaches a certain threshold (see Diaferio, 1999; Serra et al., 2011, for more information). Serra & Diaferio (2013) demonstrated that the caustic technique works well in identifying cluster member galaxies within . They used 100 mock clusters from a cosmological -body simulation, showing that the technique recovers 953% of true members. We use The Caustic App v1.2, an open source application developed by Anna Laura Serra and Antonaldo Diaferio, to apply this technique to the sample of galaxies with measured redshifts at for the identification of the member galaxies in A2107.
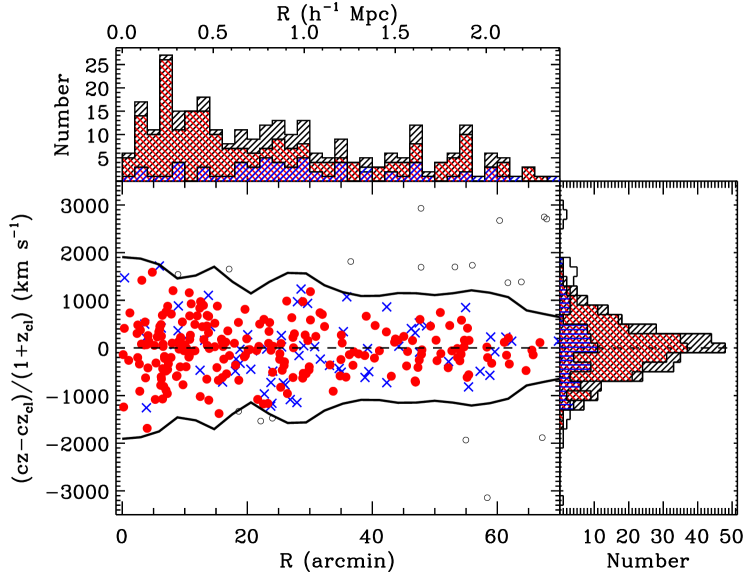
Figure 6 shows the distribution of galaxies in the phase space of the clustercentric velocity along the line of sight and clustercentric radius with the determined caustics (solid black lines) in the bottom left panel. The caustics appears as the well-known trumpet shape and agrees well with the boundaries based on a visual impression. This results in 285 member galaxies at (Mpc). We further divide the member galaxies into two groups (red and blue) based on the positions in the color-magnitude diagram (see Figure 2 and Section 2.2). The top panel shows histograms of red members (red), blue members (blue), and all the galaxies (black) as a function of clustercentric radius. Similarly, the right panel shows those as a function of the clustercentric velocity. As expected, the red members dominate the cluster population and are mostly found in the inner region of the cluster.
The caustic technique also provides a position of the cluster center (i.e. hierarchical center; see Appendix A of Diaferio 1999 for more details) and a mass profile. The hierarchical center of A2107 determined from this technique is R.A., decl., and , which is roughly consistent with the position of cD galaxy (UGC 09958, R.A., decl., and ). We use the hierarchical center as a cluster center for the analysis of cluster rotation from now on. We adopt Mpc, which is obtained from the fit of the caustic mass profile with the Navarro-Frenk-White profile (Navarro et al., 1996) along with .
4 MEASUREMENTS OF GLOBAL ROTATION OF A2107
4.1 The Dressler-Shectman Test and Spatial Segregation of Velocity Distribution
There are several studies that suggest the global rotation of A2107. Oegerle & Hill (1992) showed that the radial velocities of 68 cluster member galaxies are spatially correlated (see their Figures 5 and 6), while there is no strong evidence for two distinct clusters aligned with the line of sight (single-peaked galaxy distribution, regular X-ray morphology, and Gaussian velocity distribution). Kalinkov et al. (2005), using the same data, quantified the spatial correlation of velocities of cluster members by measuring the correlations between position angles and velocities in several radial ranges. They found that the rotational effect is strong at clustercentric radius of 0.26–0.54 Mpc, and derived a rotation-corrected cluster mass. Here, we first follow the analyses of Oegerle & Hill (1992) with newly added cluster members, and then quantify the rotation using two methods in the following section. The improvements in this study are the use of members robustly determined from the caustic technique and the number of members increased by more than a factor of two (in the same R.A. and decl. ranges) thanks to our MMT/Hectospec survey and the SDSS data.
Figure 7 shows the Dressler-Shectman (DS) diagrams (Dressler & Shectman, 1988) for the old data used in Oegerle & Hill (1992, left panel) and the new data in this study (right panel). Each galaxy is represented by an open circle of which size is proportional to . The represents the difference between local kinematics and the global one, which is expressed as
| (2) |
where and are the local velocity mean and dispersion of neighboring galaxies, and and are the global values of the cluster members within . Following Dressler & Shectman (1988) we use that includes a target galaxy and its 10 nearest neighbors. The R.A. and decl. ranges of the figure are chosen to be the same as Figure 5 of Oegerle & Hill (1992), which roughly corresponds to the range of . Groups of large circles in the DS diagram indicate candidates of substructures of which kinematics is not assimilated into the cluster yet. While there are groups of large circles in common between the two panels, the right panel shows more subclustering features in general; there are substructures in the east and west not seen in the left panel, and the substructures in the northwest and southeast near the cluster center appear more prominently. The subclustering features in the south significantly differ between the two panels. The comparison of the DS diagrams between different galaxy samples suggests that detailed features of the DS diagram can change significantly depending on sampling density. To quantify the significance of substructures, we run 1000 Monte Carlo simulations by randomly shuffling the measured redshifts among member galaxies, and count the number of simulations that have the cumulative deviation larger than the one from the real data set. We find that 1.8% of the simulated clusters has such , indicating the significance of substructures of A2107 is high; Oegerle & Hill (1992) found 0%, consistent with this study. The DS tests in both Oegerle & Hill (1992) and this study suggest that A2107 contains significant velocity substructures.
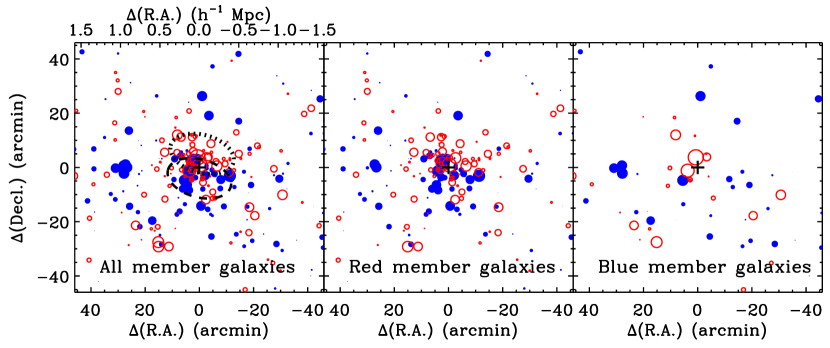
To directly examine whether the global rotation of A2107 exists or not, we plot the spatial distribution of member galaxies in Figure 8. The galaxies with positive and negative clustercentric radial velocities are indicated by open red and filled blue circles, respectively. The size of the circle is proportional to the clustercentric radial velocity. The plot clearly shows that the galaxies with positive and negative velocities are spatially segregated at in the northwest and southeast (denoted by black dotted and dashed ovals), respectively. This is consistent with the subclusterings seen in the DS diagram (right panel of Figure 7). This segregation also appears when we plot red (middle panel) and blue (right panel) members separately. This spatial segregation of the galaxies with positive and negative velocities was also seen in Figure 6 of Oegerle & Hill (1992), consistent with our result.
4.2 Measurements on the Rotation Axis and Amplitude of Cluster Galaxies
We now quantify the rotation of A2107 using two different methods suggested by Hwang & Lee (2007, hereafter HL07) and Manolopoulou & Plionis (2017, hereafter MP17). The HL07 method is to fit the line-of-sight velocities of galaxies () with a sine function of position angle (). We rewrite their Equation (1) in the cluster rest-frame and add a minus sign in the right hand side to have a velocity component toward us in the east of the rotation axis when the rotation axis points to the north:333 It should be noted that position angle increases counterclockwise and the clustercentric velocity increases backward of the cluster.
| (3) |
where and are the line-of-sight velocity and redshift of the cluster. There are two fitting parameters, and , representing the rotation velocity and the position angle of the rotation axis, respectively. We use the notation in which has always a positive value and is in the range .
Another method to determine the rotation axis and amplitude is suggested by MP17. They divide the cluster galaxies into two samples (namely 1 and 2) by the line going through the cluster center. They then measure the difference of the mean galaxy velocities of the two samples, . They repeat this measurement by changing the position angles of galaxies by . Equivalently, one can rotate the division line of the two galaxy samples by angle instead of galaxies. We take this approach with to be the position angle of the division line. In the result, they can obtain the mean velocity difference as a function of the angle ; the velocity difference reaches its maximum (or minimum)444 Being maximum or minimum depends on how to number the subsamples; we call the east side of the division line sample 1, and in that way the velocity difference reaches its minimum when the division line coincides with the rotation axis. when the angle coincides with the position angle of the rotation axis. They demonstrated that the maximum (or minimum) corresponds to the rotation velocity. It should be noted that both methods work only when the rotation axis is not exactly aligned with the line of sight, and the determined rotation axis and amplitude are projected quantities. A possible systematic difference between the two methods is discussed in MP17. One thing to note is that the difference could result from different assumptions of the two methods on the velocity field in a given system. Interestingly, the results from the two methods generally agree in this study.
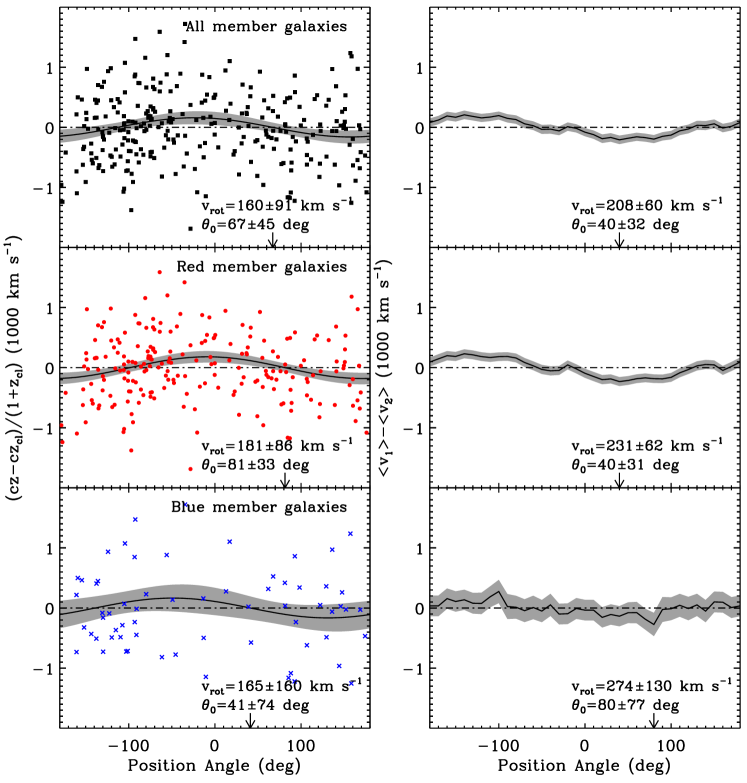
We use both methods to determine the rotation axis and amplitude for all cluster members (top panels), red members (middle), and blue members (bottom) at in Figure 9. The left panels show the clustercentric radial velocities of the galaxies as a function of position angle along with the best-fit rotation curve (black solid line) for Equation (3) based on the HL07 method. The right panels show the mean velocity difference of the two galaxy samples as a function of position angle of the division line following the MP17 method. The errors are obtained through the bootstrap resampling method. The measurements from the two methods agree with each other within 1 error. Both methods suggest that cluster galaxies, mostly red galaxies, at do have mild rotation with an amplitude of 160 or 208 that corresponds to or of the velocity dispersion of cluster members at (). This rotation is measured highly significant (i.e. 3.5) in the MP17 method, but is not so significant in the HL07 method (i.e. 1.8).
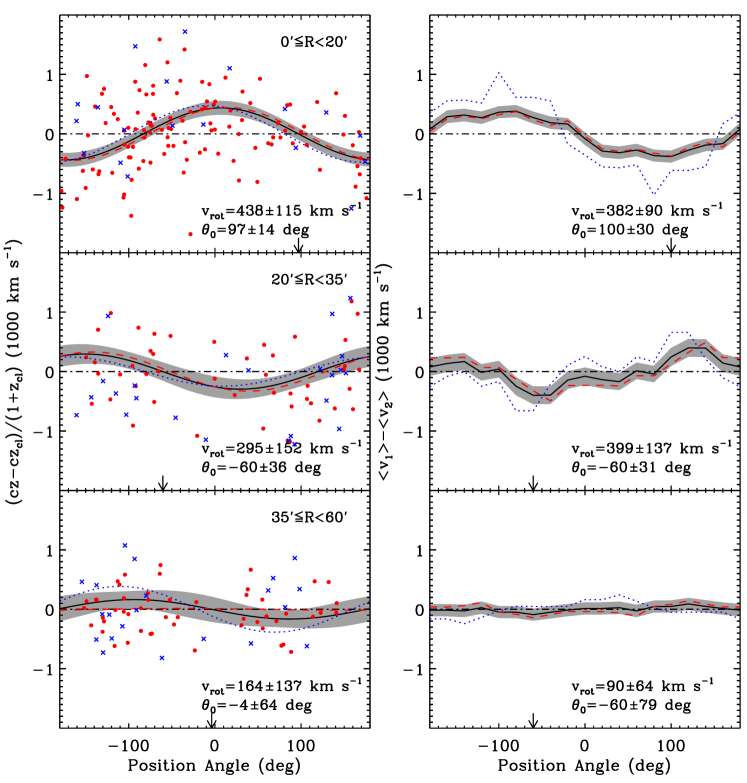
We now examine the rotation in three different radial bins, of which results are presented in Figure 10. Similar to Figure 9, the left and right panels show the results for the HL07 and MP17 methods, respectively. From top to bottom panels, we show the galaxies at (), (), and (), respectively. We choose these radial bins to split the galaxies at and where the rotation axis changes its direction (see Figure 11) and to have similar numbers of galaxies in the two outer bins (72 galaxies each). In each panel, measurements for all, red, and blue members in a given radial bin are shown with black solid line with 1 gray band, red dashed line, and blue dotted line, respectively. Again, the two methods give consistent results within 1 error. All, red, and blue members show roughly similar motion in all radial bins. Figure 10 shows that there is a strong rotation signal at a significance of in the inner region (i.e. ) with an rotational amplitude of 438 or 382, which accounts for 69 or 61% of the velocity dispersion of cluster members in the same region (). The rotational signal becomes weaker with increasing clustercentric radius. One interesting feature from this analysis is that the rotation axis appears to change from the innermost region to intermediate region. This change is clearly seen in Figure 11, which shows the position angle of rotation axis (top panel) and rotation velocity (bottom panel) measured from the two methods (circle: HL07, triangle: MP17) as a function of clustercentric radius. The results from the two methods generally agree well even though they differ at some large radii.555 The rotation axis measurements from the two methods at agree with each other within 1, reminding that . The results from the both methods show the flip of the rotation axis at . Although the rotation amplitude decreases with clustercentric radius, the flip of the rotation axis happens where the rotation amplitude and its significance is still not low. This can indicate a complex kinematic structure of A2107.
To examine a possible systematics in the measurement of the rotation introduced by different choice of cluster center, we repeat all the measurements by adopting the cD galaxy position as the cluster center instead of the hierarchical center position. The derived parameters hardly change (). We also examine the effect of the completeness of data in the rotation measurement. To do that, we construct three different samples using the member galaxies at and compare the derived parameters: the sample in Oegerle & Hill (1992, 56 members) and the samples before (83 members) and after (139 members) our MMT/Hectospec observations. While the rotation axis measurements for these three samples agree with each other within , the rotation velocity measurements are slightly different: , , and by the HL07 method, and , , and by the MP17 method. The inclusion of the SDSS/MMT data makes a non-negligible difference in the rotation velocity measurement. Because the completeness of the data is mainly set by the magnitude limit, such a difference could be caused by the luminosity (or mass) dependence of rotational motion. To test this idea, we divide the sample at into two luminosity subsamples with the same size, and determine the rotation parameters separately. We obtain (HL07) or (MP17) for the luminous sample (70 members), and (HL07) or (MP17) for the faint sample (69 members), indicating that the global rotation of A2107 is dominated by luminous galaxies. This also indicates that the dependence of rotational motion on the data completeness does come from the luminosity dependence of rotational motion.
5 DISCUSSION: ORIGIN OF ROTATION
In this section, we test the scenario in which infall of galaxies from surrounding large-scale structures gives rise to the global rotation of A2107. In Section 5.1, we find the large-scale structures around the cluster and examine their connection to the cluster. In Section 5.2, we study the correlation between the strength of rotational motion of cluster members and their infall time to the cluster potential well.
5.1 Connection to the Large-scale Structures in the Universe
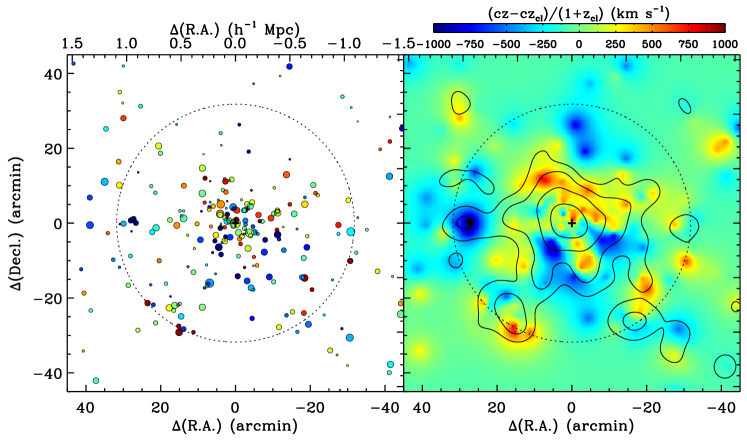
Oegerle & Hill (1992) examined several possibilities that could explain such rotation-like velocity structure of A2107: a superposition of two clusters and a genuinely rotating cluster. Although it is not possible to totally rule out the former case (i.e. a superposition of two clusters) based only on optical spectroscopic data, the Gaussian velocity histogram with a single peak and the modest velocity dispersion of A2107 (see the bottom right panel of Figure 6) tend to support the idea of a single cluster in rotation rather than a system with two clusters . Figure 12 shows the spatial distributions of cluster member galaxies along with their velocity information. In the left panel each circle denotes each member galaxy, of which size and color represent brightness (larger, then brighter) and line-of-sight velocity, respectively. The right panel shows the number-density contours on top of the smoothed velocity map. The plot shows a clear difference in velocity structure between northern and southern parts at , again indicating global rotation of the main clump. The number density contours show that there is only one main clump at , which supports the idea of a single cluster in rotation. In addition, the second brightest member is fainter than the cD galaxy by more than one magnitude, which suggests that there is no dominant substructure.
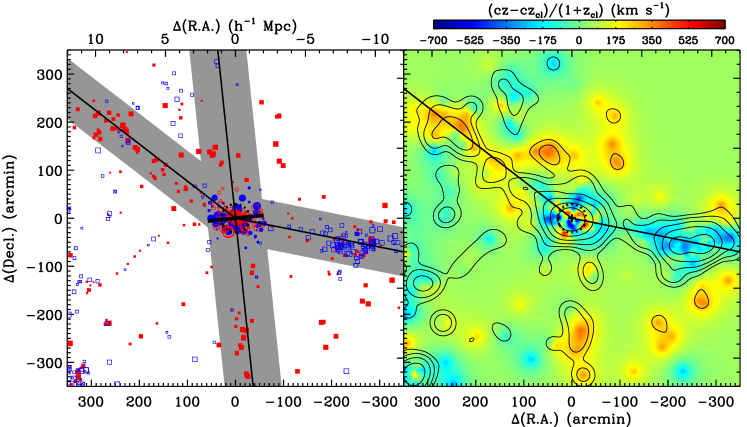
We now examine the connection of the angular momentum of A2107 to the surrounding large-scale structures. We first search for large-scale structures on the sky and then those along the line-of-sight direction. Similar to Figure 12, we show the spatial distributions of galaxies around A2107, but for a much larger field of view by including background and foreground galaxies (squares in the left panel) with in Figure 13. We consider galaxies that are within the caustics and at as cluster members (circles in the left panel). It is noted that non-member galaxies from the SDSS DR12 have a magnitude limit of (spectroscopic survey completeness , Strauss et al. 2002), and thus the same magnitude cut is applied to our MMT/Hectospec data for this analysis.666 The magnitude limit used in Figure 12 is . In the left panel, the color and size of symbols denote the sign and magnitude of velocities, respectively. The number-density contours in the right panel show two over-densities (structures, hereafter) in the northeast and west that are connected to the cluster. We connect each density peak of the two structures to the cluster center with a thick solid line in both panels. The regions close to the solid lines (i.e. distance perpendicular to the solid lines, ) are denoted by gray bands to indicate roughly the size of the structures.
To examine how galaxies in these two structures are connected to the cluster galaxies, we plot the distribution of clustercentric velocities of galaxies in the gray bands in the northeast and west as a function of the distance along the gray bands from the cluster center in Figure 14 (i.e. - diagram). The distance is taken to be positive toward the east. It should be noted that the radial velocity obtained from a redshift consists of two components of a receding motion (from us) driven by the cosmic expansion and a peculiar motion driven by local gravitational interactions. For galaxies at (inside the virial radius of A2107), the velocity is dominated by the peculiar motion in the cluster potential well. For galaxies at (outside the cluster potential well), the redshift is mainly contributed by the cosmic expansion, which can be considered as a distance from us. Therefore, the over-dense region (at ) is probably a structure in the background of the cluster with a receding velocity from the cluster center of . The other one in the west (at ) is spread quite broadly along the line-of-sight direction. Nevertheless, galaxies seem to form a structure at a distance similar to the northeast one, but in the foreground of the cluster. Because the velocity changes smoothly from each of the two large-scale structures to the cluster, the large-scale structures appear to be connected to the cluster. From these connections, we can infer the impact of the large-scale structures on the kinematics of galaxies in and around the cluster; galaxies infalling from the structure in the northeast (one behind the cluster) would have a velocity component toward us, while galaxies from the structure in the west (one in front of the cluster) would have a velocity component away from us. The right panel of Figure 13 shows such a blue blob in the east and a red one in the west where the lines connecting the structures and cluster (thick solid lines) cross the virial radius (dotted circle). These blobs do not seem to directly contribute to the rotational motion detected at , but it might be responsible for the flip of the rotation axis at (see the top panel of Figure 11).
If the global rotation of A2107 is induced by the infall of galaxies from surrounding large-scale structures, one might expect a large-scale structure along the direction perpendicular to the rotation axis. Because there is no such structure in the plane of sky as seen in the right panel of Figure 13 (note that the plot is made with the galaxies in a narrow radial velocity range), we search for the one that is aligned along the line-of-sight direction by drawing another - diagram. In the left panel of Figure 13, the short thick solid line denotes the rotation axis obtained from the member galaxies at , and the long thick solid line in the north-south direction is perpendicular to the rotation axis with a gray band of -wide. Similar to Figure 14, we show the distribution of the clustercentric velocities of galaxies in the north-south gray band as a function of the distance from the cluster center in Figure 15. It should be noted that no redshift cut is imposed in Figure 15 unlike in Figure 14. Most galaxies in the north () have negative velocities of , but galaxies in the south () form two branches, one of which goes to , and the other goes to (this structure appears in Figure 13 as a group of red squares and a red clump in the south in the left and right panels, respectively). If galaxies came into the cluster through these structures, galaxies from the northern structure that is in front of the cluster would have a velocity component of receding from us, which could give rise to the same directional motion of cluster galaxies in the northern part of the cluster (appearing red in the right panels of Figures 12 and 13). Similarly, galaxies from the southern structure that is behind the cluster would have a velocity component of approaching toward us, resulting in the blueshifted motion, which is found in the southern part of the cluster. This means that the structures in north and south can naturally explain the rotational motion of the cluster members at . However, unlike those in the northeast and west, the clustering of galaxies in these structures and their connections to A2107 seem rather weak. Nevertheless, the anisotropic distribution of the structures along the line-of-sight direction (few galaxies at positive velocities in the north and at negative velocities in the south) and the smooth connection between neighboring and cluster galaxies in the phase space suggest a close link between the inflow of galaxies from the large-scale structures and the angular momentum of A2107.
When we use the comoving distances of galaxies derived from their redshifts with simple geometric relations between observed quantities based on the assumption that the observed motion of galaxies is pure Hubble flow, we can obtain the angle between the line-of-sight direction of the cluster and the line-of-sight direction of each structure viewed from the cluster: for the structure in the northeast, for the one in the west, for the one in the north, for one of the two branches in the south, and for the other branch in the south. This indicates that the structures in the northeast, west, and south (one of the two branches) are roughly aligned with the direction perpendicular to the line of sight, and the structures in the north and south (the other branch) are roughly aligned with the line of sight.
To identify any known galaxy groups that comprise the large-scale structures connected to A2107, we search for their counterparts in the SDSS galaxy group catalog by Tempel et al. (2014). The details about the method, data reduction, group finding procedure are described in Tempel et al. (2014). Because A2107 is a member of the Hercules supercluster (Einasto et al. 2001, Group 370 in Tempel et al. (2014) catalog), its neighboring structures are expected to be parts of the Hercules supercluster as well. The comparison of our galaxy catalog with the group catalog of Tempel et al. (2014) reveals that the structure in the west corresponds to Groups 554 (70 members) and 1610 (62 members) of Tempel et al. (2014). There is no counterpart for the other three structures, when we limit groups to those with 10 members or more. However, when we use all groups with 3 members or more, the remaining three structures also have their counterparts.
5.2 Rotational Motion and the Phase-space Diagram of Cluster Galaxies
In the previous section, we have found large-scale structure candidates that might be responsible for the global rotation of A2107. However, it is impossible to directly capture the inflow of galaxies from the large-scale structures into the clusters without simulation data. Instead, we can examine the rotational motion of cluster members that have different infall histories to further test the idea of infall induced global rotation of clusters. If the rotational motion of galaxies in A2107 is induced by the infall of galaxies from nearby large-scale structures, it is expected that the galaxies that have recently come into the cluster (retaining more memory of large-scale structures) would exhibit such rotational motion more prominently than those that have come earlier. We therefore examine rotational motion for subsamples of cluster members divided by their infall time.
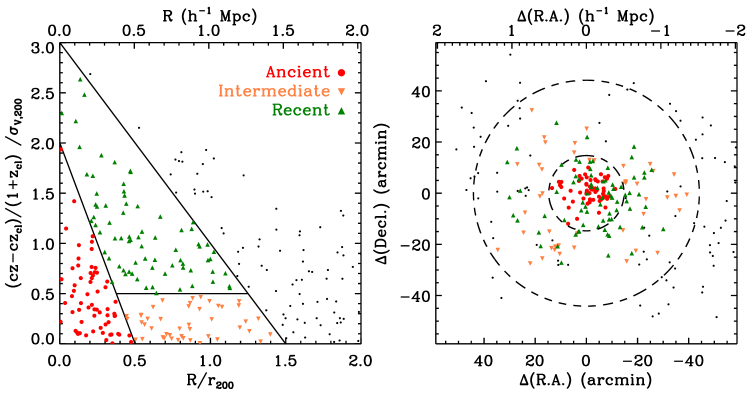
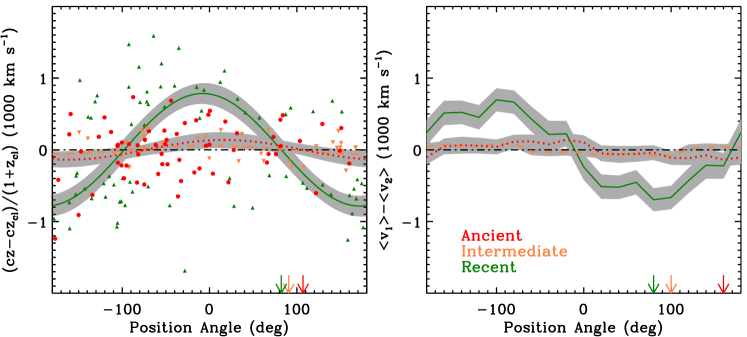
The phase-space diagram (i.e. velocity-radius diagram) for galaxy clusters is useful for understanding their formation history (Gill et al., 2005; Mahajan et al., 2011; Oman et al., 2013; Hernández-Fernández et al., 2014; Muzzin et al., 2014; Haines et al., 2015; Jaffé et al., 2015; Smith et al., 2015; Jaffé et al., 2016; Oman & Hudson, 2016). Recently, Rhee et al. (2017) performed phase-space analyses in group and cluster environments to explore the evolution of galaxies since their infall to these environments using the Yonsei Zoom-in Cluster Simulation data (Choi & Yi, 2017). They found that galaxies tend to follow a certain path in the phase space as galaxies get settled in a cluster potential. Thus the position of galaxies in the phase space can be used to estimate the time since their first infall into the potential in a statistical sense. Following their analysis, we divide the phase space of A2107 into the regions dominated by ancient (region E in their Figure 6), intermediate (region D), and recent infallers (regions B and C combined), which are represented by red dots, orange, and green triangles, respectively, in the left panel of Figure 16. Black dots are the galaxies that are relatively loosely associated in the cluster potential. It should be noted that each region has a broad distribution of infall time. However, the mean infall time changes systematically from E to B, so we could investigate a connection between a physical quantity and infall time by probing a change of the quantity over these regions. The right panel shows the spatial distribution of these galaxies on the sky. Neither particular elongation nor segregation is found except the radial segregations that are expected from the way we divide the galaxy sample.
We now determine rotation velocity and axis separately for the ancient, intermediate, and recent infallers using the two methods by HL07 and MP17. The left and right panels of Figure 17 show the rotation diagrams of the HL07 and MP17 methods, respectively, similar to Figures 9 and 10. Here, red, orange, and green colors represent the ancient, intermediate, and recent infaller cases, respectively. The rotation velocity measured for the ancient infallers are by the HL07 method and by the MP17 method. None of the two methods find strong evidence of rotation ( and ) from the ancient infallers. The intermediate infallers have a rotation velocity of (HL07) or (MP17). Because of the velocity limit imposed to the intermediate infallers by definition, the rotation velocity of them can not be larger than that of the ancient infallers.777 To be free from the systematic bias in the rotation measurement introduced by the different velocity limits imposed on the ancient and intermediate infallers, we construct two samples to compare: ancient infallers and intermediate/recent infallers. The rotation amplitude for the intermediate/recent infallers is measured as by the HL07 method and by the MP17 method, which suggests that intermediate/recent infallers show stronger rotational motion than the ancient infallers do. However, it should be noted that the significance of the measurement is higher for the intermediate infallers (i.e. and ). The recent infallers show the strongest rotational motion in terms of the rotation amplitude and its significance: with (HL07) and with (MP17). The rotation axis measurements of the three groups agree with each other within . The measurement uncertainty of the rotation axis becomes smaller from the ancient, through intermediate, to recent infallers: and versus and versus and . All the measurements of the rotation velocity and axis imply that the more recent infallers galaxies are, the stronger rotational motion they show, which is consistent with our expectation.
6 CONCLUSIONS
We conduct a redshift survey in the field of A2107 at using MMT/Hectospec. We combine 978 new redshifts measured in this study with those in the literature to construct an extensive catalog of 1968 galaxies in that large area. The resulting spectroscopic completeness is high (80% at ) and uniform. By applying the caustic technique to the redshift data, we identify 285 member galaxies, which is more than doubled compared to the number of members in previous studies. Our primary results are as follow.
-
•
We confirm the spatial segregation of radial velocities of member galaxies, suggesting global rotation of A2107. This is consistent with the results in previous studies.
-
•
We quantify the global rotation using two independent methods by Hwang & Lee (2007) and Manolopoulou & Plionis (2017). Both methods suggest that there is strong rotation of 380–440 with 4 significance at small radii of . The rotation amplitude slowly decreases with clustercentric radius, and the position angle of the rotation axis changes abruptly at .
-
•
We find five large-scale structure candidates that are connected to A2107 and consist of known galaxy groups: background structures in the northeast and south, and foreground structures in the west and north. The structures in the north and south seem responsible for the rotational motion of the member galaxies at , and the structures in the northeast and west seem relevant to the blue and red blobs in the east and west at .
-
•
We classify the member galaxies into the ancient, intermediate, and recent infallers based on their positions in the phase space. Galaxies that more recently infall show more significant rotational signals.
These results can suggest that the rotational motion detected in A2107 originates from its surrounding large-scale structures. To further explore the co-evolution of clusters and large-scale structures, we plan to use cosmological simulations. In addition, deep and wide-field X-ray data of A2107 will be helpful for better understanding the merging history of the cluster to test the scenario if off-axis merging induced the global rotation of the cluster.
MMT Hectospec
| Field ID | R.A. | Decl. | Observing date | Exposure | Number of | Number of |
|---|---|---|---|---|---|---|
| (deg, J2000) | (deg, J2000) | (minutes) | targets | measured redshifts | ||
| a2107b15_1 | 235.32063 | 22.071869 | May 25, 2015 | 315 | 256 | 246 |
| a2107b15_2 | 234.53011 | 21.450384 | May 25, 2015 | 315 | 257 | 250 |
| a2107b15_3 | 235.28850 | 21.498020 | June 21, 2015 | 315 | 255 | 231 |
| a2107c16_4 | 234.55217 | 22.073997 | April 16, 2016 | 320 | 255 | 251 |
| ID | SDSS DR12 PhotObjID | R.A. | Decl. | probPSFaa(0) Extended source, (1) Point source. | sourcebb(1) This study, (2) SDSS DR12, (3) Cava et al. (2009), (4) Oegerle & Hill (1992), (5) Smith et al. (2004), (6) White et al. (2000), (7) FAST Spectrograph Archive | Membercc(0) A2107 non-member, (1) A2107 member. | ||
|---|---|---|---|---|---|---|---|---|
| (deg, J2000) | (deg, J2000) | (mag) | ||||||
| 1 | 1237665534928355429 | 233.859078 | 21.624812 | 17.080 | 1 | 2 | 0 | |
| 2 | 1237665534928356043 | 233.861980 | 21.670568 | 20.142 | 0 | 2 | 0 | |
| 3 | 1237665372257059125 | 233.869907 | 21.942797 | 18.249 | 0 | 2 | 0 | |
| 4 | 1237665372257059122 | 233.872894 | 21.984435 | 18.257 | 0 | 2 | 0 | |
| 5 | 1237665534928355532 | 233.882845 | 21.772825 | 16.265 | 0 | 2 | 1 | |
| 6 | 1237665534928355966 | 233.884793 | 21.802447 | 20.717 | 0 | 2 | 0 | |
| 7 | 1237665372257059083 | 233.901961 | 21.822620 | 16.694 | 0 | 2 | 0 | |
| 8 | 1237665372257059957 | 233.902679 | 21.926681 | 20.975 | 0 | 2 | 0 | |
| 9 | 1237665371720253605 | 233.904397 | 21.503921 | 15.010 | 0 | 2 | 1 | |
| 10 | 1237665371720253508 | 233.912087 | 21.547363 | 18.890 | 1 | 2 | 0 |
Note. — This table is available in its entirety in a machine-readable form in the online journal. A portion is shown here for guidance regarding its form and content.


References
- Alam et al. (2015) Alam, S., Albareti, F. D., Allende Prieto, C., et al. 2015, ApJS, 219, 12
- Buote & Tsai (1996) Buote, D. A., & Tsai, J. C. 1996, ApJ, 458, 27
- Cava et al. (2009) Cava, A., Bettoni, D., Poggianti, B. M., et al. 2009, A&A, 495, 707
- Chluba & Mannheim (2002) Chluba, J., & Mannheim, K. 2002, A&A, 396, 419
- Choi & Yi (2017) Choi, H., & Yi, S. K. 2017, ApJ, 837, 68
- Colless et al. (2001) Colless, M., Dalton, G., Maddox, S., et al. 2001, MNRAS, 328, 1039
- Cooray & Chen (2002) Cooray, A., & Chen, X. 2002, ApJ, 573, 43
- Deshev et al. (2017) Deshev, B., Finoguenov, A., Verdugo, M., et al. 2017, A&A, 607, A131
- Diaferio (1999) Diaferio, A. 1999, MNRAS, 309, 610
- Diaferio & Geller (1997a) Diaferio, A., & Geller, M. J. 1997a, ApJ, 481, 633
- Diaferio & Geller (1997b) —. 1997b, ApJ, 481, 633
- Dressler & Shectman (1988) Dressler, A., & Shectman, S. A. 1988, AJ, 95, 985
- Einasto et al. (2001) Einasto, M., Einasto, J., Tago, E., Müller, V., & Andernach, H. 2001, AJ, 122, 2222
- Fabricant et al. (2005) Fabricant, D., Fata, R., Roll, J., et al. 2005, PASP, 117, 1411
- Fabricant et al. (1998) Fabricant, D. G., Hertz, E. N., Szentgyorgyi, A. H., et al. 1998, in Proc. SPIE, Vol. 3355, Optical Astronomical Instrumentation, ed. S. D’Odorico, 285–296
- Fujita et al. (2006) Fujita, Y., Sarazin, C. L., & Sivakoff, G. R. 2006, PASJ, 58, 131
- Geller et al. (2016) Geller, M. J., Hwang, H. S., Dell’Antonio, I. P., et al. 2016, ApJS, 224, 11
- Geller et al. (2014a) Geller, M. J., Hwang, H. S., Diaferio, A., et al. 2014a, ApJ, 783, 52
- Geller et al. (2014b) Geller, M. J., Hwang, H. S., Fabricant, D. G., et al. 2014b, ApJS, 213, 35
- Gill et al. (2005) Gill, S. P. D., Knebe, A., & Gibson, B. K. 2005, MNRAS, 356, 1327
- Godłowski et al. (2003) Godłowski, W., Szydłowski, M., Flin, P., & Biernacka, M. 2003, General Relativity and Gravitation, 35, 907
- Haines et al. (2015) Haines, T., McIntosh, D. H., Sánchez, S. F., Tremonti, C., & Rudnick, G. 2015, MNRAS, 451, 433
- Hand et al. (2012) Hand, N., Addison, G. E., Aubourg, E., et al. 2012, Physical Review Letters, 109, 041101
- Hernández-Fernández et al. (2014) Hernández-Fernández, J. D., Haines, C. P., Diaferio, A., et al. 2014, MNRAS, 438, 2186
- Hwang et al. (2014) Hwang, H. S., Geller, M. J., Diaferio, A., Rines, K. J., & Zahid, H. J. 2014, ApJ, 797, 106
- Hwang & Lee (2007) Hwang, H. S., & Lee, M. G. 2007, ApJ, 662, 236
- Jaffé et al. (2015) Jaffé, Y. L., Smith, R., Candlish, G. N., et al. 2015, MNRAS, 448, 1715
- Jaffé et al. (2016) Jaffé, Y. L., Verheijen, M. A. W., Haines, C. P., et al. 2016, MNRAS, 461, 1202
- Kaiser (1987) Kaiser, N. 1987, MNRAS, 227, 1
- Kalinkov et al. (2005) Kalinkov, M., Valchanov, T., Valtchanov, I., Kuneva, I., & Dissanska, M. 2005, MNRAS, 359, 1491
- Kurtz & Mink (1998) Kurtz, M. J., & Mink, D. J. 1998, PASP, 110, 934
- Laganá et al. (2010) Laganá, T. F., Andrade-Santos, F., & Lima Neto, G. B. 2010, A&A, 511, A15
- Li (1998) Li, L.-X. 1998, General Relativity and Gravitation, 30, 497
- Limber & Mathews (1960) Limber, D. N., & Mathews, W. G. 1960, ApJ, 132, 286
- Mahajan et al. (2011) Mahajan, S., Mamon, G. A., & Raychaudhury, S. 2011, MNRAS, 416, 2882
- Manolopoulou & Plionis (2017) Manolopoulou, M., & Plionis, M. 2017, MNRAS, 465, 2616
- Materne & Hopp (1983) Materne, J., & Hopp, U. 1983, A&A, 124, L13
- Merritt (1988) Merritt, D. 1988, in Astronomical Society of the Pacific Conference Series, Vol. 5, The Minnesota lectures on Clusters of Galaxies and Large-Scale Structure, ed. J. M. Dickey, 175–196
- Muzzin et al. (2014) Muzzin, A., van der Burg, R. F. J., McGee, S. L., et al. 2014, ApJ, 796, 65
- Navarro et al. (1996) Navarro, J. F., Frenk, C. S., & White, S. D. M. 1996, ApJ, 462, 563
- Oegerle & Hill (1992) Oegerle, W. R., & Hill, J. M. 1992, AJ, 104, 2078
- Oman & Hudson (2016) Oman, K. A., & Hudson, M. J. 2016, MNRAS, 463, 3083
- Oman et al. (2013) Oman, K. A., Hudson, M. J., & Behroozi, P. S. 2013, MNRAS, 431, 2307
- Park et al. (2018) Park, C., Hwang, H. S., Park, H., & Lee, J. C. 2018, Nature Astronomy, 2, 162
- Peebles (1969) Peebles, P. J. E. 1969, ApJ, 155, 393
- Regos & Geller (1989) Regos, E., & Geller, M. J. 1989, AJ, 98, 755
- Rhee et al. (2017) Rhee, J., Smith, R., Choi, H., et al. 2017, ApJ, 843, 128
- Ricker (1998) Ricker, P. M. 1998, ApJ, 496, 670
- Rines et al. (2013) Rines, K., Geller, M. J., Diaferio, A., & Kurtz, M. J. 2013, ApJ, 767, 15
- Roettiger & Flores (2000) Roettiger, K., & Flores, R. 2000, ApJ, 538, 92
- Sánchez-Blázquez et al. (2009) Sánchez-Blázquez, P., Jablonka, P., Noll, S., et al. 2009, A&A, 499, 47
- Serra & Diaferio (2013) Serra, A. L., & Diaferio, A. 2013, ApJ, 768, 116
- Serra et al. (2011) Serra, A. L., Diaferio, A., Murante, G., & Borgani, S. 2011, MNRAS, 412, 800
- Smith et al. (2015) Smith, R., Sánchez-Janssen, R., Beasley, M. A., et al. 2015, MNRAS, 454, 2502
- Smith et al. (2004) Smith, R. J., Hudson, M. J., Nelan, J. E., et al. 2004, AJ, 128, 1558
- Song et al. (2017) Song, H., Hwang, H. S., Park, C., & Tamura, T. 2017, ApJ, 842, 88
- Strauss et al. (2002) Strauss, M. A., Weinberg, D. H., Lupton, R. H., et al. 2002, AJ, 124, 1810
- Takizawa (2000) Takizawa, M. 2000, ApJ, 532, 183
- Tempel et al. (2014) Tempel, E., Tamm, A., Gramann, M., et al. 2014, A&A, 566, A1
- The & White (1986) The, L. S., & White, S. D. M. 1986, AJ, 92, 1248
- Tonry & Davis (1979) Tonry, J., & Davis, M. 1979, AJ, 84, 1511
- Tovmassian (2002) Tovmassian, H. M. 2002, ArXiv Astrophysics e-prints, astro-ph/0212110
- Tovmassian (2015) —. 2015, Astrophysics, 58, 328
- White et al. (2000) White, R. L., Becker, R. H., Gregg, M. D., et al. 2000, ApJS, 126, 133
- York et al. (2000) York, D. G., Adelman, J., Anderson, Jr., J. E., et al. 2000, AJ, 120, 1579