Automated Camera-Based Estimation of Rehabilitation Criteria Following ACL Reconstruction
Abstract
Anterior cruciate ligament (ACL) reconstruction necessitates months of rehabilitation, during which a clinician evaluates whether a patient is ready to return to sports or occupation. Due to their time- and cost-intensive nature, these screenings to assess progress are unavailable to many. This paper introduces an automated, markerless, camera-based method for estimating rehabilitation criteria following ACL reconstruction. To evaluate the performance of this novel technique, data were collected weekly from 12 subjects as they used a leg press over the course of a 12-week rehabilitation period. The proposed camera-based method for estimating displacement and force was compared to encoder and force plate measurements. The leg press displacement and force values were estimated with 89.7% and 85.3% accuracy, respectively. These values were then used to calculate lower-limb symmetry and to track patient progress over time.
I Introduction
Rupture of the anterior cruciate ligament (ACL) is a common lower limb injury, with approximately instances occurring annually in the United States [1]. Almost of these patients undergo ACL reconstruction (ACLR) surgery each year, which is accompanied by a rehabilitation program lasting several months [2]. While injuries resulting from contact are often beyond an individual’s control, noncontact ACL ruptures occur most often when subjects exhibit biomechanical deficits during deceleration, lateral pivoting, and landing tasks [3, 4, 5].
These deficits are commonly diagnosed in functional motion screens [6, 7], where a clinician looks for abnormal movement patterns and asymmetries in range of motion, strength, power, and control while the patient performs a series of dynamic tasks. For ACLR patients, functional screens are used to track progress during rehabilitation and assess if an athlete is ready to return to sports [8, 9, 10]. However, since these assessments are not cost-effective for large groups or frequent sessions [11], they cannot be performed regularly throughout the course of a rehabilitation program and are, in fact, inaccessible to most individuals.
Furthermore, functional screens, as well as some automated lower limb assessments [12], focus on subjects’ kinematics and typically do not evaluate forces. Measuring forces during motion could alert clinicians to altered load distributions throughout a patient’s knee joint [13], but quantifying these forces is infeasible from clinical observations alone.
To address these concerns, researchers have assessed high-risk movements quantitatively in the laboratory with motion capture equipment [4, 14]. Though successful in identifying biomechanical deficits that could lead to ACL rupture, the motion capture setup is inaccessible in the clinical setting due to cost and setup time. Motion capture systems that involve equipment such as marker suits also inhibit a subject’s natural movement [15, 16], which can unintentionally impact the biomechanical assessment. Additionally, automated progress assessment can be more easily implemented on a large scale by evaluating forces during commonly used rehabilitation exercises, such as the leg press [17, 18].
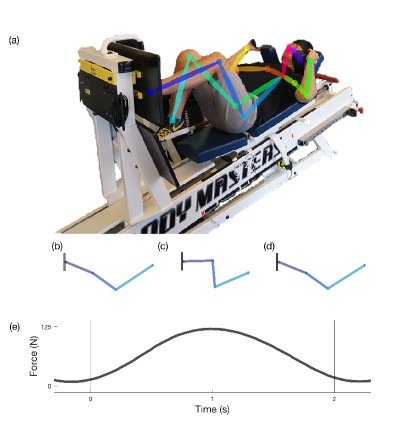
The contributions of this paper are threefold. First, as described in Section III, a technique to estimate forces through a vision-based system as subjects use a leg press in a rehabilitation program, outlined in Fig. 1. Second, as described in Section IV, a dataset that includes force, encoder, and camera data for ACLR subjects who were undergoing weekly rehabilitation for weeks. Finally, as described in Section V, a quantitative evaluation that illustrates that our proposed vision-based technique is able to accurately measure common functional screening criteria when compared to empirical techniques and ground truth data across all participants. The remainder of our paper describes quantifiable criteria present in the leg press functional screen (Section II) and discusses future work for automating other tests present in a functional motion screen (Section VI).
II Background
This section describes criteria a clinician may look for when the leg press exercise is included in functional screenings for ACLR patients. During functional motion screens, clinicians focus on a specific task with the intent of evaluating and tracking individual performance [8]. In this paper, we focus on the single-leg leg press exercise, as it is widely used for rebuilding lower-limb muscle after surgery and can provide a means for assessing lower-limb symmetry [17, 18]. During a leg press exercise, an individual lies on a sled that translates along a rail, and pushes on a foot plate to lift a set of adjustable weights. While conducting a functional screen of an individual performing this task, clinicians can record the number of repetitions in each leg, comparing the patient’s ACLR leg to the healthy one [17, 19]. Though research has shown that evaluating the force generated during the motion can be useful to assess ACL injury risk, clinicians are typically unable to accurately estimate this from direct observation [20, 21].
Instruments such as a force plate and encoder can quantify the forces present in the leg press exercise as well as automate the recording of repetitions; however, these sensors are often expensive and require custom-built hardware to attach to a leg press. Accordingly, this paper focuses on estimating the following quantities while an individual is performing a leg-press exercise, described in Section III:
-
1.
Displacement of participant from initial position
-
2.
Force present on the leg press foot plate
-
3.
Symmetry in repetitions between left and right leg
The above criteria are then used to track patient improvement over time. We automate the estimation of these values using a single stereo camera coupled with a pose estimation algorithm, which does not require the use of expensive instrumentation or complicated installation.
III Automating the Estimation of Leg Press Functional Criteria
This section details the method of data collection and processing for obtaining the quantities described in Section II. Here, familiarity with stereo camera geometry is assumed; for definitions refer to [22]. We estimate two-dimensional joint position in the left and right frames of a stereo image. We then use this joint position data to estimate displacement and force with a dynamic model of a subject on a leg press. The force and displacement values are compared to those measured by a rotary encoder and force plate.
III-A Data Collection
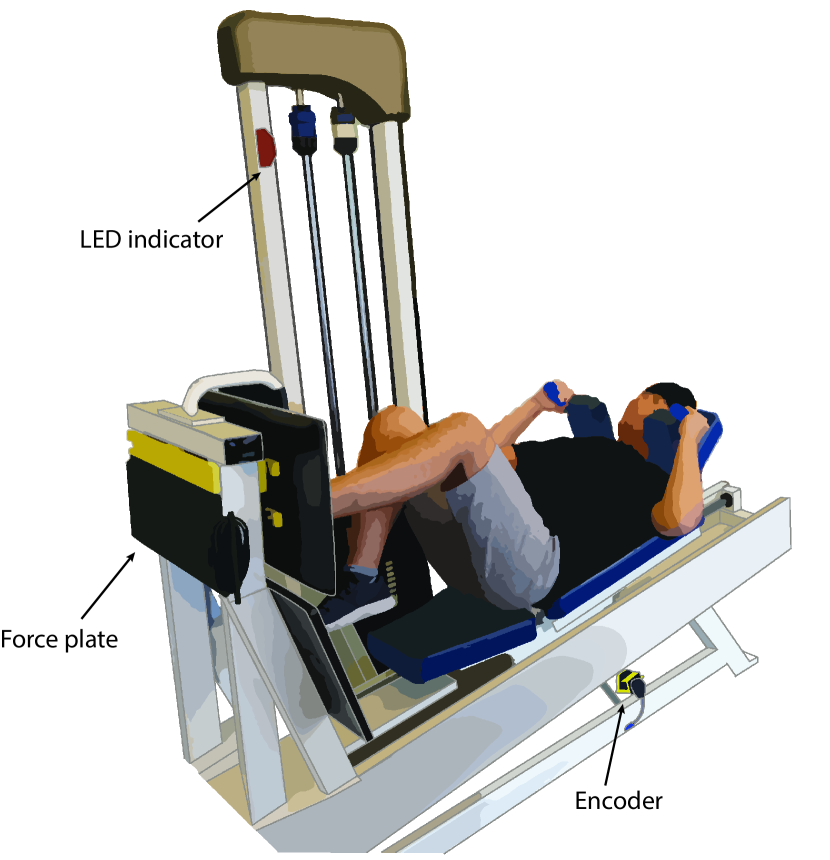
Each test is performed on a leg press machine (Body Masters MD-122) instrumented with a force plate and encoder at University of Michigan’s MedSport Facility in Ann Arbor, Michigan. The force plate (Loadstar Sensors, DI-1000) with a sampling rate of Hz, is installed on the machine’s foot plate, and measures the force exerted on the foot plate during the leg press test. The rotary encoder (US Digital H6-10000), with sampling rate of Hz, is installed via an adapter on a pulley that rotates with the motion of the sled. To record lateral movement of the subject, a stereo camera (ZED Stereolabs) collecting video at an average frequency of Hz is mounted on a wall near the leg press meters away. Mounting the camera on the wall ensures that the camera’s position will not be disturbed by visiting patients over the course of the study. A magnetic switch is manually placed at the beginning of each test, triggering an LED light to ensure that subjects consistently reach a -degree knee angle. The experimental setup is shown in Fig. 2. Individual tests are eliminated if the camera, force plate, or encoder data fails to be recorded.
III-B Estimating Joint Position
The OpenPose pose estimation algorithm is used to estimate the position of the hip joint during each leg press test [23]. This algorithm returns horizontal () and vertical () pixel coordinates for a joint of interest in each image frame. It is run separately on rectified [22, Chapter 11] left and right frames of the stereo images, and the coordinate pairs are saved for both frames. Although rectification guarantees that corresponding points in left and right images have the same -coordinates, this property does not hold in the context of a pose estimation algorithm. However, equivalent -coordinates are necessary for accurate depth estimation on rectified images, due to the epipolar constraint [22, Chapter 11]. As the -values of joint positions produced by OpenPose frequently differ between the left and right frame of the stereo images, we regulate the -coordinates of corresponding left and right frames by replacing both values with their mean.
III-C Estimating Displacement
To estimate a patient’s displacement from their starting position using camera data, the three-dimensional position of each joint with respect to the left frame of the stereo camera is recovered. Using the post-processed - and -coordinates from our two-dimensional joint position, we compute a Direct Linear Transformation (DLT) with least squares minimization [22, Chapter 7] and form a three-dimensional point cloud. An example from one patient can be seen in Fig. 3.
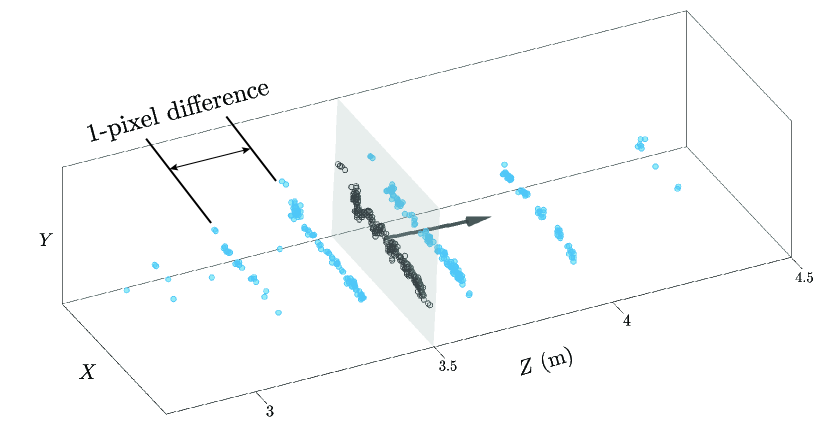
As described in the previous section, regulation of a joint’s -coordinate lowers the re- projection error [22, Chapter 6] within corresponding stereo image pairs sampled at the same time. However, the pose estimation algorithm may not return the same pixel for a given joint in image pairs sampled consecutively, meaning that even after regulation, the estimation of the depth of the joint relative to the camera can vary between successive frames. Indeed, due to the distance of the camera from the study participants, error of even one pixel translates to a much larger error in the three-dimensional position estimation of the depth, or -coordinate, as illustrated in Fig. 3. The direction of this error is extracted via Principal Component Analysis (PCA) of the three-dimensional point cloud for the hip joint, where it is represented by the first principal component. The second and third principal component then form a plane approximately containing the true motion of the hip joint, shown in Fig. 3. Exploiting the knowledge that a participant’s hip joint position is constrained while performing a leg press and exhibits only minimal lateral movement, we project the three-dimensional points onto this plane. The Euclidean distance between the resulting points and the starting position is then used to calculate displacement.
III-D Estimating Force
The estimate of displacement is used to approximate the forces present on the leg press plate during testing. A dynamic model of the leg press machine is constructed to estimate the force on the foot plate at time by the patient, which we denote by . The parameters employed by the model are:
| mass of patient | |
| mass of sled | |
| mass of weights | |
| combined rotational inertia of pulleys | |
| radius of pulley 1 | |
| radius of pulley 2 | |
| angle of foot plate to vertical | |
| angle of machine rail to horizontal | |
| rotation angle of the disk (encoder) | |
| gravitational constant |
Given the second derivative of a camera-estimated displacement trajectory , a free body diagram of the leg press machine, shown in Fig. 4, yields:
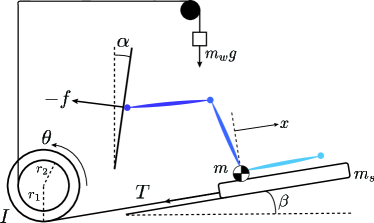
| (1) |
where represents the tension in a strap connecting the sled to the adjustable weights. This tension can be solved for through the following relation, where :
III-E Calculating Repetitions and Symmetry
The number of repetitions in each trial is calculated automatically by counting the peaks present in the smoothed estimation of displacement. Within the time window of interest, the displacement data is first zero-centered by subtracting the mean value. Next, the number of zero-crossings with negative slope are tallied as repetitions. Defining the number of repetitions on the right and left leg, respectively, as and , we calculate the symmetry between a patient’s right and left legs as
| (4) |
IV Experiment
This section describes the leg press experiment, conducted on the setup described in Section III. Twelve ACLR patients ( female and male, ages -, average height m, average body mass kg) were recruited for this study. The subjects were at least 4 months out of surgery. The same number of control subjects were recruited, matched with ACLR subjects for height, weight, sex, and age. All participants gave their informed written consent, with parent or legal guardian permission if necessary. The experimental protocol was approved by the University of Michigan Health Sciences and Behavioral Sciences Institutional Review Board, eResearch ID: HUM00132288. The ACLR subjects completed the leg press test once a week over a -week period, and control subjects completed the test once. During each testing session, the subject performed four -second leg press intervals (single-leg, two intervals on each). These intervals consisted of and of the subject’s body weight on each leg, in randomized order. Subjects were instructed to complete as many repetitions of the leg press motion as possible, reaching a -degree knee angle on each cycle.
V Results
This section describes the accuracy of our method in estimating the following quantities:
-
1.
Displacement of participant from initial position
-
2.
Force present on the leg press foot plate
-
3.
Symmetry in repetitions between left and right leg
All accuracy measures were computed using force and displacement values from leg press tests, the total of ACLR patients over weeks with tests per session, as well as the controls patients with one session each. As described earlier, any trials wherein the camera, force plate, or encoder data failed to record were excluded from analysis. The estimated quantities are then used to track patient progress over time.
V-A Displacement Estimation
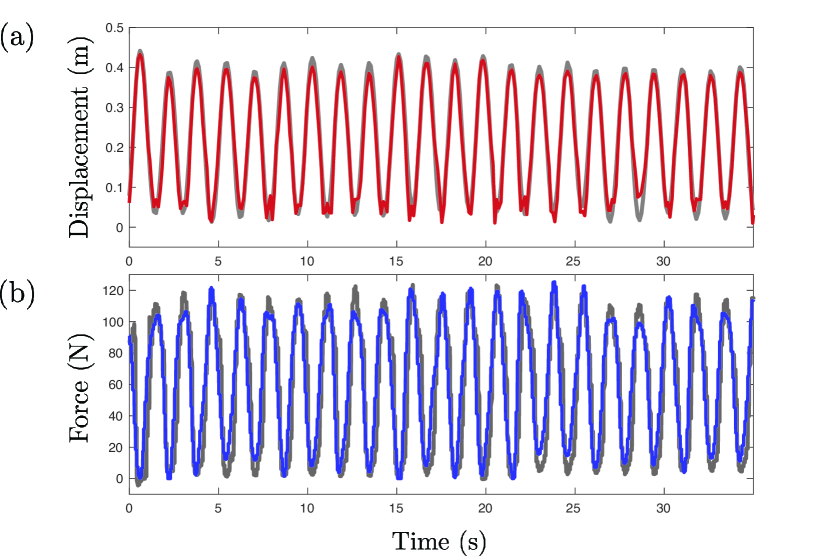
The root mean square error (RMSE) between the estimated and measured displacement trajectory for each leg press trial was computed. On average, the estimated displacement differed from measurements with an RMSE of m. When normalized by the range of measured displacements (mean m) in each trial, this corresponds to an average normalized root mean square error (NRMSE) of . An example of estimated versus measured displacement values for one subject is shown in Fig. 5, while Tab. I reports a summary of estimation accuracy.
| Number of Tests | 505 |
|---|---|
| Distance Estimation Accuracy(%) | 89.7 |
| Force Estimation Accuracy (%) | 85.3 |
| Reps Accuracy(%) | 97.4 |
| Percent Symmetry Accuracy(%) | 96.5 |
V-B Force Estimation
The RMSE between the estimated and measured force values for each leg press trial was found to be N. After normalization by the range of measured forces, this corresponds to an NRMSE of . An example of estimated versus measured force values for one subject is shown in Fig. 5.
V-C Repetition Counting and Symmetry Evaluation
A count of the number of repetitions completed in each of the trials was calculated using both estimated and measured displacement values. The difference between the two counts was divided by the total number of repetitions found in the measured displacement trajectory, yielding an error percentage for each trial. The average error percentage was .
The accuracy in percent symmetry was computed in a similar manner. After finding the repetitions from both the estimated and measured displacement values, percent symmetry was calculated for each using (4). For each test, the difference between the estimated and measured percent symmetry values was divided by the measured percent symmetry. The error percentage, averaged across all tests, was .
V-D Patient Improvement Over Time
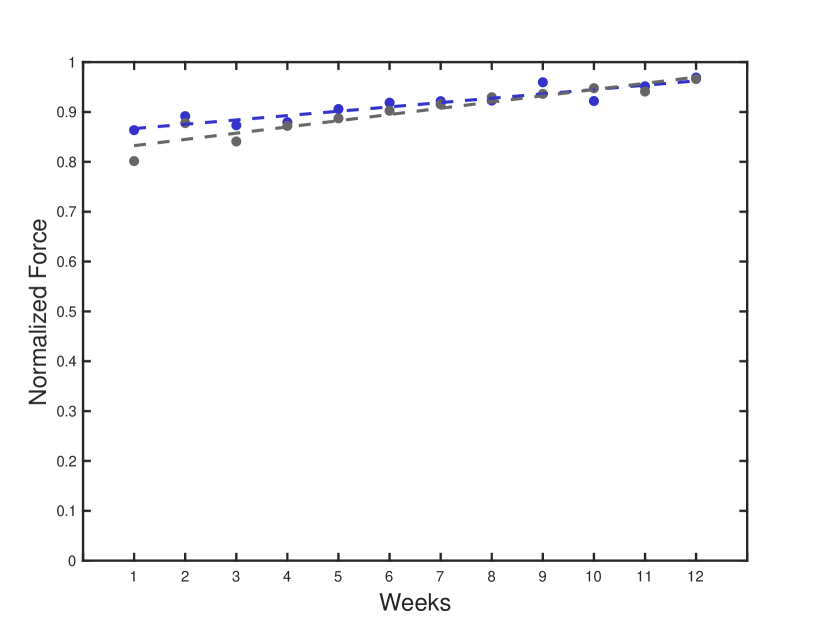
Force and displacement data collected from subjects’ ACLR leg during the body weight test was used to track progress over time.
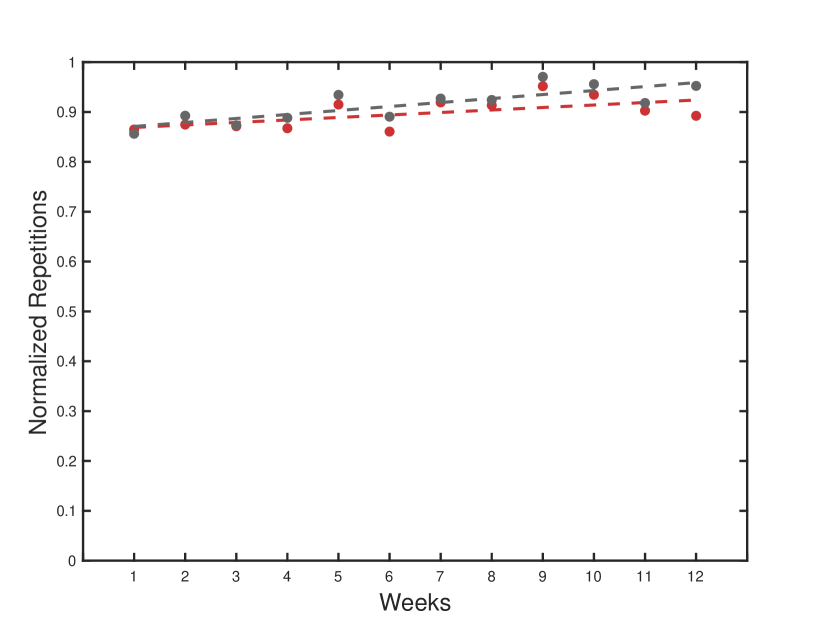
The camera-based estimations of displacement and force confirm improvement in ACLR patient performance over the -week study. The number of repetitions achieved by each subject during each of the tests was normalized by the maximum number of repetitions for that subject over the course of the study. Peak force was normalized in a similar fashion. The ACLR patients in this program had an average increase in normalized number of repetitions of , shown in Fig. 6, and average increase in peak force of , illustrated in Fig. 7.
VI Discussion
Functional motion screens are useful for preventing ACL injury and monitoring rehabilitation progress after ACL reconstruction surgery. However, since they are time- and cost-intensive, these assessments have limited availability. Many of the qualitative criteria in a functional screen can be quantified, and introducing markerless pose estimation provides an opportunity to automate the process.
In this paper, we reproduced force and encoder readings from an instrumented leg press using a stereo camera with over accuracy. We used these values to automate functional screening results. We calculate percent symmetry between a patient’s healthy and ACL-reconstructed legs, with an accuracy over . We also tracked number of repetitions and peak force over the course of the -week study for subjects. The improvement in peak force suggests that measuring forces during ACLR rehabilitation may be clinically relevant for assessing if a patient is ready to return to sports. However, more conclusive analyses of improvement trends in ACLR patients will be enabled through data currently being collected from a larger number of test participants.
These same estimated force and displacement values can contribute to future work in quantifying power and control during the leg press exercise. Power is necessary for return to sports in ACLR patients [21], but is often qualitatively rated during functional screens. Our force and displacement estimates can be used to quantify a patient’s power by looking at force data over time. To evaluate control, clinicians check whether patients are both achieving full extension and maintaining quadriceps activation without slamming weights, taking breaks, or hyper-extending the knee. Our estimated displacement measurements can be used to detect breaks and knee hyper-extension during the leg press exercise. Furthermore, the kinematic data recovered through the pose estimation algorithm for the ACLR subjects can be used in future work to quantify each subject’s knee angles and estimate joint loads, as excessive valgus and varus loading in the knee joint are an indicator of ACL injury risk [3, 4, 5].
The results from this study highlight the effectiveness of a markerless, inexpensive camera-based method for tracking rehabilitation progress in ACLR patients, which can be extended to more functional tasks in the future. The leg press environment in this study allowed for simple dynamic modeling by constraining the axis of motion. Similarly, progress assessment in other functional screening tasks, such as jump tests, lunges, or squats, can be automated by exploiting the structure in each exercise.
Acknowledgments
The authors thank the test subjects and clinicians involved in the leg press tests.
References
- [1] L. Griffin, M. Albohm, and E. Arendt, “Understanding and preventing noncontact anterior cruciate ligament injuries: A review of the hunt valley ii meeting,” American Journal of Sports Medicine, vol. 2006, pp. 1512–1532, 01 2006.
- [2] K. E. Wilk, L. C. Macrina, E. L. Cain, J. R. Dugas, and J. R. Andrews, “Recent advances in the rehabilitation of anterior cruciate ligament injuries,” Journal of Orthopaedic & Sports Physical Therapy, vol. 42, no. 3, pp. 153–171, 2012.
- [3] T. Besier, D. Lloyd, J. Cochrane Wilkie, and T. Ackland, “External loading of the knee joint during running and cutting maneuvers,” Medicine and science in sports and exercise, vol. 33, pp. 1168–75, 08 2001.
- [4] T. E. Hewett, G. D. Myer, K. R. Ford, J. Robert S. Heidt, A. J. Colosimo, S. G. McLean, A. J. van den Bogert, M. V. Paterno, and P. Succop, “Biomechanical measures of neuromuscular control and valgus loading of the knee predict anterior cruciate ligament injury risk in female athletes: A prospective study,” American Journal of Sports Medicine, vol. 33, no. 4, pp. 492–501, 2005. PMID: 15722287.
- [5] B. P Boden, F. Sheehan, J. S Torg, and T. Hewett, “Noncontact anterior cruciate ligament injuries: Mechanisms and risk factors,” The Journal of the American Academy of Orthopaedic Surgeons, vol. 18, pp. 520–7, 09 2010.
- [6] D. Padua, S. W Marshall, M. Boling, C. Thigpen, W. Garrett, and A. I Beutler, “The Landing Error Scoring System (LESS) is a valid and reliable clinical assessment tool of jump-landing biomechanics: The JUMP-ACL study,” American Journal of Sports Medicine, vol. 37, pp. 1996–2002, 10 2009.
- [7] D. Teyhen, M. Bergeron, P. Deuster, N. Baumgartner, A. I Beutler, S. de la Motte, B. H Jones, P. Lisman, D. Padua, T. Pendergrass, S. W Pyne, E. Schoomaker, T. C Sell, and F. O’Connor, “Consortium for health and military performance and american college of sports medicine summit: Utility of functional movement assessment in identifying musculoskeletal injury risk,” Current sports medicine reports, pp. 52–63, 01 2014.
- [8] R. Manske and M. Reiman, “Functional performance testing for power and return to sports,” Sports Health, vol. 5, no. 3, pp. 244–250, 2013. PMID: 24427396.
- [9] G. J. Davies, E. McCarty, M. Provencher, and R. C. Manske, “ACL return to sport guidelines and criteria,” Current Reviews in Musculoskeletal Medicine, vol. 10, pp. 307–314, Sep 2017.
- [10] A. Gokeler, W. Welling, S. Zaffagnini, R. Seil, and D. Padua, “Development of a test battery to enhance safe return to sports after anterior cruciate ligament reconstruction,” Knee Surgery, Sports Traumatology, Arthroscopy, vol. 25, pp. 192–199, Jan 2017.
- [11] E. Swart, L. Redler, P. D Fabricant, B. R Mandelbaum, C. Ahmad, and Y. Claire Wang, “Prevention and screening programs for anterior cruciate ligament injuries in young athletes: A cost-effectiveness analysis,” American Journal of Bone and Joint Surgery, vol. 96, pp. 705–11, 05 2014.
- [12] P. A. Mauntel, Timothy C, P. A. Padua, Darin A, D. P. S. Stanley, Laura E, P. A. Frank, Barnett S, P. A. DiStefano, Lindsay J, M. A. C. Peck, Karen Y, P. M. A. Cameron, Kenneth L, and P. Marshall, Stephen W., “Automated quantification of the landing error scoring system with a markerless motion-capture system,” Journal of Athletic Training, vol. 52, pp. 1002–1009, 11 2017.
- [13] B. A. Sanford, J. L. Williams, A. Zucker-Levin, and W. M. Mihalko, “Asymmetric ground reaction forces and knee kinematics during squat after anterior cruciate ligament (ACL) reconstruction,” The Knee, vol. 23, no. 5, pp. 820 – 825, 2016.
- [14] G. Myer, K. Ford, S. Di Stasi, K. Barber Foss, L. J Micheli, and T. Hewett, “High knee abduction moments are common risk factors for patellofemoral pain (PFP) and anterior cruciate ligament (ACL) injury in girls: Is PFP itself a predictor for subsequent ACL injury?,” British Journal of Sports Medicine, vol. 49, 03 2014.
- [15] J. Atha, “Current techniques for measuring motion,” Applied Ergonomics, vol. 15, no. 4, pp. 245 – 257, 1984.
- [16] D. Vlasic, R. Adelsberger, G. Vannucci, J. Barnwell, M. Gross, W. Matusik, and J. Popović, “Practical motion capture in everyday surroundings,” ACM Trans. Graph., vol. 26, July 2007.
- [17] C. Neeter, A. Gustavsson, P. Thomeé, J. Augustsson, R. Thomeé, and J. Karlsson, “Development of a strength test battery for evaluating leg muscle power after anterior cruciate ligament injury and reconstruction,” Knee Surgery, Sports Traumatology, Arthroscopy, vol. 14, pp. 571–580, Jun 2006.
- [18] F. Esfandiarpour, A. Shakourirad, S. T. Moghaddam, G. Olyaei, A. Eslami, and F. Farahmand, “Comparison of kinematics of ACL-deficient and healthy knees during passive flexion and isometric leg press,” The Knee, vol. 20, no. 6, pp. 505 – 510, 2013.
- [19] E. Rohman, J. Steubs, and M. Tompkins, “Changes in involved and uninvolved limb function during rehabilitation after anterior cruciate ligament reconstruction,” American Journal of Sports Medicine, vol. 43, pp. 1391–1398, 2015.
- [20] A. A. Sapega, “Muscle performance evaluation in orthopaedic practice,” Journal of Bone and Joint Surgery, vol. 72-A, pp. 1104–1110, 12 1990.
- [21] R. Thomee, Y. Kaplan, J. Kvist, G. Myklebust, M. Risberg, D. Theisen, E. Tsepis, S. Werner, B. Wondrasch, and E. Witvrouw, “Muscle strength and hop performance criteria prior to return to sports after ACL reconstruction,” Knee surgery, sports traumatology, arthroscopy : official journal of the ESSKA, vol. 19, pp. 1798–805, 09 2011.
- [22] R. Szeliski, Computer Vision: Algorithms and Applications. London: Springer-Verlag, 2011.
- [23] Z. Cao, T. Simon, S.-E. Wei, and Y. Sheikh, “Realtime multi-person 2D pose estimation using part affinity fields,” in CVPR, 2017.