Viewpoint Discovery and Understanding in Social Networks
Abstract.
The Web has evolved to a dominant platform where everyone has the opportunity to express their opinions, to interact with other users, and to debate on emerging events happening around the world. On the one hand, this has enabled the presence of different viewpoints and opinions about a usually controversial topic (like Brexit), but at the same time, it has led to phenomena like media bias, echo chambers and filter bubbles, where users are exposed to only one point of view on the same topic. Therefore, there is the need for methods that are able to detect and explain the different viewpoints. In this paper, we propose a graph partitioning method that exploits social interactions to enable the discovery of different communities (representing different viewpoints) discussing about a controversial topic in a social network like Twitter. To explain the discovered viewpoints, we describe a method, called Iterative Rank Difference (IRD), which allows detecting descriptive terms that characterize the different viewpoints as well as understanding how a specific term is related to a viewpoint (by detecting other related descriptive terms). The results of an experimental evaluation showed that our approach outperforms state-of-the-art methods on viewpoint discovery, while a qualitative analysis of the proposed IRD method on three different controversial topics showed that IRD provides comprehensive and deep representations of the different viewpoints.
1. Introduction
Social Media has now emerged as the dominant platform to discuss and comment on breaking news and noteworthy events that are happening around the world. On Twitter, for example, every second around 6,000 tweets are posted, which corresponds to over 350,000 tweets per minute, 500 million tweets per day and around 200 billion tweets per year111http://www.internetlivestats.com/twitter-statistics/ (April 4, 2018).
Although such networking services facilitate the expression of diverse opinions and viewpoints about particular topics, it has led to the widespread observation of phenomena such as media bias and the so-called echo chamber effect, where users are increasingly exposed to conforming opinions.
Different viewpoints and bias have been observed in tweets from regular newspaper publishers, and previous research has shown that based on these tweets it is possible to position these publishers with respect to their stance on economic and personal issues (Elejalde et al., 2017). Similarly, it has been shown that there is bias in the selection of which parts of ongoing events are reported and in which depth they are covered (Tran and Herder, 2015), arguably due to differences in national or regional interests, differences in political or societal orientation, and other factors.
It has been also shown that individuals generally read publications that are ideologically quite similar and are usually exposed to only one side of the political spectrum (Flaxman et al., 2016). Due to these self-selected echo chambers and the observation that users with similar interests and opinions are more likely to be friends on social media (the so-called homophily effect) (Aiello et al., 2012), polarized discussions of user groups with sometimes very different viewpoints are very common on social media.
As a large part of the population is nowadays exposed to biased, filtered or fake news, and actively participates in discussions with like-minded, there are real social costs and effects, as observed in the 2016 US election (Allcott and Gentzkow, 2017). In order to understand ongoing political or societal debates, or to analyze and interpret the course of historical events retrospectively, there is the need for methods that are able to detect the different viewpoints pertaining a topic and to understand what they are about.
In a nutshell, this paper makes the following contributions:
-
•
We propose the use of a popular graph partitioning method that exploits social interactions to cluster the users of a social network based on their viewpoint on a controversial topic. Contrary to existing works that follow a similar approach, the proposed method can be applied in cases with unknown number of viewpoints and also enables the detection of noisy groups of users that do not represent clear viewpoints.
-
•
To obtain a deeper understanding of a viewpoint, we introduce a method, called Iterative Rank Difference (IRD), which is based on the iterative use of an automatic term recognition algorithm. The proposed method can automatically identify descriptive terms that characterize the different viewpoints and also allows understanding how one or more specific terms are related to a viewpoint.
-
•
We present evaluation results which showcase that: i) the proposed viewpoint discovery method outperforms existing state-of-the-art topic models, ii) IRD provides comprehensive descriptions of the different viewpoints as well as of the terms that characterize them.
The remainder of this paper is organized as follows: Section 2 reports related works and the difference of our approach. Section 3 models the problems of viewpoint discovery and viewpoint understanding. Section 4 details the proposed viewpoint discovery method. Section 5 describes the proposed viewpoint understanding method. Section 6 presents evaluation results. Finally, Section 7 concludes the paper and discusses interesting directions for future research.
2. Related Work
Given a controversial topic, for example an issue like climate change or an entity like Donald Trump, viewpoint discovery aims to find the different viewpoints expressed about the topic in a set of documents or in a social network. This task can be considered a sub-task of Opinion Mining, which aims to analyze opinionated documents and to infer properties such as subjectivity or polarity222The survey in (Pang et al., 2008) provides a general review on Opinion Mining and Sentiment Analysis.. Discovering the different viewpoints usually involves (or is performed in parallel with) two other tasks: i) grouping the corresponding documents or users based on their viewpoints; ii) finding descriptive terms that characterize the viewpoints.
Viewpoint discovery has been applied to both documents and social media data. Below, we report works for both types of data sources.
2.1. Viewpoint Discovery in Documents
Paul and Girju (Paul and Girju, 2010) introduced a model, called Topic-Aspect Model (TAM), that jointly considers topics and aspects (where aspects can be interpreted as viewpoints in our case). TAM decomposes each document into a mix of topics that are characterized by a multinomial distribution over words and also exploits a second mix of aspects that affect the topics. To describe the viewpoints pertaining to a topic, (Paul et al., 2010) proposed a contrastive viewpoint summarization framework which is based on TAM and is able to find phrases that best reflect the different viewpoints.
Thonet et al (Thonet et al., 2016) proposed the Viewpoint and Opinion Discovery Unification Model (VODUM), an unsupervised topic model based on LDA (Blei et al., 2003) that leverages parts of speech to jointly discover viewpoints, topics, and opinions in a text (helping to discriminate between topic and opinion words).
Al Khatib et al (Al Khatib et al., 2012) studied the slightly different problem on how to automatically detect the differences in viewpoints between two articles in Wikipedia, where one article describes the subject matter in a more positive or negative way than the other. A statistical classifier is trained to predict the viewpoint score of a document, which reflects how positive or negative the viewpoint is.
Another interesting work studied the prediction and analysis of the ideological stance of legislators (Nguyen et al., 2015). The proposed topic model integrates regression techniques to estimate real-valued ideal points and can also extract and provide a vocabulary that characterizes the ideological discourse.
2.2. Viewpoint Discovery in Social Media
Given a controversial topic as well as the texts and interactions from the users discussing it on a social network, Thonet et al (Thonet et al., 2017) propose an unsupervised topic model, called Social Network Viewpoint Discovery Model (SNVDM), which jointly identifies subtopics, viewpoints and the discourse pertaining to the different subtopics and viewpoints. To infer the viewpoints, SNVDM exploits the homophily phenomenon (the tendency of individuals to associate and bond with similar others) and relies on the social interactions among the users. Moreover, to account for the sparsity of social networks and the weak connections between users, the authors extend SNVDM into the SNVDM-GPU model which leverages the Generalized Pólya Urn (GPU) scheme (Mahmoud, 2008).
Under the same assumption that social networks are homophilic, Barberá (Barberá, 2014) proposes a Bayesian Spatial Following model that groups Twitter users along a common ideological dimension based on who they follow.
Ren et al (Ren et al., 2016) describe a dynamic modeling strategy to infer contrastive opinions in a given stream of multilingual social texts by jointly modeling topics, entities and sentiment labels. However, contrast is based only on sentiment (positive, negative, neutral), not on viewpoints, and thus this approach actually models and infers sentiment polarity and partisanship.
Joshi et al (Joshi et al., 2016) present a topic model, called Political Issue Extraction (PIE), that estimates word-specific distributions denoting political issues and positions from an unlabeled dataset of tweets. The model uses affiliation information of political users as well as Twitter timelines of both political and non-political users. In the same context, (Conover et al., 2011) investigated how social media shape the networked public sphere and facilitate communication between communities with different political orientations. The authors showed that mentions and retweets, the two major mechanisms for public political interaction on Twitter, induce distinct network topologies: the retweet network is highly polarized, while the mention network is not.
Sachan et al (Sachan et al., 2014) study the different yet related problem of detecting communities on Twitter. The proposed topic model, called Social Network Latent Dirichlet Allocation (SN-LDA), combines both text and social interactions. However, such methods focus on discovering topical communities (for instance, users discussing about football) and not different viewpoints expressed on a common controversial topic. A similar community detection technique was combined with topic modeling to characterize opinions about human papillomavirus vaccines (HPV) on Twitter (Surian et al., 2016). Papadopoulos et al. (Papadopoulos et al., 2012) provide a comprehensive literature review of community detection approaches applied in social media.
There are also works that have applied traditional machine learning (supervised) classifiers to automatically identify the political affiliation and viewpoint of social media users, such as Naive Bayes (Fang et al., 2015), Support Vector Machine (Cohen and Ruths, 2013), Decision Trees (Pennacchiotti and Popescu, 2011) or Neural Networks (Rao and Spasojevic, 2016). However, although such models usually achieve high precision, they need training examples which may be very difficult to obtain.
Another related line of research has applied topic models for viewpoint discovery in forums (Qiu and Jiang, 2013; Qiu et al., 2013). These works exploit the threaded nature of forum posts which though is not the case in social networks like Twitter where threaded interactions are scarce.
Finally, there is a number of works that tackle the related problem of controversy detection. This task focuses on distinguishing whether a topic of online discussion is controversial or not. Works in this field handle the problem from different perspectives, e.g., by analyzing news articles (Choi et al., 2010; Mejova et al., 2014), by exploiting the social media (Popescu and Pennacchiotti, 2010; Garimella et al., 2016), or by focusing on Wikipedia pages (Borra et al., 2015; Dori-Hacohen and Allan, 2015). As regards social media, controversy detection has been studied on Twitter using both supervised (Popescu and Pennacchiotti, 2010) and unsupervised (Garimella et al., 2016) methods. Popescu and Pennacchiotti (Popescu and Pennacchiotti, 2010) proposed and evaluated three regression machine learning models for identifying controversial events in Twitter. The models make use of a variety of features, including linguistic, structural, sentiment and news-based ones. On the other hand, Garimella et al. (Garimella et al., 2016) developed a framework to identify controversy without prior domain-specific knowledge about the topics in question. The framework builds a conversation graph about a topic, partitions the graph to identify potential sides of the controversy, and measures the amount of controversy by analyzing characteristics of the graph.
2.3. Our approach
Compared to the existing works, in this paper we also exploit social interactions (like (Thonet et al., 2017) and (Conover et al., 2011)) and build an interaction graph where nodes correspond to users and edges to endorsements among the users. To detect the different viewpoints, actually the groups of users that represent the viewpoints, we make use of a popular multi-level graph partitioning algorithm, inspired by the work in (Garimella et al., 2016) which applies the same algorithm for the problem of controversy detection and quantification. However, contrary to this work, we propose the use of the quality metric conductance for deciding on the clusters that hold different viewpoints. In this way, our method can be also applied in cases of unknown number of viewpoints as well as for the identification of noisy groups of users that do not represent a clear viewpoint.
With respect to the problem of viewpoint understanding, in order to provide a deep understanding of a viewpoint, we propose the iterative use of an automatic term recognition algorithm that is based on rank difference (Kit and Liu, 2008). To our knowledge, this kind of algorithms has not been previously applied to a similar problem.
3. Problem Modeling
In our context, a controversial topic is a subject of public interest discussed in a social networking service where its users can post texts and also interact with each other. A controversial topic can be a specific event (e.g., US Election 2016), a general issue (e.g., abortion or gun control), or even an entity (e.g., Donald Trump or Palestine).
For a controversial topic , let be the set of all texts (posts) related to , posted in a social networking service by a set of users , in a specific time period. We can gather these texts by querying the social network using specific keywords that describe the topic. Let also be the vocabulary of , i.e., all terms/words that exist in the texts of . Now, let be the set of endorsement interactions among the users (e.g., likes or retweets) where each such interaction is associated with a post in and two users in (i.e., the interactions are related to the topic). For a post and two users , we can represent an interaction as a triple of the form , where the user is the initiator (or sender) of the interaction, user is the receiver, and is the mean (or channel) of interaction (e.g., likes the text posted by ).
We now model the problems of viewpoint discovery and viewpoint understanding as follows:
-
•
Viewpoint discovery: compute a set of user groups , where each group corresponds to a different viewpoint.
-
•
Viewpoint understanding: for each group , compute a set of top- descriptive terms that characterize the viewpoint. In addition, for a descriptive term , compute a new set of descriptive terms that characterize in the context of the viewpoint .
4. Viewpoint Discovery
Similar to (Garimella et al., 2016) and (Conover et al., 2011), we build an interaction graph , where nodes correspond to users and edges correspond to endorsements among the users. In our case, an edge connecting two users is undirected and exists if there is a sufficient number of interactions that involve them. In our case studies and experiments we draw an edge when there are at least 2 endorsements between the two users (similar to (Garimella et al., 2016)). This number seems to be sufficient for indicating a common viewpoint on a topic, while it also reduces the noise in the considered data.
Below, we first discuss how we decided on the clustering method to use in our problem (Section 4.1), and then describe the method we propose for detecting the clusters that hold different viewpoints (Section 4.2).
4.1. Choosing the proper clustering method
We need a clustering method which can ensure sparse connections among the different clusters. The intuition for this requirement is the following: the absence of an edge between two users does not imply different viewpoints, however users with different viewpoints will probably not endorse each other. Thus, contrary to classic community detection algorithms, ensuring dense connections within the same cluster is not a requirement for our problem. In addition, since the network can be quite large, containing thousands or even millions of users, we should avoid approaches that require pairwise node comparisons.
We studied the applicability of different network clustering algorithms:
-
•
Node similarity
-
•
The Louvain method (community detection)
-
•
Multi-Level Graph Partitioning (MLGP)
Node similarity algorithms aim to find nodes that are topologically similar, i.e., they share many of the same neighbors. Various similarity measures can be used, like cosine similarity, Pearson coefficient, or the Euclidean distance (Newman, 2010). However, similarity is measured between each pair of nodes, which makes their computation very time consuming for networks with large number of nodes.
The goal of community detection algorithms is the detection of the dense portions of the network. There is a plethora of algorithms for this kind of problem, like hierarchical clustering and modularity maximization. We tried one of the most popular modularity maximization algorithms called the Louvaine Method (Blondel et al., 2008). Modularity is a measure designed to measure the strength of division of a network into modules (groups or communities), where networks with high modularity have two main characteristics: i) dense connections between the nodes within modules, and ii) sparse connections between nodes in different modules (Newman, 2004). This means that, if there is no edge connecting two nodes in the same cluster, modularity get decreases as a penalty, for ensuring that the detected clusters are very dense. However, as we have already discussed, sparsity is common in large social networks: no edges between two users does not imply different viewpoints.
The goal of Multi-Level Graph Partitioning (MLGP) algorithms is the detection of partitions with a minimum “cut”, i.e., a minimum number of edges connecting different clusters. In such a method, the network is divided into a predetermined number of parts, chosen such that the cut is minimized. This approach is suitable in our case because it ensures sparse connections between nodes in different clusters. To avoid getting partitions of very different sizes (e.g., one partition containing only one node, and one containing all the other nodes), the size of the partitions need to be also taken into consideration. This can be done by computing the degree of the nodes that are inside each cluster. This normalized measure can be then used as the optimization criterion for finding the best solution. To find the optimal solution, we exploited a multi-level graph partitioning algorithm (of the METIS software package (Karypis and Kumar, 1995)) which falls under the type of heuristic algorithms.
4.2. Detecting the viewpoints
4.2.1. Choosing the right quality metric
We now need a quality metric for deciding on the clusters that hold different viewpoints. We experimented with the following measures (Almeida et al., 2011):
-
•
Modularity
-
•
Silhouette index
-
•
Coverage
-
•
Performance
-
•
Conductance
As we have already explained (cf. Section 4.1), modularity should be avoided for sparse graphs, since it gives high scores to clusters with sparse internal connections. The Silhouette index considers the similarity and dissimilarity between the nodes which in our case can be measured by their shortest path. However, this requires finding the shortest path for all pairs of nodes, which is impractical for very large sparse graphs. The coverage of a clustering is given as the fraction of the weight of all intra-cluster edges with respect to the total weight of all edges in the whole graph. Higher values of coverage means that there are more edges inside the clusters than edges linking different clusters, which translates to a better clustering. However, this measure does not consider the size of a cluster, which makes it unsuitable for our case, since it can give high scores to a clustering having a large number of very small clusters. Performance counts the number of internal edges in a cluster along with the edges that don’t exist between the cluster’s nodes and other nodes in the graph. Higher values indicate that a cluster is both internally dense and externally sparse. Similar to modularity, this measure is not suitable for large sparse graphs (Almeida et al., 2011).
Finally, the conductance of a cut is the ratio between the size of the cut and the minimum cluster volume (Kannan et al., 2004). The volume of a cluster is the total number (or the sum of the weights) of the edges with at least one endpoint in the cluster. Specifically, the conductance of a cluster of users can be computed as follows:
| (1) |
where and:
| (2) |
In simple words, the formula computes the percentage of edges starting from nodes within the cluster that point to nodes outside the cluster. Since conductance considers both the cut size and the volume of the clusters, this measure is suitable in our problem: a large cluster having a small cut (small number of edges pointing to nodes outside the cluster) will get a low conductance score, making it a good candidate for representing a concrete viewpoint.
4.2.2. Deciding on the clusters that hold different viewpoints
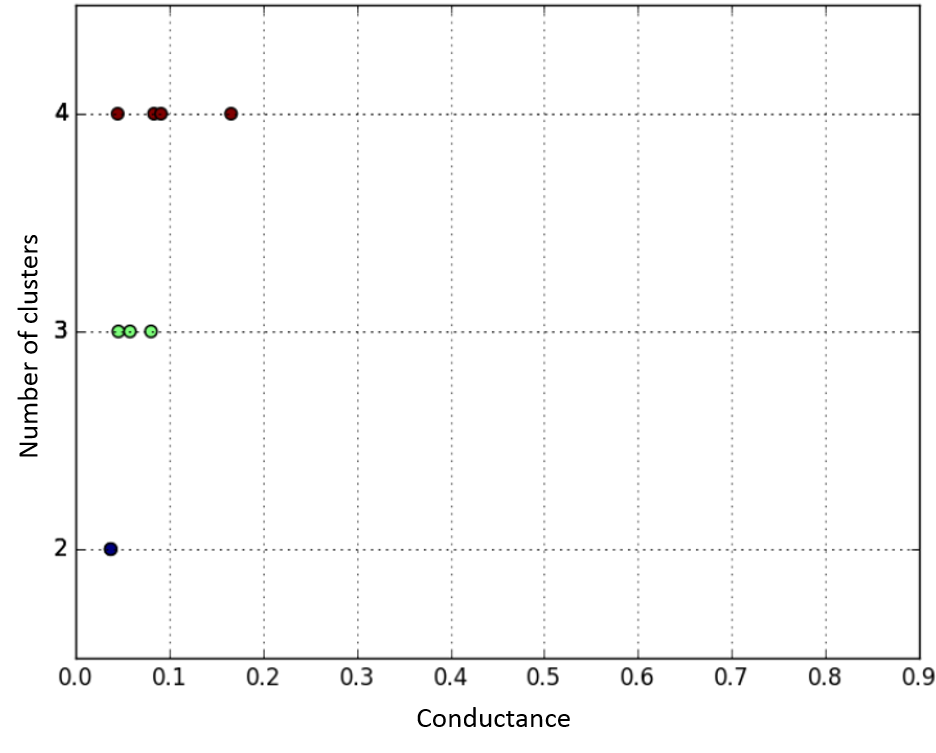
To find the clusters that hold different viewpoints, we inspect the conductance of the clusters for different graph partitioning approaches (values of ). If a cluster has a large conductance value, this means that the cluster has a strong connection with one or more of the other clusters and thus does not hold a different and clear viewpoint. In general, large conductance values is an indication of poor clustering. Hence, an ideal partitioning provides clusters with very low conductance values. In this case, the network exhibits a highly segregated structure, with limited connectivity among the different clusters, meaning that each cluster represents a different viewpoint.
Figure 1 depicts the conductance values for different graph partitioning scenarios for the controversial topic 2014 Scottish Independence Referendum, using the dataset provided in (Brigadir et al., 2015) which contains only supporters of “yes” and “no” (more in Section 6). We notice that for , the two clusters have very low conductance value. Notice that, since the considered graph is undirected, the clusters have always the same conductance value for (same number of edges connecting the two clusters, same minimum volume of the two clusters). For , there are two clusters with much bigger (compared to ) conductance value, while the third cluster has a very large value meaning that this cluster has a strong connection with one or both of the other two clusters. Thus, we should partition the graph using and select both clusters as representing different viewpoints.
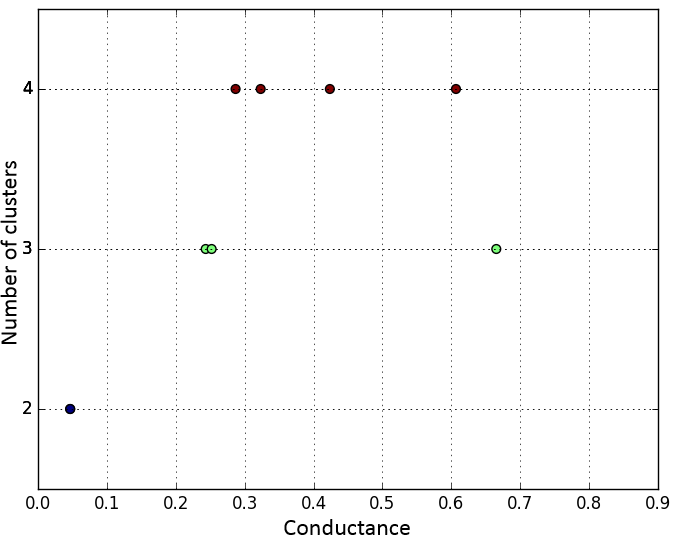
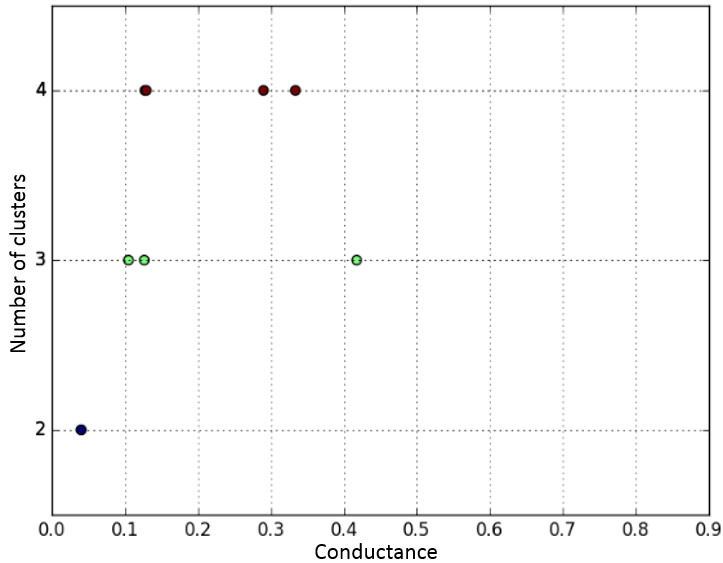
The conductance plot can also indicate cases where a bigger value of should be selected even if not all clusters represent viewpoints, because then we can filter out noisy data (i.e., users with no clear viewpoint). This can result in a better selection of the groups of users that hold different viewpoints. For instance, Figure 2 depicts the conductance plot for the topic 2016 US Presidential Election (using a manually created dataset, more in Section 6). Here we should better decide to partition the graph using because two of the clusters have very low conductance values (similar to the case of ) while the third one has a much larger value. Thus, in this case we can consider as viewpoints only the two clusters with the small conductance values and ignore the third cluster. To validate this, Figure 3 shows the network clustering for (left) and (right) using a force-directed layout algorithm (Jacomy et al., 2014), where colors correspond to different viewpoints detected by our method. We notice that, for there are two large well-concentrated clusters that correspond to two different viewpoints, but also several other very small clusters assigned to these two viewpoints. These small clusters is an indication of “noisy” groups of users with no clear viewpoint. For we notice that there are again two large well-concentrated clusters corresponding to two different viewpoints, while the third viewpoint (in green color) is very scattered and consists of several very small clusters.
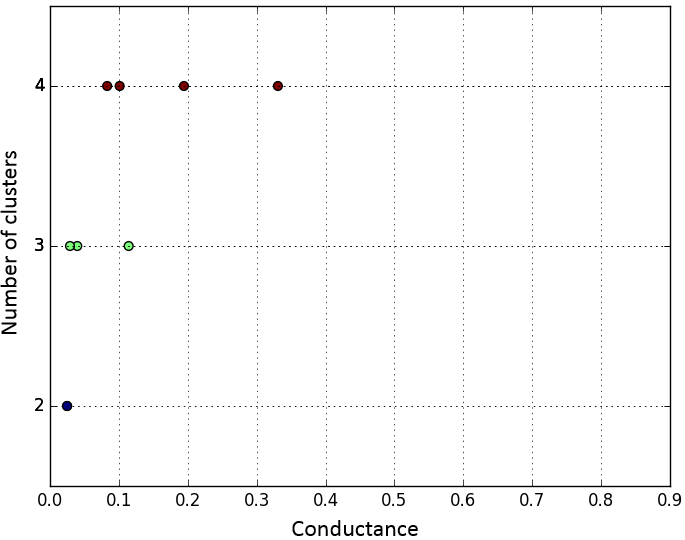
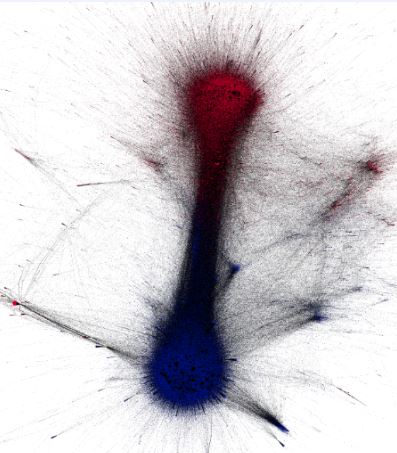
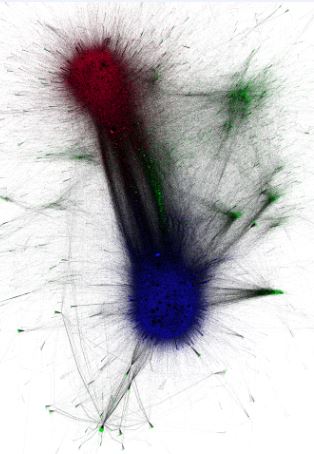
Figure 4 shows another example where three clusters are selected as representing different viewpoints. The plot corresponds to the topic 2016 Brexit referendum (more about the dataset in Section 6). We notice that using for graph partitioning, three clusters have low conductance values (below 0.1). Since the fourth cluster has a much larger value, we can consider it as noisy and ignore it. As we will see in Section 6, one cluster corresponds to supporters of Brexit, one to supporters of Bremain, and the third to the neutral viewpoint where users generally discuss the consequences of Brexit and its relation to other topics.
A simple algorithm for deciding both the number of clusters for partitioning the graph (value of ) and the number of clusters that hold different viewpoints is the following: We start by applying the proposed MLGP clustering method for and inspecting the conductance value of the two clusters (which should be the same). If it is large (above a threshold , e.g., ), it means that the topic is probably not controversial or has not induced much discussion on the underlying social network, or the gathered tweets/retweets used for building the graph are not a good representation of the topic. On the contrary, if the value is below the threshold, then they are both selected as candidate clusters representing different viewpoints. Then we partition the graph using . If the conductance value of all three clusters is very low, this means that all clusters should be selected since they all hold a different viewpoint. If only two of the clusters have low conductance value (below the threshold), then we should better select and ignore the third “noisy” cluster. We continue in a similar way for larger values of until we get the maximum number of clusters below the threshold for the larger value of .
5. Viewpoint Understanding
To understand a viewpoint, we propose the iterative use of a simple rank difference method introduced in (Kit and Liu, 2008). We call the proposed method Iterative Rank Difference, for short IRD.
First, we try to answer the question: what is a viewpoint about? Given a group of users representing a specific viewpoint, we analyze the texts posted by the users of and derive a list of top- descriptive terms that characterize the viewpoint. Then, to obtain a deeper understanding of a specific viewpoint, we try to answer the question: what is a term about? This allows understanding why a term appears in the list of a viewpoint’s top descriptive terms. For example, as regards the US 2016 presidential election, we may want to understand why the hashtag #trumpleaks appears in the top descriptive terms of the “against Donald Trump” viewpoint. Given a term , we answer this question by computing a set of other descriptive terms that characterize in the context of .
5.1. Rank Difference
The rank difference algorithm tries to distinguish the important terms of a specific corpus and filter out terms that do not characterize the corpus (Kit and Liu, 2008). The algorithm operates over two ranked lists of terms: one that has been extracted from the “subject corpus” (corpus of interest related to a subject for which we want to find the descriptive terms), and one extracted from a “contrasting corpus” (a general corpus or corpus representing a different subject). Both lists are ranked according to the same criterion, e.g., the frequency of the terms in the corresponding corpus. Rank Difference identifies those terms with the largest difference in ranking between both corpora, in other words those terms that are most specific for the subject corpus. The algorithm also considers the size of the lists in order to make the term ranks in the two corpora fairly comparable.
Formally, given the two ranked lists of terms and (one for the subject corpus and one for the contrasting corpus), the score of a term is computed as the difference in rank between the two corpora:
| (3) |
where is the rank (position) of in the corresponding list. A term receives a high score if its position in the subject corpus is high and its position in the contrasting corpus is low (notice that the highest position in a list has rank 1). The higher the score of a term, the more important this term is for the subject corpus. By contrast, the lower the score of a term, the more important this term is for the contrasting corpus. If a term is in the same rank in the two lists and the lists have the same size, then its score is zero meaning that this term is not important, neither for the subject corpus nor for the contrasting corpus.
Although normalization by the size of the lists makes the term ranks in the two corpora comparable, considering very large lists can affect the performance of this algorithm, e.g., by overemphasizing the importance of some terms with a low ranking criterion (e.g., frequency). For instance, if the top-100 terms of a list have a high frequency (e.g., ) but there is a long tail of noisy terms with very low frequency (e.g., 10,000 terms with frequency ), we should consider to cut the list in position 100.
5.2. First iteration: What is a viewpoint about?
To answer this question, we analyze the texts posted by all users in and create two lists of terms:
-
•
(subject list): Top- terms that occur in texts posted by the group of users representing the query viewpoint.
-
•
(contrasting list): Top- terms that occur in texts posted by all other groups of users representing the other viewpoints.
In both lists, the term frequency (number of occurrences in the texts) is used as the ranking criterion. Then, we run the rank difference algorithm in these two lists and get the list of descriptive terms that characterize .
5.3. Next iterations: What is a term about?
In the next iterations, we want to understand why one or more terms appear in the top- descriptive terms of a specific viewpoint. Given a term that characterizes a viewpoint , we run the rank difference algorithm on the following two lists:
-
•
(subject list): Top- terms in texts mentioning , posted by all users in .
-
•
(contrasting list): Top- terms in texts not mentioning , posted by all users in .
The term frequency is used again as the ranking criterion in both lists.
6. Evaluation
6.1. Effectiveness of Viewpoint Discovery
We evaluated the effectiveness of the proposed viewpoint discovery method using the two Twitter datasets introduced in (Brigadir et al., 2015)333http://dx.doi.org/10.6084/m9.figshare.1430449. The first dataset (Indyref) contains tweets about the 2014 Scottish Independence Referendum, where there are two main viewpoints: Yes (meaning support to Scottish independence), and No (meaning opposition to Scottish independence). The second dataset (Midterms) contains tweets about the 2014 U.S. Midterm Election. Here again, there are two main viewpoints: Democratic party supporters and Republican party supporters. Details about the creation of the datasets and the ground truth can be found in (Brigadir et al., 2015). Notice here that the ground truth for both datasets contains only users that belong to one of the two viewpoints, which however is not realistic. In a real setting, one has to collect a set of tweets and retweets related to a topic using some search terms, hashtags and/or user accounts, and then create a retweet graph which contains a very diverse and noisy set of users, many of who may not belong to a specific viewpoint. This makes the viewpoint discovery task much harder. However, since we are not aware of any other ground truth dataset that can be used for our problem (discovery of user-level viewpoints in a social network), we evaluate our approach using the aforementioned two datasets.444The SemEval 2016 Task 6 (Detecting Stance in Tweets) (Mohammad et al., 2016) focuses on tweet-level stance detection.
We compare the proposed multi-level graph partitioning method (MLGP) with the best (for each dataset) unsupervised topic model proposed in (Thonet et al., 2017), which outperforms previous works on the same problem using the same datasets. In order to have comparable results, we also discarded all the tweets with no interactions (replies or retweets) from the users in the dataset. We used Purity and Normalized Mutual Information (NMI) as the evaluation metrics. Purity measures the proportion of users who are assigned to the correct ground truth class, while NMI is based on mutual information and entropy (Danon et al., 2005).
Table 1 shows the results. The proposed MLGP method outperforms the best setting of the state-of-the-art topic model (SNVDM-GPU) in terms of both purity and NMI on both datasets. Figure 5 shows the conductance plots of the two datasets. We notice that, for the produced clusters have very low conductance values of around 0.04 in both datasets, while for the values are highly increased, especially on the Indyref dataset.
| Method | Indyref | Midterms | ||
| Purity | NMI | Purity | NMI | |
| SNVDM-GPU | 0.969 | 0.800 | 0.964 | 0.778 |
| MLGP | 0.988 | 0.908 | 0.983 | 0.876 |
6.2. Qualitative Analysis of Viewpoint Understanding
We used the proposed Iterative Rank Difference (IRD) method to try to understand the viewpoints of the following controversial topics:
-
•
Indyref: 2014 Scottish Independence Referendum
-
•
USElection: 2016 US Presidential Election
-
•
Brexit: 2016 Brexit referendum
For Indyref, we used the existing collection of tweets provided in (Kit and Liu, 2008) (Footnote 3), and we partitioned the graph using . For USElection and Brexit, we crawled topic-related tweets and retweets using the Twitter Advanced Search service and the retweet API. Tables 2 and 3 show the hashtags and user accounts used for collecting the tweets related to these two topics. For the USElection, we used for graph partitioning and selected the two clusters with the lowest conductance values as those representing different viewpoints, while for Brexit we used and selected three clusters (this selection is based on the method described in Section 4). For creating the subject () and contrasting () lists of top- terms required by IRD, we preprocessed the texts of the tweets, removed user mentions, stopwords, punctuations, 1- and 2-char words, and URLs, and lemmatized the remaining terms. Moreover, we used to cut the subject and contrasting lists in all cases except the 2nd iteration of the Indyref topic where we used (for Indyref the data is less and the term frequencies smaller compared to the other two topics).
| #USElection, #USElection2016, #trump, #MakeAmericaGreatAgain, @DaysOfTrump, #TrumpLeaks, #obamacare, #obama, #realDonaldTrump, #trump2016, #nevertrump, #Clinton, #Hillary, #hillaryClinton, #USElection, #BARACKOBAMA, #gop, #Republican, #ObamaFarewell, #OurFirstStand, #MAGA, #fakenews, @realdonaldtrump, @hfa @GOP, @BarackObama, @HillaryClinton, @TheDemocrates |
| #brexit, #notoeu, #betteroffout, #britainout, #leaveeu, #beleave, #loveeuropeleaveeu, #yestoeu, #betteroffin, #votein, #bremain, #strongerin, #leadnotleave, #voteremain, #stopbrexit |
6.2.1. What is a viewpoint about
In the first iteration, our objective is to understand what each viewpoint represents. For each topic, Tables 4-6 show the top descriptive terms of the corresponding viewpoints, as derived by the proposed method.
Regarding Indyref, we notice that the first viewpoint (Viewpoint 1) clearly represents the supporters of “Yes”, including terms like the hashtags #voteyes, #yes, and the words independent and national. The second viewpoint (Viewpoint 2) clearly represents the supporters of “No” containing many related terms like #nothanks, #bettertogether, #labourno, and #voteno. Moreover, currency seems to be an important topic for this viewpoint.
In the USElection topic, the first viewpoint (Viewpoint 1) represents the supporters of Hillary Clinton (or the opponents of Donald Trump), while the second (Viewpoint 2) the supporters of Donald Trump. We notice that the supporters of Hillary Clinton used hashtags like #nevertrump, #theresistance, #imwithher, and #trumpleaks to oppose to Donald Trump, while Trump’s supporters use hashtags like #trump2016, #trumptrain, #draintheswamp, #makeamericagreatagain, and #fakenews.
For Brexit, we see that the first viewpoint (Viewpoint 1) represents Brexit supporters (#go, #leave, free, control, #leaveeu), the second (Viewpoint 2) characterizes Bremain supporters (#votein, #stopbrexit) and their worry about the National Health Service (#nhs, cost), while the third (Viewpoint 3) reflects a more neutral viewpoint about the general consequences of Brexit (#stocks, #healthinnovations, #banking, #pharma, global) and its relation to other topics (#maga, #cdnpoli, #trumptrain), probably discussed by users of non-English languages (#ue, unido, reino, londres). We also notice that Viewpoint 2 (Bremain supporters) contains the terms #theresamay and johnson which characterize Brexit (Theresa May and Boris Johnson belong to the Conservative Party which supported Brexit). This is not surprising since users supporting a specific viewpoint may use terms and hashtags that characterize another viewpoint for criticizing it.
| Viewpoint 1 | Viewpoint 2 |
| #voteyes, #yes, westminster, meeting, independent, #scotland, murphy, event, national, folk | #nothanks, #bettertogether, currency, #labourno, #scotdecides, speech, alex, #voteno, part, seperation |
| Viewpoint 1 | Viewpoint 2 |
| #nevertrump, #theresistance, #obamafarewell, #imwithher, #resist, #trumps, gop, tweet, #gop, #trumpleaks, tax, #notmypresident, putin | #tcot, #trump2016, #pjnet, #trumptrain, #draintheswamp, video, #makeamericagreatagain, #fakenews, breaking, god, #realdonaldtrump, usa, fbi |
| Viewpoint 1 | Viewpoint 2 | Viewpoint 3 |
| democracy, #nexit, try, #go, #referendumm, #leave, #britain, free, control, #leaveeu | #tory, tory, johnson, #theresamay, boris, #votein, #stopbrexit, #nhs, cost, nhs | #ue, unido, reino, #maga, #stocks, #cdnpoli, europa, londres, #americafirst, royaumeuni, #trumptrain, #healthinnovations, #banking, #pharma |
6.2.2. What is a term about?
In the next iterations, our objective is to find more information about specific terms that characterize a viewpoint. This can help to obtain a deeper understanding of the viewpoint and its related context.
In the Indyref topic, Table 7 shows the top-5 descriptive terms of murphy and #voteyes (Viewpoint 1). Regarding murphy, we notice that the list provides context information about Jim Murphy: Jim Murphy was the leader of the Scottish Labour Party during the referendum, suggested that Labour could offer more tax and welfare powers for Scotland, while he is also believed to have supported the Iraq war. As regards #voteyes, we notice that the list does not provide much information. The reason is that there is also the hashtag #yes which semantically is the same with #voteyes. Both hashtags were interchangeably used by Twitter users to indicate their support to Scottish Independence, meaning that there are almost no tweets containing both hashtags. Thus, by creating the subject list without considering the similar hashtag #yes, we indirectly consider this term as belonging to the contrasting corpus. Table 8 shows the top-5 descriptive terms when considering both hashtags in the subject corpus. Now we notice that the list contains terms that characterize the support to “Yes”: an independent Scotland will give power and future to the country. Studying methods for the identification of identical terms is beyond the scope of this paper but an interesting direction for future research.
| murphy | #voteyes |
| leader, war, tax, labour, really | #scotland, future, #sexysocialism, #yesscot, #midlothiansaysyes |
| {#voteyes, #yes} |
| scotland, independent, power, future, country |
Regarding the USElection topic, Table 9 shows the top-5 descriptive terms of #trumpleaks (Viewpoint 1) and fbi (Viewpoint 2). For #trumpleaks we see that this term is related to a report authored by Scott Dworkin (#dworkinreport) which shows that Donald Trump has incorporated many registered businesses in Russia (#trumprussia), while the opponents of Donald Trump ask Congress to investigate whether sufficient grounds exist for his impeachment (#impeachtrump). As regards fbi, we notice that this term is related to the reopening of an investigation/case as well as to James Comey who served as the seventh director of FBI during the US election. Indeed, James Comey reopened an FBI investigation into Hillary Clinton’s use of private email server while she was secretary of State.
| #trumpleaks | fbi |
| #trumprussia, #impeachtrump, #dworkinreport, #amjoy, #muslimban | investigation, comey, reopen, director, case |
Finally, in the Brexit topic, Table 10 shows the top-5 descriptive terms of #nexit (Viewpoint 1), control (Viewpoint 1), {boris, johnson} (Viewpoint 2), and banking (Viewpoint 3). We notice that the top descriptive terms of #nexit (which is the hashtag used for the hypothetical Dutch withdrawal from the European Union) is related to similar hashtags used for other countries (France, Italy, Denmark, Sweden) as well as #euistheproblem, meaning that the supporters of Brexit contravene European Union. As regards control, it is clear that the supporters of Brexit believe that UK must take back the total control of the country as well as of its borders. Regarding {boris, johnson} (Viewpoint 2) we get general information about Boris Johnson who is member of the Conservative Party in the United Kingdom (conservative). Boris Johnson has been Secretary of State for Foreign and Commonwealth Affairs since 2016 (#foreignsecratery) and the Member of Parliament (MP) for Uxbridge and South Ruislip since 2015 (#mp). We also see the term biscuit which is related to his visit to a biscuit factory during his “Vote Leave” campaign. Finally, the top descriptive terms about banking (Viewpoint 3) relate this viewpoint to the effect of Brexit to UK stocks (#stocks, decrease, index) and the pharma industry (#healthinnovations, #pharma).
| #nexit | control | {boris, johnson} | banking |
| #frexit, #italexit, #dexit, #swexit, #euistheproblem | #takecontrol, border, uncontrolled, #betteroffout, #takebackcontrol | conservative, biscuit, #foreignsecratery, #mp, #borisjohnson | #stocks, #healthinnovations, #pharma, decrease, index |
7. Conclusion
We have proposed to combine a popular graph partitioning algorithm with a clustering quality metric for the problem of viewpoint discovery in social networks. A distinctive characteristic of the proposed method is that it does not require the number of viewpoints to be given as input. This makes our approach applicable also for cases with an unknown number of viewpoints, while it can also detect noisy groups of users that do not represent clear viewpoints. Evaluation results on publicly available ground truth datasets showed that our approach outperforms state-of-the-art topic models on the same problem.
To understand what a viewpoint is about, we proposed the iterative use of a simple rank difference algorithm. The introduced Iterative Rank Difference (IRD) method can automatically identify descriptive terms that characterize a viewpoint, allowing also to understand how a specific term is related to a viewpoint. Case studies on three different controversial topics showed that IRD can provide comprehensive representations of viewpoints and terms.
Regarding future research, we plan to study approaches for the timeline summarisation of topics and viewpoints that will allow understanding how a controversial topic evolves over time and with respect to the involved entities, events and subtopics. Another interesting direction is the semantic representation of topics and viewpoints which will enable the construction of queryable knowledge graphs about controversial topics.
Acknowledgements.
The work was partially funded by the European Commission for the ERC Advanced Grant ALEXANDRIA (No. 339233).References
- (1)
- Aiello et al. (2012) Luca Maria Aiello, Alain Barrat, Rossano Schifanella, Ciro Cattuto, Benjamin Markines, and Filippo Menczer. 2012. Friendship Prediction and Homophily in Social Media. ACM Trans. Web 6, 2, Article 9 (2012), 9:1–9:33 pages.
- Al Khatib et al. (2012) Khalid Al Khatib, Hinrich Schütze, and Cathleen Kantner. 2012. Automatic Detection of Point of View Differences in Wikipedia.. In COLING. 33–50.
- Allcott and Gentzkow (2017) Hunt Allcott and Matthew Gentzkow. 2017. Social media and fake news in the 2016 election. Journal of Economic Perspectives 31, 2 (2017), 211–36.
- Almeida et al. (2011) Hélio Almeida, Dorgival Guedes, Wagner Meira, and Mohammed J Zaki. 2011. Is there a best quality metric for graph clusters?. In Joint European Conference on Machine Learning and Knowledge Discovery in Databases. Springer, 44–59.
- Barberá (2014) Pablo Barberá. 2014. Birds of the same feather tweet together: Bayesian ideal point estimation using Twitter data. Political Analysis 23, 1 (2014), 76–91.
- Blei et al. (2003) David M Blei, Andrew Y Ng, and Michael I Jordan. 2003. Latent dirichlet allocation. Journal of machine Learning research 3, Jan (2003), 993–1022.
- Blondel et al. (2008) Vincent D Blondel, Jean-Loup Guillaume, Renaud Lambiotte, and Etienne Lefebvre. 2008. Fast unfolding of communities in large networks. Journal of statistical mechanics: theory and experiment 2008, 10 (2008), P10008.
- Borra et al. (2015) Erik Borra, Esther Weltevrede, Paolo Ciuccarelli, Andreas Kaltenbrunner, David Laniado, Giovanni Magni, Michele Mauri, Richard Rogers, and Tommaso Venturini. 2015. Societal controversies in Wikipedia articles. In Proceedings of the 33rd annual ACM conference on human factors in computing systems. ACM, 193–196.
- Brigadir et al. (2015) Igor Brigadir, Derek Greene, and Pádraig Cunningham. 2015. Analyzing discourse communities with distributional semantic models. In Proceedings of the ACM Web Science Conference. ACM, 27.
- Choi et al. (2010) Yoonjung Choi, Yuchul Jung, and Sung-Hyon Myaeng. 2010. Identifying controversial issues and their sub-topics in news articles. Intelligence and Security Informatics (2010), 140–153.
- Cohen and Ruths (2013) Raviv Cohen and Derek Ruths. 2013. Classifying political orientation on Twitter: It’s not easy!. In ICWSM.
- Conover et al. (2011) Michael Conover, Jacob Ratkiewicz, Matthew R Francisco, Bruno Gonçalves, Filippo Menczer, and Alessandro Flammini. 2011. Political polarization on twitter. ICWSM 133 (2011), 89–96.
- Danon et al. (2005) Leon Danon, Albert Diaz-Guilera, Jordi Duch, and Alex Arenas. 2005. Comparing community structure identification. Journal of Statistical Mechanics: Theory and Experiment 2005, 09 (2005), P09008.
- Dori-Hacohen and Allan (2015) Shiri Dori-Hacohen and James Allan. 2015. Automated controversy detection on the web. In European Conference on Information Retrieval. Springer, 423–434.
- Elejalde et al. (2017) Erick Elejalde, Leo Ferres, and Eelco Herder. 2017. The Nature of Real and Perceived Bias in Chilean Media. In Proceedings of the 28th ACM Conference on Hypertext and Social Media. 95–104.
- Fang et al. (2015) Anjie Fang, Iadh Ounis, Philip Habel, Craig Macdonald, and Nut Limsopatham. 2015. Topic-centric classification of twitter user’s political orientation. In Proceedings of the 38th International ACM SIGIR Conference on Research and Development in Information Retrieval. ACM, 791–794.
- Flaxman et al. (2016) Seth Flaxman, Sharad Goel, and Justin M Rao. 2016. Filter bubbles, echo chambers, and online news consumption. Public Opinion Quarterly 80, S1 (2016), 298–320.
- Garimella et al. (2016) Kiran Garimella, Gianmarco De Francisci Morales, Aristides Gionis, and Michael Mathioudakis. 2016. Quantifying controversy in social media. In Proceedings of the Ninth ACM International Conference on Web Search and Data Mining. ACM, 33–42.
- Jacomy et al. (2014) Mathieu Jacomy, Tommaso Venturini, Sebastien Heymann, and Mathieu Bastian. 2014. ForceAtlas2, a continuous graph layout algorithm for handy network visualization designed for the Gephi software. PloS one 9, 6 (2014), e98679.
- Joshi et al. (2016) Aditya Joshi, Pushpak Bhattacharyya, and Mark James Carman. 2016. Political Issue Extraction Model: A Novel Hierarchical Topic Model That Uses Tweets By Political And Non-Political Authors.. In WASSA@ NAACL-HLT. 82–90.
- Kannan et al. (2004) Ravi Kannan, Santosh Vempala, and Adrian Vetta. 2004. On clusterings: Good, bad and spectral. Journal of the ACM (JACM) 51, 3 (2004), 497–515.
- Karypis and Kumar (1995) George Karypis and Vipin Kumar. 1995. METIS–unstructured graph partitioning and sparse matrix ordering system, version 2.0. (1995).
- Kit and Liu (2008) Chunyu Kit and Xiaoyue Liu. 2008. Measuring mono-word termhood by rank difference via corpus comparison. Terminology. International Journal of Theoretical and Applied Issues in Specialized Communication 14, 2 (2008), 204–229.
- Mahmoud (2008) Hosam Mahmoud. 2008. Pólya urn models. CRC press.
- Mejova et al. (2014) Yelena Mejova, Amy X Zhang, Nicholas Diakopoulos, and Carlos Castillo. 2014. Controversy and sentiment in online news. Computation and Journalism Symposium (2014).
- Mohammad et al. (2016) Saif Mohammad, Svetlana Kiritchenko, Parinaz Sobhani, Xiaodan Zhu, and Colin Cherry. 2016. Semeval-2016 task 6: Detecting stance in tweets. In Proceedings of the 10th International Workshop on Semantic Evaluation (SemEval-2016). 31–41.
- Newman (2010) Mark Newman. 2010. Networks: an introduction. Oxford university press.
- Newman (2004) Mark EJ Newman. 2004. Analysis of weighted networks. Physical review E 70, 5 (2004), 056131.
- Nguyen et al. (2015) Viet-An Nguyen, Jordan Boyd-Graber, Philip Resnik, and Kristina Miler. 2015. Tea Party in the House: A Hierarchical Ideal Point Topic Model and Its Application to Republican Legislators in the 112th Congress. In Association for Computational Linguistics.
- Pang et al. (2008) Bo Pang, Lillian Lee, et al. 2008. Opinion mining and sentiment analysis. Foundations and Trends® in Information Retrieval 2, 1–2 (2008), 1–135.
- Papadopoulos et al. (2012) Symeon Papadopoulos, Yiannis Kompatsiaris, Athena Vakali, and Ploutarchos Spyridonos. 2012. Community detection in social media. Data Mining and Knowledge Discovery 24, 3 (2012), 515–554.
- Paul and Girju (2010) Michael Paul and Roxana Girju. 2010. A two-dimensional topic-aspect model for discovering multi-faceted topics. Urbana 51, 61801 (2010), 36.
- Paul et al. (2010) Michael J Paul, ChengXiang Zhai, and Roxana Girju. 2010. Summarizing contrastive viewpoints in opinionated text. In Proceedings of the 2010 Conference on Empirical Methods in Natural Language Processing. Association for Computational Linguistics, 66–76.
- Pennacchiotti and Popescu (2011) Marco Pennacchiotti and Ana-Maria Popescu. 2011. Democrats, republicans and starbucks afficionados: user classification in twitter. In Proceedings of the 17th ACM SIGKDD international conference on Knowledge discovery and data mining. ACM, 430–438.
- Popescu and Pennacchiotti (2010) Ana-Maria Popescu and Marco Pennacchiotti. 2010. Detecting controversial events from twitter. In Proceedings of the 19th ACM international conference on Information and knowledge management. ACM, 1873–1876.
- Qiu and Jiang (2013) Minghui Qiu and Jing Jiang. 2013. A Latent Variable Model for Viewpoint Discovery from Threaded Forum Posts. In Proceedings of NAACL-HLT. 1031–1040.
- Qiu et al. (2013) Minghui Qiu, Liu Yang, and Jing Jiang. 2013. Modeling interaction features for debate side clustering. In Proceedings of the 22nd ACM international conference on Information & Knowledge Management. ACM, 873–878.
- Rao and Spasojevic (2016) Adithya Rao and Nemanja Spasojevic. 2016. Actionable and Political Text Classification using Word Embeddings and LSTM. CoRR (2016).
- Ren et al. (2016) Zhaochun Ren, Oana Inel, Lora Aroyo, and Maarten de Rijke. 2016. Time-aware multi-viewpoint summarization of multilingual social text streams. In Proceedings of the 25th ACM International on Conference on Information and Knowledge Management. ACM, 387–396.
- Sachan et al. (2014) Mrinmaya Sachan, Avinava Dubey, Shashank Srivastava, Eric P Xing, and Eduard Hovy. 2014. Spatial compactness meets topical consistency: jointly modeling links and content for community detection. In Proceedings of the 7th ACM international conference on Web search and data mining. ACM, 503–512.
- Surian et al. (2016) Didi Surian, Dat Quoc Nguyen, Georgina Kennedy, Mark Johnson, Enrico Coiera, and Adam G Dunn. 2016. Characterizing Twitter discussions about HPV vaccines using topic modeling and community detection. Journal of medical Internet research 18, 8 (2016).
- Thonet et al. (2016) Thibaut Thonet, Guillaume Cabanac, Mohand Boughanem, and Karen Pinel-Sauvagnat. 2016. VODUM: a topic model unifying viewpoint, topic and opinion discovery. In European Conference on Information Retrieval. Springer, 533–545.
- Thonet et al. (2017) Thibaut Thonet, Guillaume Cabanac, Mohand Boughanem, and Karen Pinel-Sauvagnat. 2017. Users Are Known by the Company They Keep: Topic Models for Viewpoint Discovery in Social Networks. In CIKM.
- Tran and Herder (2015) Giang Binh Tran and Eelco Herder. 2015. Detecting Filter Bubbles in Ongoing News Stories.. In UMAP 2015 Extended Proceedings.