A Survey of Atomic Carbon [C I] in High-redshift Main-Sequence Galaxies
Abstract
We present the first results of an ALMA survey of the lower fine structure line of atomic carbon [C I] in far infrared-selected galaxies on the main sequence at in the COSMOS field. We compare our sample with a comprehensive compilation of data available in literature for local and high-redshift starbursting systems and quasars. We show that the [C I]() luminosity correlates on global scales with the infrared luminosity similarly to low- CO transitions. We report a systematic variation of / as a function of the galaxy type, with the ratio being larger for main-sequence galaxies than for starbursts and sub-millimeter galaxies at fixed . The / and / mass ratios are similar for main-sequence galaxies and for local and high-redshift starbursts within a 0.2 dex intrinsic scatter, suggesting that [C I] is a good tracer of molecular gas mass as CO and dust. We derive a fraction of % of the total carbon mass in the atomic neutral phase. Moreover, we estimate the neutral atomic carbon abundance, the fundamental ingredient to calibrate [C I] as a gas tracer, by comparing and available gas masses from CO lines and dust emission. We find lower [C I] abundances in main-sequence galaxies than in starbursting systems and sub-millimeter galaxies, as a consequence of the canonical and gas-to-dust conversion factors. This argues against the application to different galaxy populations of a universal standard [C I] abundance derived from highly biased samples.
1 Introduction
The growth, structure, dynamics, and eventually fate of star-forming
galaxies is largely regulated by the amount of
gas available to form stars, therefore a crucial parameter to estimate. While low- transitions of
carbon monoxide 12CO molecules and optically thin
dust emission are generally trustable tracers for the molecular
gas content of galaxies, they depend on the excitation conditions, metallicity, radiation field,
redshift, geometry, or a good photometric coverage of the far-infrared
emission, and their applicability becomes progressively more observing
time consuming with increasing redshift (e.g., Magdis et al., 2012a, 2017; Carilli & Walter, 2013; Bolatto et al., 2013; Scoville et al., 2014). Alternative and independent proxies
are, therefore, highly valuable. These include cold
molecular and photodissociation region (PDR) gas tracers, responsible for a
large fraction of cooling (e.g., [C II] m, Zanella et al. 2018; polycyclic
aromatic hydrocarbon features, PAHs, Cortzen et al. 2018).
The sub-millimetric atomic carbon transitions
[C I] () ( GHz) and
[C I] () ( GHz) have been put forward as potential
tracers of the bulk of the molecular gas in galaxies. These lines have
an excitation temperature of K and K,
respectively, and a critical density for collisions with hydrogen atoms
of cm-3. They can, thus, probe a
wide range of ISM conditions, and they are normally found associated
with PDRs. Early simple plane-parallel modeling of these regions,
predicting [C I] just in narrow gas slabs between CO and [C II],
generated an initial skepticism on the real
usefulness of [C I] transitions as molecular gas tracers, recently overcome by a growing body of
theoretical and observational work. Modern PDR models including
non-equilibrium chemistry (Stoerzer et al., 1997), turbulent mixing
(Xie et al., 1995; Glover et al., 2015), clumpy geometries (Stutzki et al., 1998), and
the effect of cosmic rays (Papadopoulos et al., 2004; Bisbas et al., 2015, 2017) can better explain the
detection of [C I] fully concomitant with CO and 13CO over a
wide range of conditions, with a surprisingly constant ratio
[C I] and tightly correlated
intensities (e.g., Keene et al., 1996; Ojha et al., 2001; Ikeda et al., 2002).
The use of [C I] as a tracer of
the molecular gas mass could be even advantageous over the
traditional 12CO molecule in many respects: (1) the [C I] lines are as optically thin as 13CO
(,
Ojha et al. 2001; Ikeda et al. 2002 in giant molecular clouds in the Milky
Way and its center), allowing us to probe higher column
densities of cold molecular gas than 12CO; (2) they do not suffer from the “excitation bias”
affecting the high- () 12CO transitions, the latter being unable
to capture cool (kinetic temperature 50 K) and
sub-thermally excited gas (at densities of cm-3, Papadopoulos et al. 2004),
especially in presence of strong UV radiation fields; (3) models show
that the [C I] luminosity correlates with the total better than both
ionized carbon [C II] and CO , regardless of
the local radiation intensity field and spanning at least 4 orders of
magnitude in density ( cm-3, Madden et al. in
prep.); (4) for the high
cosmic rays rates expected in high-redshift galaxies, CO is destroyed,
while [C I] and [C II] become more
abundant (Papadopoulos et al., 2004; Bisbas et al., 2015, 2017); (5) the
simple three-level structure of [C I] allows
for breaking the temperature-density degeneracy hampering other
line tracers, and the excitation conditions of the molecular gas (i.e., its
excitation temperature ) can be straightforwardly
derived from the ratio / (Weiß et al., 2003).
The [C I] and [C I] transitions have been detected in
molecular clouds of the Galactic disk, the Galactic center, and other
nearby galaxies (Stutzki et al. 1997; Gerin & Phillips 2000; Ojha et al. 2001; Ikeda et al. 2002 for some
early measurements, Kamenetzky et al. 2016; Israel et al. 2015; Lu et al. 2017; Jiao et al. 2017 among the
others for more recent compilations). At high redshift, the
detections reported so far include strongly starbursting
sub-millimeter galaxies (SMGs), radio-galaxies, and quasar hosts (QSOs), often
gravitationally lensed and magnified up to factor of
(e.g., Walter et al., 2011; Alaghband-Zadeh et al., 2013; Gullberg et al., 2016; Bothwell et al., 2017; Popping et al., 2017, and references therein). First results seem to
indicate that in these galaxies the excitation
properties of the interstellar medium and the [C I] abundances are
similar or more extreme than in (Ultra-)Luminous InfraRed Galaxies
((U)LIRGs) and starbursts in the local Universe. Nevertheless, despite being a
valuable reference sample,
this handful of galaxies () selected in diverse ways is not
representative of the average
main-sequence population (e.g., Noeske et al., 2007; Daddi et al., 2007; Elbaz et al., 2007; Magdis et al., 2010), thus strongly biasing the
general conclusions we can draw about the bulk of high-redshift
galaxies. In order to remedy this situation, we designed and carried out a survey with the
Atacama Large Millimeter Array (ALMA), targeting [C I] in upper main-sequence
galaxies in the COSMOS field at . Here we present
the first results on a sample of objects with secure
[C I], dust continuum, and/or CO determinations, starting
exploring the potential use of [C I] as an effective tracer of the
molecular gas on global scales in normal main-sequence galaxies.
This work is structured as follows. In Section 2 we describe how we selected the sample of main-sequence galaxies and the available data; in particular, in Section 2.3 we present the new ALMA data targeting [C I], along with results from independent programs targeting other CO lines for the same objects; in Section 3 we compile data from the literature to build a comparison sample for our sources; Section 4 contains the analysis and the main results of this work, followed by a discussion in Section 5 and the conclusions in Section 6. Unless stated otherwise, we assume a CDM cosmology with , , and km s-1 Mpc-1 and a Chabrier initial mass function (IMF, Chabrier, 2003). All magnitudes are expressed in the AB system. All the literature data have been homogenized with our conventions.
2 Sample and observations
2.1 Sample selection
We selected targets in the COSMOS field (Scoville et al., 2007) with (1) an available stellar mass
estimate (Muzzin et al., 2013; Laigle et al., 2016); (2) a spectroscopic
confirmation with optical or near-infrared spectrographs from the
COSMOS master catalog (Salvato et al., in prep.); and (3) a Herschel/PACS
100 and/or 160 m detection in the publicly available
PEP catalog (Lutz et al., 2011). The latter requirement resulted in the selection
of massive galaxies mainly on the upper main sequence and with mean
dust temperatures of K. We further chose sources at to
maximize the overlap with parallel and independent ALMA programs targeting CO and
CO (Section 2.3, Daddi et al. in prep.). These criteria drove to an initial
pool of sources. We then grouped the sources to maximize the
number of targets observable in frequency configurations of ALMA Band
6. This resulted in the final selection of sources in the redshift
ranges and , randomly sampling
the whole interval of total infrared luminosities of the
original parent sample. The first redshift
interval allowed us to simultaneously cover [C I] and the CO transition
( GHz, Section 2.3).
Here we present the results for sources with both (1) an
unambiguous spectroscopic confirmation from a sub-millimeter transition,
and (2) an estimate of the CO flux and/or of the dust
continuum emission, so to ensure at least one molecular gas mass
determination with a standard method (Section 4.4).
The former criterion allows us to confidently measure even weak
[C I] fluxes or put stringent upper limits at the expected line
location. In fact, a non detection could be due to either intrinsic weak [C I] emission or to the absence of frequency coverage owing to inaccurate
redshifts. Significant offsets between optical/near-infrared and
sub-millimeter redshift estimates are not unusual, especially
considering the heterogeneous original data catalogs in the literature and the
different approaches to assess the redshift quality. Some of the
sources we selected did have initial low-quality flags in the COSMOS compilation.
The requirement of alternative gas tracers
excludes extra-sources with a single [C I] line detection and
no dust continuum or any CO emission covered. The rest of
the sample not analyzed here is characterized by: (1) good coverage of the far-infrared
SED, but low quality optical/near-infrared
spectra and no sub-millimeter lines detection ( sources) or ascertained wrong
redshifts from CO lines that became available after our ALMA
observations ( objects). In the latter case, the [C I] transition fell outside the
covered frequency range or could not be identified unambiguously;
(2) no detections in or more followed-up sub-millimeter lines
( galaxies), despite good quality flags associated with and good coverage of the far-infrared SED: this might be
due to a wrong association with an
optical/near-infrared counterparts or redshift quality assessment;
(3) good quality , but serious blending and source
misidentification in the far-infrared and sub-millimeter bands, which
we could verify only a posteriori with
new catalogs becoming available ( sources); (4) a combination of
low quality and bad coverage or even non-detection in the far-infrared
SED based on the new catalogs superseding the previous compilations
( galaxies). For these galaxies, the absence or a spectroscopic confirmation from a
sub-millimeter line and/or an alternative gas
tracer securely detected, either dust or CO , does not allow a
proper assessment of [C I] as a proxy for the molecular gas content
in our sample.
Respectively % and % of the sources presented here are detected
with a cumulative infrared signal-to-noise ratio and
in the “super-deblended”
catalog by Jin et al. (2018, see below). The latter became available after our
ALMA observations and superseded the PEP catalog in our analysis.
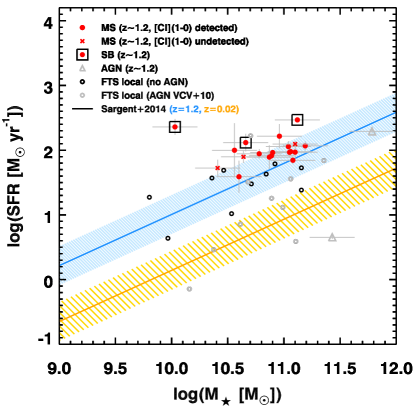
Moreover, galaxies lie on the main sequence at their redshift,
are classified as starbursts ( above the main
sequence), and suffer from a significant contribution from AGN
emission (Figure 1). The main-sequence galaxies are on
average above the
parametrization by Sargent et al. 2014, as expected from our
selection.
A discussion of the whole sample and the detailed combined modeling of all the CO and [C I] transitions is postponed to a dedicated forthcoming paper (Valentino et al. in prep.).
2.2 Ancillary data
Our sample benefits from the excellent photometric and spectroscopic coverage available in COSMOS. In particular, we adopted the stellar masses listed in Laigle et al. (2016), consistent with the values derived by Muzzin et al. (2013), both modeling the UV to near-infrared SEDs with standard recipes. Moreover, we modeled the “super-deblended” infrared photometry Jin et al. (2018) as in Magdis et al. (2012b) to derive the galaxy integrated far-infrared properties. The “super-deblending” of the highly confused far-infrared bands is based on an active choice of the radio and 24 m priors based on the galaxies spectral properties, reducing the blending degeneracies and resulting in well behaved flux density uncertainties (see Liu et al. 2018 for a detailed description of the method). Whenever available, we fit the emission from Spitzer/MIPS 24 m (Sanders et al., 2007), Herschel/PACS (Lutz et al., 2011) and SPIRE bands (Oliver et al., 2012), JCMT/SCUBA2 (Geach et al., 2017), ASTE/AzTEC (Aretxaga et al., 2011), IRAM/MAMBO (Bertoldi et al., 2007), and ALMA continuum emission at mm (Section 2.3) with an expansion of the Draine & Li (2007, DL07) model library (Figure A.1 in Appendix). We further included a dusty torus component surrounding active galactic nuclei (AGN) following Mullaney et al. (2011) and subtracted this contribution from the total we derived. Therefore, always refers only to the component due to star formation for this sample. We then converted into SFR as yr-1 (Kennicutt 1998a, converted to a Chabrier IMF). The emission from the dusty torus is relevant (% and % of ) in sources, flagged everywhere as “AGN” hereafter. Moreover, their stellar masses are likely overestimated, due to significant AGN emission in the near-infrared bands. Therefore, for the purpose of this work, we will not include the AGN in any further step of the analysis. While fitting the SEDs, we included the upper limits in every band, modeling the nominal values weighted by their large uncertainties. We then bootstrapped the values within the observed errors to estimate the statistical uncertainties on the derived quantities. In Table 1 and 2, we report the m total for all our galaxies, the contribution from dusty tori, and the total dust mass . We note that is well constrained for the vast majority of our sample, while critically relies on the availability of a measurement in the Rayleigh-Jeans tail of the dust emission.
2.3 ALMA [C I](1-0) and CO observations
We collected Atacama Large Millimeter Array (ALMA) Band 6 observations
during Cycle 4 (Project ID: 2016.1.01040.S, PI:
F. Valentino). Galaxies were grouped in three scheduling blocks
targeting [C I] ( GHz)
and CO ( GHz) at , and [C I] only at within
contiguous spectral windows (SPWs) of 1.875 GHz and a requested spectral
resolution of MHz ( km s-1). Two out of three of the blocks
were fully observed, while the third was incomplete, resulting in a
higher rms. Data were collected in
configuration C40-1, corresponding to a synthesized beam of
”. Galaxies are generally not (or marginally) resolved,
ensuring minimal flux losses. We
reduced the raw data with the standard ALMA pipeline with CASA
(McMullin et al., 2007). We then converted the calibrated data cubes to
uvfits and analyzed them with GILDAS
(Guilloteau & Lucas, 2000). We extracted 1D spectra using PSFs and circular Gaussians
models and fitting visibilities in the uv space with the iterative
process described in Daddi et al. (2015). The [C I] spectra are shown in
Figure A.1 in Appendix. We looked for emission
lines scanning the signal-to-noise ratio (SNR) spectrum. We measured fluxes as the weighted
average flux density within the channels maximizing the SNR, times the
velocity width covered by these channels. We
further fit single or double Gaussians to the line profile to estimate
total fluxes, generally % larger than the fluxes measured
over the number of channels maximizing the SNR. We finally adopted
the first approach, applying a correction of % to the line fluxes. When multiple lines
were available, we measured fluxes and upper limits on the same velocity width of the
brightest line. These results agree with measurements leaving
each line center and width free to vary. We measured integrated
[C I] fluxes at in sources down to an
average rms/beam of Jy km s-1 for a line width of km s-1 and a
final velocity resolution of km s-1. Fifteen out of
sources have [C I] detections significant at
. All the remaining sources have either one or multiple CO lines
detected at at the same redshift (see next paragraph), allowing us to explore
the regime or to put secure upper limits on [C I].
We simultaneously measured
the continuum emission at observed mm over GHz assuming an
intrinsic slope of (). We detected significant continuum emission at
in sources down to an rms of mJy on the
full frequency range.
From the same observing campaign, we similarly measured CO fluxes at significance in all galaxies with frequency
coverage of this line. Moreover, 15
and 11 galaxies of our sample have been observed by ALMA Bands 6 and 3
independent observations
targeting CO and CO , respectively (Project IDs: 2015.1.00260.S,
2016.1.00171.S, PI: Daddi; Daddi et al. in prep.). Data were
collected at similar spatial resolutions, reduced and analyzed as
we described above. For the purpose of the present work, we used
high-SN CO emissions to (1) fix the center of the
circular Gaussian or PSF to extract the spectrum, the central line
frequency, and the width of [C I]; (2) to
measure gas masses from CO ; and (3) to measure mm continuum
emission. We do not find evidence of systematically broader or narrower [C I] lines
than CO transitions, when the velocity width is let free to vary.
We significantly detected CO and CO in all 11 and 15 targeted galaxies, and
continuum emission at observed mm for and
galaxies covered by Band 3 and 6 observations, respectively.
This brings the overall number of sources with spatial resolution mm continuum detection
to .
We report the observed [C I] and CO fluxes and luminosities in Table 1. A full compilation including the CO and CO fluxes will be discussed in future work (Valentino et al. in prep.).
3 Literature data
We compared our results with observations available in literature. We collected and homogenized line luminosities and galaxy properties to properly match our conventions.
3.1 Local galaxies
This sample is drawn from the public compilation of all
Herschel/Fourier Transform Spectrometer (FTS) observations in the
Herschel Science Archive of local galaxies by
Liu et al. (2015, L15 hereafter). These sources are part of the IRAS
Revised Bright Galaxy Sample (Sanders et al., 2003) and covered at
m by Herschel/PACS. FTS simultaneously spanned
the GHz frequency interval, covering all CO lines with
, the [C I] and [C I] lines, and several
other transitions. L15 reduced the FTS raw data with the SPIRE v.12 calibration
products and the Herschel Interactive Processing Environment
pipelines (HIPE
v12.1.0, Ott, 2010). They extracted all the lines
simultaneously with customized optimized HIPE spectral line fitting scripts
on the unapodized spectra with varied-width Sinc-convolved Gaussian
(SCG) functions, and they estimated the line flux errors from the rms of the
spectra near each line (see L15 for further details).
In total we retrieved galaxies (out of in the compilation by L15) with a
[C I] detection up to .
We corrected the far-infrared luminosities integrated over the
m interval reported in
L15 to match the m total
we adopt here, by multiplying by a factor . We
obtained this value by comparing the original with from SED modeling as described in Section
2.2 for the subset of galaxies from the Great
Observatories All-Sky LIRGs Survey (GOALS, Armus et al., 2009)
included in L15. Emission line fluxes and infrared
luminosities have been beam-matched as described in
L15 and reported to the total, galaxy-integrated values back-applying
the beam correction based on PACS photometry
().
We further cross-matched the sample in L15
with the alternative compilation of Herschel/FTS observations
and low- CO transitions from ground based facilities by
Kamenetzky et al. (2016, K16). First, we checked that the FTS beam measurements
for galaxies with [C I] detections in both samples were consistent.
Then, we corrected the CO line measurements within the fixed 43.5”
beam in K16 (their Table 3) to the
galaxy-integrated values. We multiplied the fluxes in K16 by , where are the galaxy-integrated [C I] fluxes in L15 and the [C I] fluxes within a fixed 43.5” beam by K16. The median correction factor is and
for sources closer and farther than Mpc,
respectively. When multiple estimates of the same low- CO transitions were available, we assumed a SNR-weighted average as
representative of the line flux.
Note that the line ratios do not suffer from extra uncertainty due to the
beam correction than what reported in the K16 compilation. Moreover,
for the closest sources the final values might be representative mainly of the nuclear regions.
Out of sources with a [C I] detection, and have a CO and CO detection, respectively.
We further estimated the stellar masses of galaxies of the FTS sample with available -band imaging from 2MASS (Skrutskie et al., 2006) averaging the values obtained following Arnouts et al. (2007, Eq. 2) and Juneau et al. (2011, Eq. B1, B2). We checked these results against the full UV to near-infrared SED fitting for a subset of objects in common between the whole compilation of L15 and the sample studied by U et al. (2012), finding consistent results. Figure 1 shows the location of the galaxies with a [C I] detection in the – SFR() plane, typically lying above the main sequence at their redshift. Since AGN can contaminate both and the -band derived , we flagged known active galaxies listed in the catalog by Véron-Cetty & Véron (2010, VCV10). Among the non-active galaxies, % () are LIRGs ( ). For the local sample, we do not attempt to disentangle the contribution of the dusty torus to the total . In the rest of the paper, we will refer to the sample of local galaxies as “FTS Local” or “Local LIRGs”, when they do not host a bright AGN.
3.2 High-redshift sub-mm galaxies and quasars
We assembled a sample of sub-millimeter galaxies (SMGs) and quasars (QSOs) with [C I] coverage from Walter et al. (2011, W11), Alaghband-Zadeh et al. (2013, AZ13), and Bothwell et al. (2017, B17). We refer the reader to these papers for fully detailed references, sample selection, and observations. W11 and AZ13 targeted or collected information on typical SMGs at detected at m, with a tail of well-studied QSOs extending up to . A large fraction of these sources are gravitationally magnified up to and are detected in CO and CO . Similarly magnified are mm detected sub-millimeter galaxies in B17, identified in a blank-field survey with the South Pole Telescope (SPT, Vieira et al. 2010; Weiß et al. 2013), with spectroscopic information on high- (Weiß et al., 2013, B17) and low- transitions (CO , Aravena et al., 2016). The final sample consist of galaxies, with [C I] detections at . We re-derived their total and dust masses , modelling their far-infrared SED applying the same method described in Section 2.2. The SPT-SMGs galaxies are all detected in SPIRE , , and m, LABOCA m, SPT 1.4 and 2.0 mm, and ALMA 3 mm bands (Weiß et al., 2013). The SEDs of SMGs and QSOs from W11 and AZ13 are sampled less homogeneously, but ensuring a good coverage of both the peak and the Rayleigh-Jeans of the dust emission in the vast majority of cases. Applying our recipes, we estimate total () larger than the original values derived with modified black body curves for SMGs (QSOs), including a correction for the different integration limits. We also estimate for the SPT-SMGs systematically larger than previously reported (Aravena et al., 2016). The systematic differences in and fully depend on the adopted models (modified black body law, DL07) and their parameters (effective dust emissivity index , dust mass absorption coefficient , peak temperature, Magdis et al. 2012b). The discrepancy in is larger for QSO hosts owing to the dusty torus emission mid-IR bands, where the difference between modified black body curves and DL07 models is more significant. All the quantities presented here have been corrected for magnification. Moreover, we correct the luminosities of SMGs for the contribution of AGN similarly to what we did for the MS sample. We find only (SPT-)SMG whose SED is dominated by a dusty torus (% of the total ). For known bright QSOs at high-redshift in W11, we do not attempt to separate the star formation and AGN contributions to , being largely dominated by the latter. However, we will not consider these sources in the analysis any further, but simply show their position in the various plots for reference. Stellar masses are not available for this high-redshift sample, apart from sources listed in B17. Therefore, we could not place these objects in the – SFR plane and canonically define them as SB or MS based on these observables. However, their observed ISM conditions, gas and SFR densities, and SFEs generally distinguish SMGs from MS galaxies (e.g., Daddi et al., 2010a; Genzel et al., 2010; Bothwell et al., 2013; Casey et al., 2014). In the following, we will label “SMGs ()” the sample from W11 and AZ13, “QSOs (high-z)” the sources with clear AGN signatures from W11, and “SPT SMGs ()” the sample by B17. Moreover, we will consider SMGs as starbursting systems and not typical MS galaxies.
4 Analysis and results
4.1 The – relation
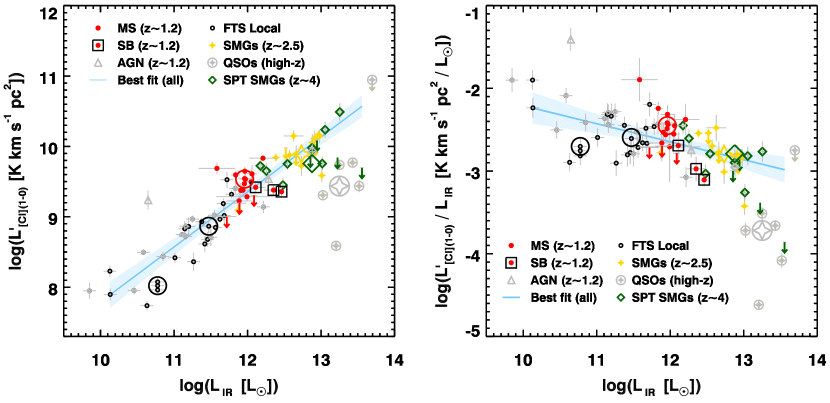
Following Solomon & Vanden Bout (2005), we computed the [C I] line luminosities in K km s-1 pc2, representing the integrated source brightness temperature:
| (1) |
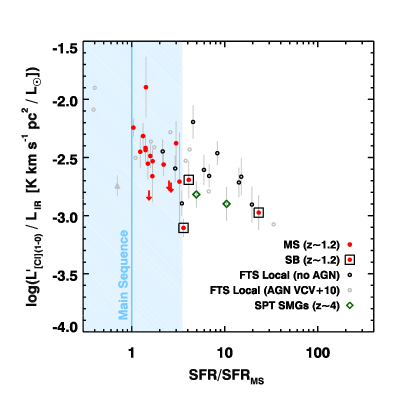
where is the measured velocity-integrated line flux in Jy km s-1, the observed line frequency in GHz, the redshift of the source, and is the luminosity distance in Mpc. Figure 2 shows the relation between the total and for our sample of MS galaxies and the literature compilation of starbursting sources at various redshifts. Both a Spearman’s rank and a Pearson’s correlation coefficients show that the two quantities are correlated, considering all detected sources and excluding QSOs and AGN (, ). We further applied a linear regression analysis on – both using a Bayesian (linmix_err.pro, Kelly 2007) and a -minimization algorithm (mpfit.pro, Markwardt 2009) taking into account the uncertainties on both and , and including the upper limits on in the Bayesian fit. Since and are proxies for the integrated SFR and , this relation is analogous to the Schimdt-Kennicutt relation (Schmidt, 1959; Kennicutt, 1998b, with the X and Y axes generally inverted). The two algorithms we applied provided fully consistent results within the uncertainties, and the effect of upper limits is negligible. We modeled a total of [C I]-detected galaxies and upper limits. The Bayesian best fit model returns a sublinear slope of with an observed scatter of dex. Note that AGN and QSOs are not included in the fit, nor in the calculation of . Their location in the diagram is mainly driven by their , boosted by the contribution of the dusty tori in the mid-IR regime, adding to moderately larger intrinsic luminosities than high-redshift SMGs at fixed (W11). Modeling only the starbursting population (i.e., SB at , local LIRGs, and SMGs) provides a similar slope of . Interestingly, these values are consistent with that of the – relation (, Sargent et al. 2014), reinforcing the connection between [C I] and CO. Moreover, our MS detected galaxies appear to have larger / ratios than SMGs. This is more evident in the right panel of Figure 2. The mean value of for MS galaxies is , higher than the mean for SMGs at ( dex) and SPT-SMGs at ( dex), where the uncertainties represent the error on the mean. We included the upper limits on [C I] in the calculation using a survival analysis (KM estimator, Kaplan & Meier, 1958). This difference is significant at a level. The median values are fully consistent with the mean. The ratio for the local sample of non-active galaxies is consistent with the estimate for MS galaxies, but it suffers from a very large dispersion. In Figure 3 we further show the / ratio as a function of the distance from the main sequence () as parametrized in Sargent et al. (2014). We included only sources with a stellar mass estimate, i.e., all our galaxies, part of the local LIRGs, and SPT-SMGs. Excluding galaxies with AGN signatures, the / ratio and are mildly anti-correlated (, ), with SMGs and SBs at showing systematically lower ratios than MS galaxies, as in Figure 2. However, the scarce statistics of lower main-sequence sources and SBs with available prevents us from deriving more definitive conclusions. From a physical perspective, since traces the gas mass and the SFR, their ratio is a proxy for the gas depletion timescale . The observed trends would then suggests a drop of this quantity (or equivalently an increment of SFE) with increasing and distance from the main sequence, analogously to the well established correlations observed for CO (e.g., Daddi et al., 2010b; Magdis et al., 2012b; Genzel et al., 2015; Tacconi et al., 2018).
4.2 The – relation
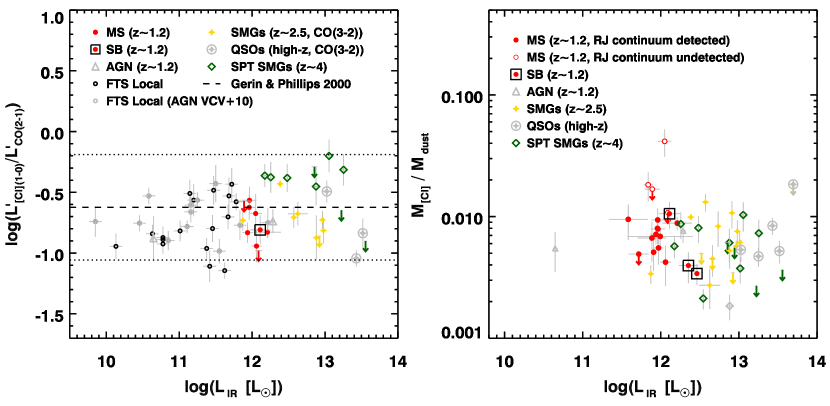
Figure 4 shows the / ratio as a function of the total . The observed ratio is similar in MS and SB galaxies at , local LIRGs, and high-redshift SMGs, within a fairly large scatter. We estimate a mean value of / with an observed scatter of dex for -detected galaxies, largely dominated by the intrinsic dispersion of dex. The inclusion of upper limits with a survival analysis provides consistent values (the mean from the Kaplan & Meier (1958) estimator is /, with a standard deviation of 0.24 dex). The / ratio does not appear to vary with . For the W11 sample we converted CO to CO applying a (Bothwell et al., 2013). Adopting ratios close to the original W11 paper ( for fully thermalized gas) would result in ratios % larger, bringing them closer to the values from B17. For the FTS sample we used the observed CO luminosities when available ( galaxies), and converted CO to CO fixing for more sources. These ratios are consistent with the observations in local spirals, mergers, and low-metallicity galaxies and their large scatter reported in Gerin & Phillips (2000), once corrected for the small excitation bias between CO and CO (/ dex, with extreme values of / and ). Therefore, [C I] and low- CO transitions appear to be correlated on kpc-scales regardless of galaxy type, total , and redshift, although with substantial scatter due to object by object variations, given the small measurement errors on fluxes.
4.3 Neutral atomic carbon masses
Following Weiß et al. (2005), the mass of atomic carbon is derived straightforwardly from as:
| (2) |
where is the partition function of [C I] and the excitation temperature. We cannot derive from the / ratio, since [C I] is unavailable for our sample of MS galaxies at . Therefore, we assume a fixed [C I] excitation temperature K for all galaxies. W11 reports a K for their overall sample of SMGs and QSOs and we derive K for part of the FTS local sample with both [C I] and [C I]. A typical value of K has also been previously adopted by AZ13 and B17. Assuming the dust temperature that we estimate from the far-infrared SED modeling as a first guess for the [C I] , we find similar results ( K for the MS calibration sample, and K for the SBs). Note that the total neutral carbon mass is insensitive to above K (Weiß et al., 2005), so the exact choice of this parameter is not critical above this threshold, which is unlikely in the samples studied here. We report the total masses in Table 2.
4.4 Gas masses from dust and CO
We estimated the total gas masses (including a
contribution from helium) for our sample of MS galaxies using both
dust masses from SED modeling and CO or CO as gas tracers, when
available. In both cases we adopted a
metallicity-dependent conversion
factor as described in Magdis et al. (2012b)111Magdis et al. (2012b)
reported an intercept of 12.8 in their parametrization
of (Eq. 8), not matching their Figure 5 (right). The
correct value adopted here is 12.6. The parametrization of
is
identical to Magdis et al.. Note that this approach includes the
atomic hydrogen H I in the gas mass estimate, a significant
contributor to the total gas mass only at low redshift.
We derived metallicities
converting stellar masses and SFR with the Fundamental
Metallicity Relation (Mannucci et al., 2010).
The derived metallicities are generally consistent with the solar
value (, Asplund et al. 2009).
We estimate an average gas-to-dust conversion factor of
and /K km s-1 pc2. We assumed a
/ ratio of
to convert CO into total gas masses when necessary (Magdis et al., 2012b; Bothwell et al., 2013).
We further derived total gas masses for our SBs at , LIRGs and high-redshift
SMGs fixing the conversion factors to /(K km s-1 pc2), and . The final error budget includes the uncertainties
on the observed CO fluxes and dust mass from SED modeling (Section
2.2). We further include a dex statistical
error on and , mimicking
the uncertainty on the metallicity-dependent parametrization in
Magdis et al. (2012b). Possible larger systematic uncertainties affecting
the gas masses are not listed in the error budget (e.g.,
Kamenetzky et al. 2017 for a study of the local LIRGs).
Figure 4 shows that the / ratios of SMGs appear similar to the values for our MS and SB galaxies at , albeit with substantial scatter. We estimate a mean ratio of /, with an observed scatter of dex dominated by an intrinsic dispersion of dex for 33 -detected galaxies. The inclusion of upper limits with a survival analysis provides a consistent result (/, dex). Note that we excluded active galaxies, QSOs, and galaxies without a detection of the dust continuum from this calculation. Moreover, the SMGs from B17 at appear to have fainter CO emission than the sample from W11 at at fixed dust mass, assuming the SLED ratios from Bothwell et al. (2013) (Section 4.2). This is likely the result of a combination of different factors, including the gas excitation properties of individual SMGs; a redshift effect due to the evolution of the strength of the radiation field ; the different selection techniques; and the heterogeneity of the SMG population (Carilli & Walter, 2013).
4.5 The abundance of neutral atomic carbon in galaxies
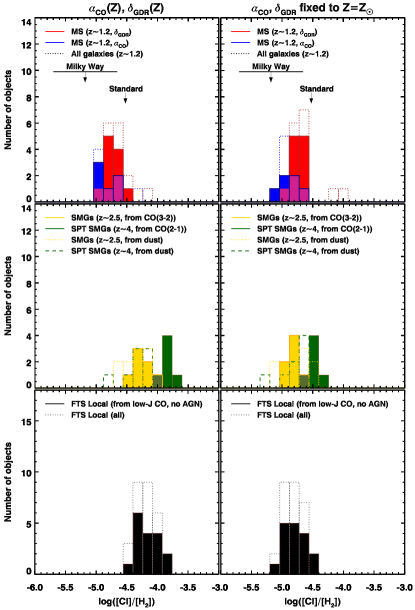
While not requiring a standard or factor as optically thick 12CO transitions, [C I] line luminosities can be converted into total gas masses only with prior knowledge of the abundance of carbon in the neutral atomic phase [C I]/[H2]. Such a conversion is necessary for any species other than H2, the dominant form of molecular gas. We derived the atomic carbon abundances as , using the estimates from dust and CO. Notice that does not include the helium contribution. Previous works adopted this or alternative approaches, providing atomic carbon abundance estimates in a variety of environments at different redshifts (e.g., Stutzki et al., 1997; Ikeda et al., 2002; Weiß et al., 2003, 2005; Israel et al., 2015, W11, AZ13 and B17 among the others). Here we redetermined the abundances based on a homogeneous set of assumptions, so to directly compare datasets in a consistent way. The discrepancies among our estimates and the ones in the original papers arise mainly from the choice of galaxies representative of the various populations (e.g., we exclude QSOs from the calculations), and different assumption (gas conversion factors, CO excitation ladder, inclusion or not of upper limits, dust- or CO-based gas masses, etc). First, we show the distribution of the estimated abundances for the MS sample at in Figure 5. The mean values are and adopting and , respectively. The uncertainties represent the standard deviation of the observed distributions for MS galaxies with detected continuum emission in the Rayleigh-Jeans tail and [C I] coverage ( detections and upper limit) when using , and for objects with [C I] coverage ( detections and upper limits) and CO detections in the case of . We excluded 1 MS source with continuum detection due to unsuccessful far-infrared photometric deblending. We included the upper limits on [C I] using a survival analysis, but their effect is negligible. The [C I]/[H2] in MS galaxies at is consistent with the observed values in highly obscured clouds of the Milky Way ( depending on the dust attenuation, Frerking et al. 1989, Figure 5), and it is lower than the typically assumed abundance of (Weiß et al., 2003). For reference, we also show the distributions including SBs and the AGN-dominated objects. We remark that the abundances presented in this work are global, galaxy-integrated estimates, while local measurements often focus to individual clouds. A direct comparison should be drawn with caution, as it would be natural to find lower abundances on global scales, if [C I] and are not fully cospatial. We similarly rederived the atomic carbon abundances for the literature sample, using both and when available. For the local sample of sources without AGN signatures and CO detections we find ; for the SPT-SMGs at from B17, and using CO and dust, respectively; for SMGs at from W11 and AZ13, and using CO and dust, respectively. The uncertainties represent the dispersion of the distributions in Figure 5 and include upper limits with a survival analysis. Note that faithfully represents the abundance of atomic carbon relative to the molecular hydrogen , a good approximation for the total gas mass at high redshift. However, both and formally include H I, which might be the dominant phase in local systems. Removing H I and considering the molecular gas phase only would further increase the [C I]/[H2] values reported here above for the local galaxies.
5 The calibration of [C I] as a gas tracer in galaxies
5.1 The limitations of a fully empirical approach
So far we have proven that it is feasible to detect [C I] lines not
only in distant, extreme, and often lensed systems, such as
SMGs and QSOs, but also in normal MS galaxies at moderately
high redshifts. We showed the existence of a – correlation similar to the standard – relation,
with / ratios systematically decreasing with increasing and distance from
the main sequence. The strong correlation between and makes the
latter a useful tool to predict [C I] emission in distant galaxies.
Moreover, the roughly constant / and / ratios on kpc-scales, regardless of total , galaxy type,
and redshift, reinforce the
connection between [C I], CO, and dust, supporting the use of
[C I] as a molecular gas tracer.
Constant / and / ratios directly translate into systematically lower neutral atomic carbon abundances in MS galaxies than in SBs/SMGs, owing to the canonical empirical and gas-to-dust conversion factors ( /(K km s-1 pc2) and for MS and SB galaxies, respectively). Assuming identical conversion factors, the abundances are similar in MS galaxies and SBs/SMGs (we show the case of constant in Figure 5). In other words, the well-known uncertainties of the standard CO and dust tracers affect the empirical calibration of [C I]. This practically limits the use of this potentially superior tracer of gas in galaxies, in absence of a calibration fully independent of the current assumptions. Moreover, these results suggest that the use of a universal abundance at low and high redshift, and regardless of the galaxy population, can strongly bias the gas masses derived from [C I] (([C I]) scales as ([C I]/[H2])-1), as in the case of the widespread [C I]/[H2] value adopted in literature, following an estimate by Weiß et al. (2003) in a high-redshift QSO and the average abundance reported by Papadopoulos & Greve (2004). The ascertained redshift evolution of metallicity in galaxies and the complex and history of carbon production (e.g., Chiappini et al., 2003) argue against the use of universal abundance values, even if an early and quick enrichment might mitigate this issue in the cosmic ages explored so far.
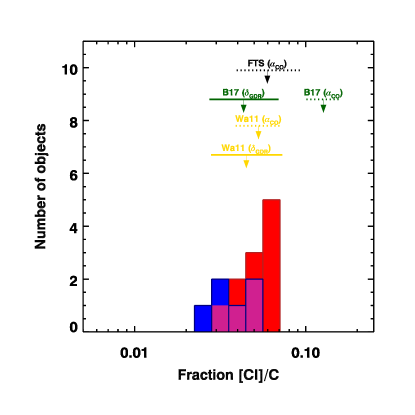
5.2 The small fraction of atomic carbon in galaxies
A precise calibration of [C I] as a total gas tracer could be intrinsically difficult, since it requires the tracking of the small fraction of carbon produced in galaxies in the atomic gas phase. Neglecting the carbon locked into stars, the gas mass fraction of the neutral atomic carbon phase can be derived from the definition of the mass fraction of metals:
| (3) |
where is the total mass of carbon, the mass in the neutral atomic phase, the total mass
of metals, and is the hydrogen gas mass, excluding helium.
From Eq. 3, we derive or . Assuming a solar metallicity and composition
( and , Asplund et al. 2009), the mass fraction of carbon in the atomic
gas phase in the MS galaxies is % and
% using and , respectively
(Figure 6). These estimates and their
uncertainties include upper limits through survival analysis and
they represent the mean and standard deviation of the logarithmic distributions in
Figure 6. Note that these values depend on the
choice of metallicity and carbon fraction adopted here.
Using the metallicity from the Fundamental Metallicity Relation does not
impact this result (Section 4.4). We derive similar
% for LIRGs; % and
% for SMGs at from W11/AZ13 using dust
and CO respectively; % and
% for SPT-SMGs from B17 adopting the dust- and
CO-based calibration and including upper limits. We used dust and CO
to derive , and assuming a metallicity of
corresponding to /(K km s-1 pc2) and . Supersolar metallicities are necessary
to obtain these commonly adopted values when using the parametrization
by Magdis et al. (2012b, their Eq. 8 with the corrected intercept discussed above and Section 4.2).
However, while this likely has strong physical roots for the optically thin dust emission,
values of /(K km s-1 pc2) could be found also at , being
the CO emission optically thick and, thus, critically dependent on
other parameters (i.e., the FWHM of the line).
The atomic carbon fractions in Figure 6 reflect the similar / and / ratios for MS and SBs/SMGs in Figure 4, analogously to the [C I] abundances shown in Figure 5. From a theoretical perspective, even simple plan-parallel PDR models could partially explain the observed constant [C I]/CO ratio by the relative insensitivity of the [C I] emission to the strength of UV radiation. In fact, while a stronger radiation field pushes the C-to-CO transition deeper into the gas slab, the size of the [C I]- and CO -emitting regions stays relatively constant (e.g., Kaufman et al., 1999, and many others). Our estimates suggest that [C I] represents a very minor fraction of the overall mass of carbon in galaxies, as the majority is in CO molecules ([C I]CO, Ikeda et al. 2002) and depleted on dust (% of the overall carbon abundance, e.g., van Dishoeck & Black 1988), neglecting the quantity locked in stars. The small mass fraction of atomic carbon and the associated low column densities explain the small optical depth of the [C I] line, a major advantage in the use of this species to trace the gas content of galaxies (Papadopoulos et al., 2004). However, an accurate assessment of such minimal [C I] fractions and the detection of relative variations in different galaxy populations – if present – are complicated by both observational and theoretical uncertainties (e.g., the history of chemical enrichment in galaxies, affecting any tracers of the molecular gas mass other than H2).
5.3 Possible hidden systematic variations of [C I]/[H2]
We showed that MS and SB/SMGs have similar / and / ratios (Figure 4), resulting in different [C I]/[H2] owing to standard assumptions on the dust/CO-to-gas conversion factors. However, reversing the argument, intrinsic large variations of [C I]/[H2] might not directly translate into large differences in the observed ratios, due to the counter-effect of higher and for MS galaxies than for SBs. Analogously, intrinsic systematic differences of [C I]/[H2] between SB and MS would blur large variations of SFE into similar / ratios, equivalently to what is observed for CO (Daddi et al., 2010b). The opposite dependence of [C I]/[H2] and on metallicity could explain the small variations of / observed in our data compilation: metal rich SB galaxies tend to have larger [C I]/[H2] abundances than MS objects, compensating lower gas-to-dust ratios . On the other hand, parameters other than metallicity should play a major role in the comparison of optically thick (CO) and thin ([C I], dust) tracers (e.g., turbulent velocities and compression resulting in broad CO lines, Bournaud et al., 2015). On top of these effects, enhanced cosmic ray rates in sources with large SFEs (e.g., Papadopoulos et al., 2004; Bisbas et al., 2015, 2017) could increase [C I]/[H2], further reducing strong variations of the observed / and / ratios. The degeneracies listed here would be broken by an estimate of the gas mass independent of the assumptions we have to make for the currently available data.
6 Conclusions
We presented the first results of a survey targeting the [C I] transition in main-sequence galaxies at , expanding the
samples of starbursts and SMGs
currently present in literature towards
a population of normal galaxies.
We showed the existence of a
sublinear correlation between the total log() and
log(), with a decreasing / ratio with
increasing . The slope of this relation and the
significant displacement of the [C I]-detected MS galaxies from the
sequence traced by SBs/SMGs are similar to what is observed for
CO . The difference will be easily tested by populating the
distance from the main-sequence – / plane. Based on
current evidence, starbursts may have lower values of this ratio than
do main-sequence galaxies.
These observations strengthen the [C I] – CO relation on global
galaxy scales and suggest that / is an effective tracer
of the depletion timescales in galaxies, decreasing with increasing
and shorter in SBs/SMGs than in MS galaxies.
We further showed
that the / and / ratios in local
LIRGs, MS galaxies and SBs at , and lensed SMGs
at are similar, with an intrinsic scatter of dex.
These ratios are proportional to a mass fraction of carbon
in the neutral atomic phase of %, roughly independent of the galaxy type and redshift, although
affected by substantial scatter. The relative
insensitivity of [C I] emission to the strength of the radiation field
could partially explain the constant [C I]/CO ratios, as the
size of the [C I]- and CO-emitting regions stays relatively constant in
different environments.
We then estimated the atomic carbon abundances – necessary to derive the total gas mass from
[C I] observations – by comparing [C I], dust, and CO low- emissions.
Adopting standard and gas-to-dust
conversion factors, we find [C I]/[H2] for
MS galaxies at . These values are lower than the abundance in
high-redshift SMGs, and lower than in local
LIRGs. At this stage, this difference is mainly a consequence of the choice
of and , and it currently exacerbates possible
minimal differences in the observables, if present. However, systematically
higher [C I]/[H2] in SB than in MS galaxies, possibly driven by larger
metallicities and/or cosmic rays rates, might result in similar
observables, a degeneracy that cannot be
broken with the available data and tools.
All things considered, our findings caution against the use of a universal
atomic carbon abundance regardless of the galaxy type and redshift.
Acknowledgements
We acknowledge the constructive comments from the anonymous referee, which significantly improved the content and presentation of the results. We thank Mark Sargent for providing the initial catalogs and discussions during the early stages of this work. FV and GEM acknowledge the Villum Fonden research grant 13160 “Gas to stars, stars to dust: tracing star formation across cosmic time” and the Cosmic Dawn Center of Excellence funded by the Danish National Research Foundation. YG acknowledges partial support of China grant no. 2017YFA0402704, NSFC grant no. 11420101002. This paper makes use of the following ALMA data: ADS/JAO.ALMA#2016.1.01040.S, #2015.1.00260.S, #2016.1.00171.S. ALMA is a partnership of ESO (representing its member states), NSF (USA) and NINS (Japan), together with NRC (Canada), MOST and ASIAA (Taiwan), and KASI (Republic of Korea), in cooperation with the Republic of Chile. The Joint ALMA Observatory is operated by ESO, AUI/NRAO and NAOJ. In this work we made use of the COSMOS master spectroscopic catalog, available within the collaboration and kept updated by Mara Salvato.
References
- Alaghband-Zadeh et al. (2012) Alaghband-Zadeh, S., Chapman, S. C., Swinbank, A. M., et al. 2012, MNRAS, 424, 2232, doi: 10.1111/j.1365-2966.2012.21386.x
- Alaghband-Zadeh et al. (2013) —. 2013, MNRAS, 435, 1493, doi: 10.1093/mnras/stt1390
- Aravena et al. (2016) Aravena, M., Spilker, J. S., Bethermin, M., et al. 2016, MNRAS, 457, 4406, doi: 10.1093/mnras/stw275
- Aretxaga et al. (2011) Aretxaga, I., Wilson, G. W., Aguilar, E., et al. 2011, MNRAS, 415, 3831, doi: 10.1111/j.1365-2966.2011.18989.x
- Armus et al. (2009) Armus, L., Mazzarella, J. M., Evans, A. S., et al. 2009, PASP, 121, 559, doi: 10.1086/600092
- Arnouts et al. (2007) Arnouts, S., Walcher, C. J., Le Fèvre, O., et al. 2007, A&A, 476, 137, doi: 10.1051/0004-6361:20077632
- Asplund et al. (2009) Asplund, M., Grevesse, N., Sauval, A. J., & Scott, P. 2009, ARA&A, 47, 481, doi: 10.1146/annurev.astro.46.060407.145222
- Bertoldi et al. (2007) Bertoldi, F., Carilli, C., Aravena, M., et al. 2007, ApJS, 172, 132, doi: 10.1086/520511
- Bisbas et al. (2015) Bisbas, T. G., Papadopoulos, P. P., & Viti, S. 2015, ApJ, 803, 37, doi: 10.1088/0004-637X/803/1/37
- Bisbas et al. (2017) Bisbas, T. G., van Dishoeck, E. F., Papadopoulos, P. P., et al. 2017, ApJ, 839, 90, doi: 10.3847/1538-4357/aa696d
- Bolatto et al. (2013) Bolatto, A. D., Wolfire, M., & Leroy, A. K. 2013, ARA&A, 51, 207, doi: 10.1146/annurev-astro-082812-140944
- Bothwell et al. (2013) Bothwell, M. S., Smail, I., Chapman, S. C., et al. 2013, MNRAS, 429, 3047, doi: 10.1093/mnras/sts562
- Bothwell et al. (2017) Bothwell, M. S., Aguirre, J. E., Aravena, M., et al. 2017, MNRAS, 466, 2825, doi: 10.1093/mnras/stw3270
- Bournaud et al. (2015) Bournaud, F., Daddi, E., Weiß, A., et al. 2015, A&A, 575, A56, doi: 10.1051/0004-6361/201425078
- Bruzual & Charlot (2003) Bruzual, G., & Charlot, S. 2003, MNRAS, 344, 1000, doi: 10.1046/j.1365-8711.2003.06897.x
- Carilli et al. (1999) Carilli, C. L., Menten, K. M., & Yun, M. S. 1999, ApJ, 521, L25, doi: 10.1086/312179
- Carilli & Walter (2013) Carilli, C. L., & Walter, F. 2013, ARA&A, 51, 105, doi: 10.1146/annurev-astro-082812-140953
- Casey et al. (2014) Casey, C. M., Narayanan, D., & Cooray, A. 2014, Phys. Rep., 541, 45, doi: 10.1016/j.physrep.2014.02.009
- Casey et al. (2012) Casey, C. M., Berta, S., Béthermin, M., et al. 2012, ApJ, 761, 140, doi: 10.1088/0004-637X/761/2/140
- Catalano et al. (2014) Catalano, A., Calvo, M., Ponthieu, N., et al. 2014, A&A, 569, A9, doi: 10.1051/0004-6361/201423557
- Chabrier (2003) Chabrier, G. 2003, PASP, 115, 763, doi: 10.1086/376392
- Chiappini et al. (2003) Chiappini, C., Romano, D., & Matteucci, F. 2003, MNRAS, 339, 63, doi: 10.1046/j.1365-8711.2003.06154.x
- Cortzen et al. (2018) Cortzen, I., Garrett, J., Magdis, G., et al. 2018, ArXiv e-prints. https://arxiv.org/abs/1810.05178
- Cox et al. (2011) Cox, P., Krips, M., Neri, R., et al. 2011, ApJ, 740, 63, doi: 10.1088/0004-637X/740/2/63
- Daddi et al. (2007) Daddi, E., Dickinson, M., Morrison, G., et al. 2007, ApJ, 670, 156, doi: 10.1086/521818
- Daddi et al. (2010a) Daddi, E., Bournaud, F., Walter, F., et al. 2010a, ApJ, 713, 686, doi: 10.1088/0004-637X/713/1/686
- Daddi et al. (2010b) Daddi, E., Elbaz, D., Walter, F., et al. 2010b, ApJ, 714, L118, doi: 10.1088/2041-8205/714/1/L118
- Daddi et al. (2015) Daddi, E., Dannerbauer, H., Liu, D., et al. 2015, A&A, 577, A46, doi: 10.1051/0004-6361/201425043
- Draine & Li (2007) Draine, B. T., & Li, A. 2007, ApJ, 657, 810, doi: 10.1086/511055
- Efstathiou & Siebenmorgen (2009) Efstathiou, A., & Siebenmorgen, R. 2009, A&A, 502, 541, doi: 10.1051/0004-6361/200811205
- Elbaz et al. (2007) Elbaz, D., Daddi, E., Le Borgne, D., et al. 2007, A&A, 468, 33, doi: 10.1051/0004-6361:20077525
- Frerking et al. (1989) Frerking, M. A., Keene, J., Blake, G. A., & Phillips, T. G. 1989, ApJ, 344, 311, doi: 10.1086/167799
- Geach et al. (2017) Geach, J. E., Dunlop, J. S., Halpern, M., et al. 2017, MNRAS, 465, 1789, doi: 10.1093/mnras/stw2721
- Genzel et al. (2010) Genzel, R., Tacconi, L. J., Gracia-Carpio, J., et al. 2010, MNRAS, 407, 2091, doi: 10.1111/j.1365-2966.2010.16969.x
- Genzel et al. (2015) Genzel, R., Tacconi, L. J., Lutz, D., et al. 2015, ApJ, 800, 20, doi: 10.1088/0004-637X/800/1/20
- Gerin & Phillips (2000) Gerin, M., & Phillips, T. G. 2000, ApJ, 537, 644, doi: 10.1086/309072
- Glover et al. (2015) Glover, S. C. O., Clark, P. C., Micic, M., & Molina, F. 2015, MNRAS, 448, 1607, doi: 10.1093/mnras/stu2699
- Guilloteau & Lucas (2000) Guilloteau, S., & Lucas, R. 2000, in Astronomical Society of the Pacific Conference Series, Vol. 217, Imaging at Radio through Submillimeter Wavelengths, ed. J. G. Mangum & S. J. E. Radford, 299
- Guilloteau et al. (1997) Guilloteau, S., Omont, A., McMahon, R. G., Cox, P., & Petitjean, P. 1997, A&A, 328, L1
- Gullberg et al. (2016) Gullberg, B., Lehnert, M. D., De Breuck, C., et al. 2016, A&A, 591, A73, doi: 10.1051/0004-6361/201527647
- Ikeda et al. (2002) Ikeda, M., Oka, T., Tatematsu, K., Sekimoto, Y., & Yamamoto, S. 2002, ApJS, 139, 467, doi: 10.1086/338761
- Israel et al. (2015) Israel, F. P., Rosenberg, M. J. F., & van der Werf, P. 2015, A&A, 578, A95, doi: 10.1051/0004-6361/201425175
- Ivison et al. (2011) Ivison, R. J., Papadopoulos, P. P., Smail, I., et al. 2011, MNRAS, 412, 1913, doi: 10.1111/j.1365-2966.2010.18028.x
- Ivison et al. (2007) Ivison, R. J., Greve, T. R., Dunlop, J. S., et al. 2007, MNRAS, 380, 199, doi: 10.1111/j.1365-2966.2007.12044.x
- Ivison et al. (2010) Ivison, R. J., Swinbank, A. M., Swinyard, B., et al. 2010, A&A, 518, L35, doi: 10.1051/0004-6361/201014548
- Jiao et al. (2017) Jiao, Q., Zhao, Y., Zhu, M., et al. 2017, ApJ, 840, L18, doi: 10.3847/2041-8213/aa6f0f
- Jin et al. (2018) Jin, S., Daddi, E., Liu, D., et al. 2018, ApJ, 864, 56, doi: 10.3847/1538-4357/aad4af
- Juneau et al. (2011) Juneau, S., Dickinson, M., Alexander, D. M., & Salim, S. 2011, ApJ, 736, 104, doi: 10.1088/0004-637X/736/2/104
- Kamenetzky et al. (2017) Kamenetzky, J., Rangwala, N., & Glenn, J. 2017, MNRAS, 471, 2917, doi: 10.1093/mnras/stx1595
- Kamenetzky et al. (2016) Kamenetzky, J., Rangwala, N., Glenn, J., Maloney, P. R., & Conley, A. 2016, ApJ, 829, 93, doi: 10.3847/0004-637X/829/2/93
- Kaplan & Meier (1958) Kaplan, E. L., & Meier, P. 1958, J. Am. Stat. Assoc., 53, 282, doi: 10.2307/2281868
- Kaufman et al. (1999) Kaufman, M. J., Wolfire, M. G., Hollenbach, D. J., & Luhman, M. L. 1999, ApJ, 527, 795, doi: 10.1086/308102
- Keene et al. (1996) Keene, J., Lis, D. C., Phillips, T. G., & Schilke, P. 1996, in IAU Symposium, Vol. 178, Molecules in Astrophysics: Probes & Processes, ed. E. F. van Dishoeck, 129
- Kelly (2007) Kelly, B. C. 2007, ApJ, 665, 1489, doi: 10.1086/519947
- Kennicutt (1998a) Kennicutt, Jr., R. C. 1998a, ARA&A, 36, 189, doi: 10.1146/annurev.astro.36.1.189
- Kennicutt (1998b) —. 1998b, ApJ, 498, 541
- Kirkpatrick et al. (2012) Kirkpatrick, A., Pope, A., Alexander, D. M., et al. 2012, ApJ, 759, 139, doi: 10.1088/0004-637X/759/2/139
- Kovács et al. (2006) Kovács, A., Chapman, S. C., Dowell, C. D., et al. 2006, ApJ, 650, 592, doi: 10.1086/506341
- Kroupa (2001) Kroupa, P. 2001, MNRAS, 322, 231, doi: 10.1046/j.1365-8711.2001.04022.x
- Laigle et al. (2016) Laigle, C., McCracken, H. J., Ilbert, O., et al. 2016, ApJS, 224, 24, doi: 10.3847/0067-0049/224/2/24
- Lestrade et al. (2010) Lestrade, J.-F., Combes, F., Salomé, P., et al. 2010, A&A, 522, L4, doi: 10.1051/0004-6361/201015673
- Liu et al. (2015) Liu, D., Gao, Y., Isaak, K., et al. 2015, ApJ, 810, L14, doi: 10.1088/2041-8205/810/2/L14
- Liu et al. (2018) Liu, D., Daddi, E., Dickinson, M., et al. 2018, ApJ, 853, 172, doi: 10.3847/1538-4357/aaa600
- Lu et al. (2017) Lu, N., Zhao, Y., Díaz-Santos, T., et al. 2017, ApJS, 230, 1, doi: 10.3847/1538-4365/aa6476
- Lutz et al. (2011) Lutz, D., Poglitsch, A., Altieri, B., et al. 2011, A&A, 532, A90, doi: 10.1051/0004-6361/201117107
- Ma et al. (2015) Ma, J., Gonzalez, A. H., Spilker, J. S., et al. 2015, ApJ, 812, 88, doi: 10.1088/0004-637X/812/1/88
- Magdis et al. (2010) Magdis, G. E., Elbaz, D., Hwang, H. S., et al. 2010, MNRAS, 409, 22, doi: 10.1111/j.1365-2966.2010.17551.x
- Magdis et al. (2012a) Magdis, G. E., Daddi, E., Béthermin, M., et al. 2012a, ApJ, 760, 6, doi: 10.1088/0004-637X/760/1/6
- Magdis et al. (2012b) —. 2012b, ApJ, 760, 6, doi: 10.1088/0004-637X/760/1/6
- Magdis et al. (2017) Magdis, G. E., Rigopoulou, D., Daddi, E., et al. 2017, A&A, 603, A93, doi: 10.1051/0004-6361/201731037
- Magnelli et al. (2012) Magnelli, B., Lutz, D., Santini, P., et al. 2012, A&A, 539, A155, doi: 10.1051/0004-6361/201118312
- Mannucci et al. (2010) Mannucci, F., Cresci, G., Maiolino, R., Marconi, A., & Gnerucci, A. 2010, MNRAS, 408, 2115, doi: 10.1111/j.1365-2966.2010.17291.x
- Maraston (2005) Maraston, C. 2005, MNRAS, 362, 799, doi: 10.1111/j.1365-2966.2005.09270.x
- Markwardt (2009) Markwardt, C. B. 2009, in Astronomical Society of the Pacific Conference Series, Vol. 411, Astronomical Data Analysis Software and Systems XVIII, ed. D. A. Bohlender, D. Durand, & P. Dowler, 251
- McKean et al. (2011) McKean, J. P., Berciano Alba, A., Volino, F., et al. 2011, MNRAS, 414, L11, doi: 10.1111/j.1745-3933.2011.01043.x
- McMullin et al. (2007) McMullin, J. P., Waters, B., Schiebel, D., Young, W., & Golap, K. 2007, in Astronomical Society of the Pacific Conference Series, Vol. 376, Astronomical Data Analysis Software and Systems XVI, ed. R. A. Shaw, F. Hill, & D. J. Bell, 127
- Menéndez-Delmestre et al. (2009) Menéndez-Delmestre, K., Blain, A. W., Smail, I., et al. 2009, ApJ, 699, 667, doi: 10.1088/0004-637X/699/1/667
- Mullaney et al. (2011) Mullaney, J. R., Alexander, D. M., Goulding, A. D., & Hickox, R. C. 2011, MNRAS, 414, 1082, doi: 10.1111/j.1365-2966.2011.18448.x
- Muzzin et al. (2013) Muzzin, A., Wilson, G., Demarco, R., et al. 2013, ApJ, 767, 39, doi: 10.1088/0004-637X/767/1/39
- Noeske et al. (2007) Noeske, K. G., Weiner, B. J., Faber, S. M., et al. 2007, ApJ, 660, L43, doi: 10.1086/517926
- Ojha et al. (2001) Ojha, R., Stark, A. A., Hsieh, H. H., et al. 2001, ApJ, 548, 253, doi: 10.1086/318693
- Oliver et al. (2012) Oliver, S. J., Bock, J., Altieri, B., et al. 2012, MNRAS, 424, 1614, doi: 10.1111/j.1365-2966.2012.20912.x
- Ott (2010) Ott, S. 2010, in Astronomical Society of the Pacific Conference Series, Vol. 434, Astronomical Data Analysis Software and Systems XIX, ed. Y. Mizumoto, K.-I. Morita, & M. Ohishi, 139
- Papadopoulos & Greve (2004) Papadopoulos, P. P., & Greve, T. R. 2004, ApJ, 615, L29, doi: 10.1086/426059
- Papadopoulos et al. (2004) Papadopoulos, P. P., Thi, W.-F., & Viti, S. 2004, MNRAS, 351, 147, doi: 10.1111/j.1365-2966.2004.07762.x
- Popping et al. (2017) Popping, G., Decarli, R., Man, A. W. S., et al. 2017, A&A, 602, A11, doi: 10.1051/0004-6361/201730391
- Sanders et al. (2003) Sanders, D. B., Mazzarella, J. M., Kim, D.-C., Surace, J. A., & Soifer, B. T. 2003, AJ, 126, 1607, doi: 10.1086/376841
- Sanders et al. (2007) Sanders, D. B., Salvato, M., Aussel, H., et al. 2007, ApJS, 172, 86, doi: 10.1086/517885
- Sargent et al. (2014) Sargent, M. T., Daddi, E., Béthermin, M., et al. 2014, ApJ, 793, 19, doi: 10.1088/0004-637X/793/1/19
- Schmidt (1959) Schmidt, M. 1959, ApJ, 129, 243
- Scoville et al. (2007) Scoville, N., Aussel, H., Brusa, M., et al. 2007, ApJS, 172, 1, doi: 10.1086/516585
- Scoville et al. (2014) Scoville, N., Aussel, H., Sheth, K., et al. 2014, ApJ, 783, 84, doi: 10.1088/0004-637X/783/2/84
- Skrutskie et al. (2006) Skrutskie, M. F., Cutri, R. M., Stiening, R., et al. 2006, AJ, 131, 1163, doi: 10.1086/498708
- Solomon & Vanden Bout (2005) Solomon, P. M., & Vanden Bout, P. A. 2005, ARA&A, 43, 677, doi: 10.1146/annurev.astro.43.051804.102221
- Stacey et al. (2018) Stacey, H. R., McKean, J. P., Robertson, N. C., et al. 2018, MNRAS, 476, 5075, doi: 10.1093/mnras/sty458
- Stoerzer et al. (1997) Stoerzer, H., Stutzki, J., & Sternberg, A. 1997, A&A, 323, L13
- Stutzki et al. (1998) Stutzki, J., Bensch, F., Heithausen, A., Ossenkopf, V., & Zielinsky, M. 1998, A&A, 336, 697
- Stutzki et al. (1997) Stutzki, J., Graf, U. U., Haas, S., et al. 1997, ApJ, 477, L33, doi: 10.1086/310514
- Swinbank et al. (2010) Swinbank, A. M., Smail, I., Longmore, S., et al. 2010, Nature, 464, 733, doi: 10.1038/nature08880
- Tacconi et al. (2006) Tacconi, L. J., Neri, R., Chapman, S. C., et al. 2006, ApJ, 640, 228, doi: 10.1086/499933
- Tacconi et al. (2018) Tacconi, L. J., Genzel, R., Saintonge, A., et al. 2018, ApJ, 853, 179, doi: 10.3847/1538-4357/aaa4b4
- U et al. (2012) U, V., Sanders, D. B., Mazzarella, J. M., et al. 2012, ApJS, 203, 9, doi: 10.1088/0067-0049/203/1/9
- van Dishoeck & Black (1988) van Dishoeck, E. F., & Black, J. H. 1988, ApJ, 334, 771, doi: 10.1086/166877
- Véron-Cetty & Véron (2010) Véron-Cetty, M.-P., & Véron, P. 2010, A&A, 518, A10, doi: 10.1051/0004-6361/201014188
- Vieira et al. (2010) Vieira, J. D., Crawford, T. M., Switzer, E. R., et al. 2010, ApJ, 719, 763, doi: 10.1088/0004-637X/719/1/763
- Wagg et al. (2014) Wagg, J., Carilli, C. L., Aravena, M., et al. 2014, ApJ, 783, 71, doi: 10.1088/0004-637X/783/2/71
- Walter et al. (2011) Walter, F., Weiß, A., Downes, D., Decarli, R., & Henkel, C. 2011, ApJ, 730, 18, doi: 10.1088/0004-637X/730/1/18
- Weiß et al. (2005) Weiß, A., Downes, D., Henkel, C., & Walter, F. 2005, A&A, 429, L25, doi: 10.1051/0004-6361:200400085
- Weiß et al. (2003) Weiß, A., Henkel, C., Downes, D., & Walter, F. 2003, A&A, 409, L41, doi: 10.1051/0004-6361:20031337
- Weiß et al. (2013) Weiß, A., De Breuck, C., Marrone, D. P., et al. 2013, ApJ, 767, 88, doi: 10.1088/0004-637X/767/1/88
- Xie et al. (1995) Xie, T., Allen, M., & Langer, W. D. 1995, ApJ, 440, 674, doi: 10.1086/175305
- Zanella et al. (2018) Zanella, A., Daddi, E., Magdis, G., et al. 2018, MNRAS, 481, 1976, doi: 10.1093/mnras/sty2394
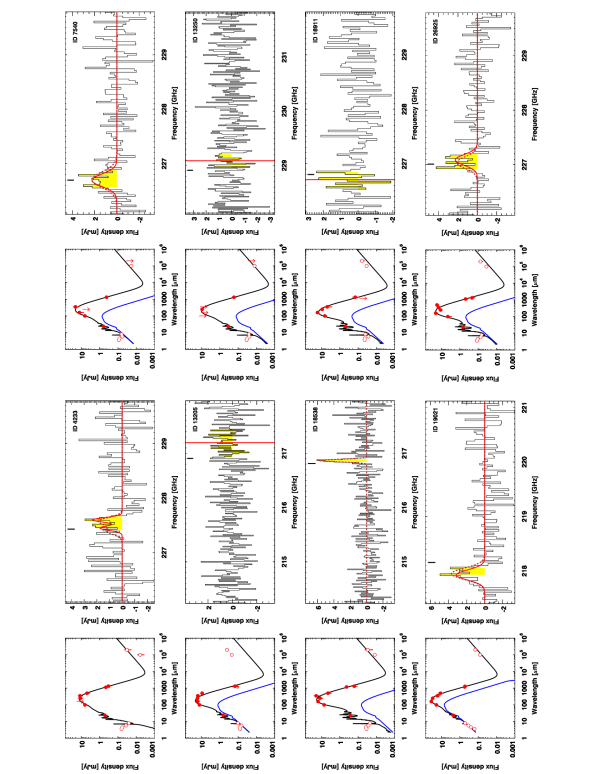
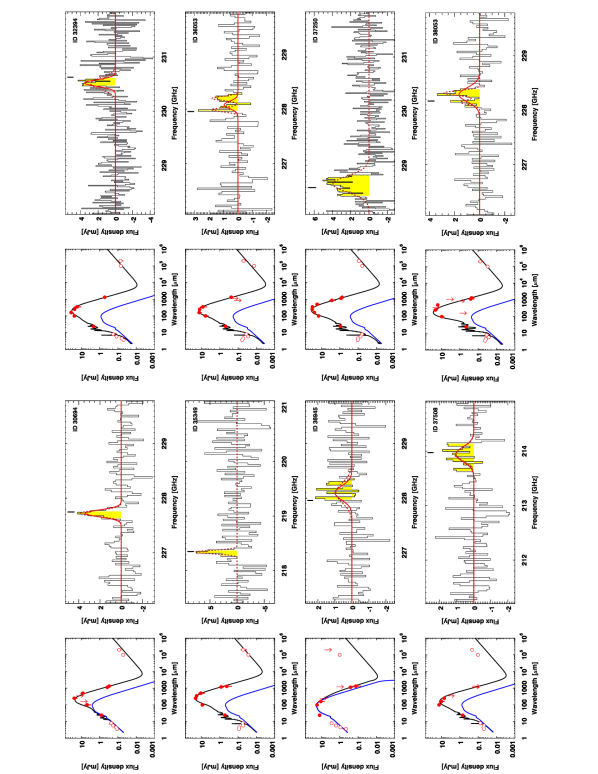
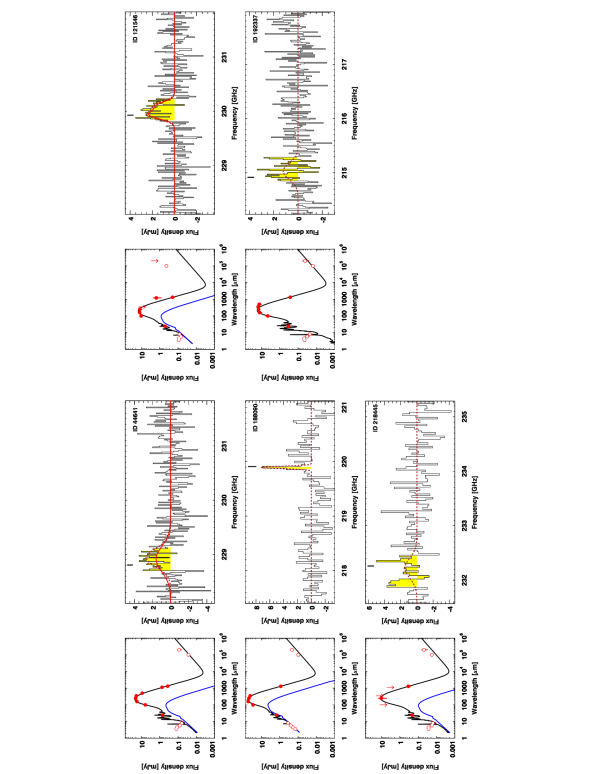
Appendix A Galaxy spectral energy distributions and spectra
We show in Figure A.1 the 1D spectra of our sample of galaxies at observed with ALMA Band 6. The black line show the spectrum; the yellow area marks the channels used to measure the line fluxes, matching brighter CO lines, if present (Section 2.3, Table 1); the solid red line the best fitting Gaussian obtained fixing the redshift and width of the [C I] line to match the brighter CO emissions and the continuum level to the estimate over the full 7.5 GHz band; the dashed dark red line shows the best [C I] line model with free parameters for the line and a local continuum emission estimate within GHz from the line center. When a line is not detected, we show in red the location of the expected [C I] emission based on detected CO lines. The black thick shows the expected position of the line based on the optical/near-infrared spectroscopic redshift. Figure A.1 further shows the near-infrared to radio photometry for our sample. The filled red circles mark the data points we considered for our modeling (black line). The empty red circles were not considered in the fit (Magdis et al., 2012b). Arrows mark upper limits. The solid blue line shows the best fit template for the dusty torus component.
| ID | RA | Decl | () | Type | ||||||||
|---|---|---|---|---|---|---|---|---|---|---|---|---|
| (deg) | (deg) | K km s-1 pc2 | K km s-1 pc2 | Jy km s-1 | Jy km s-1 | |||||||
| (1) | (2) | (3) | (4) | (5) | (6) | (7) | (8) | (9) | (10) | (11) | (12) | (13) |
| 4233 | 150.39732 | 2.24088 | aafootnotemark: | 10.89 | MS | |||||||
| 7540 | 150.41281 | 1.85157 | aafootnotemark: | 11.06 | 0.12 | MS | ||||||
| 13205 | 150.57484 | 1.94786 | bbfootnotemark: | 11.10 | 0.16 | MS | ||||||
| 13250 | 150.17650 | 1.95523 | aafootnotemark: | 10.41 | 0.04 | MS | ||||||
| 18538 | 150.12639 | 2.43285 | ccfootnotemark: | 10.56 | 0.01 | MS | ||||||
| 18911 | 150.04820 | 2.46767 | aafootnotemark: | 10.64 | 0.04 | MS | ||||||
| 19021 | 150.05878 | 2.47739 | ddfootnotemark: | 11.78 | 0.41 | AGN | ||||||
| 26925 | 150.46350 | 1.88331 | aafootnotemark: | 11.05 | 0.08 | MS | ||||||
| 30694 | 149.66026 | 2.41099 | aafootnotemark: | 10.78 | 0.32 | MS | ||||||
| 32394 | 150.06781 | 1.85108 | aafootnotemark: | 10.03 | 0.06 | SB | ||||||
| 35349 | 150.49902 | 1.72446 | ccfootnotemark: | 11.19 | 0.07 | MS | ||||||
| 36053 | 149.68564 | 1.91986 | aafootnotemark: | 10.87 | 0.04 | MS | ||||||
| 36945 | 150.19550 | 2.12404 | aafootnotemark: | 11.43 | 0.99 | AGN | ||||||
| 37250 | 149.61813 | 2.19346 | ccfootnotemark: | 10.96 | 0.03 | MS | ||||||
| 37508 | 150.38953 | 2.25585 | bbfootnotemark: | 11.04 | 0.12 | MS | ||||||
| 38053 | 150.55685 | 2.39140 | aafootnotemark: | 10.66 | 0.03 | SB | ||||||
| 44641 | 150.65852 | 2.31786 | aafootnotemark: | 11.10 | 0.07 | MS | ||||||
| 121546† | 150.05910 | 2.21995 | aafootnotemark: | 11.08 | 0.16 | MS | ||||||
| 188090 | 150.42799 | 2.55860 | ccfootnotemark: | 11.12 | 0.22 | SB | ||||||
| 192337 | 150.42073 | 2.62297 | ccfootnotemark: | 10.90 | MS | |||||||
| 218445 | 149.92007 | 2.61905 | ccfootnotemark: | 10.60 | 0.04 | MS |
Note. — 1 - ID; 2, 3 - RA, Decl J2000; 4 -
Spectroscopic redshift from sub-millimeter emission lines:
a: From CO ; b: CO ; c:
[C I]; d: CO ; 5 - Stellar mass from SED modeling
(Muzzin et al., 2013; Laigle et al., 2016). Uncertainty: 0.2 dex; 6 - Total
infrared luminosity integrated within m due to star
formation (i.e., corrected for torus emission); 7 - Far-infrared luminosity
integrated within m due to star
formation (i.e., corrected for torus emission); 8, 9 -
Galaxy-integrated and ; 10, 11 - Galaxy
velocity integrated [C I] and CO fluxes. These estimates
are obtained as weighted average flux densities within the
channels maximizing the SNR of the lines, times the velocity width covered by
these channels, and a 10% correction to total fluxes from the
comparison with the best Gaussian modeling with all free parameters;
12 - Fraction of infrared AGN emission: ;
13 - Galaxy type: MS = main-sequence; SB = Starburst
( above the main-sequence); AGN = SED dominated by
torus emission.
†: selected based on from Casey et al. (2012).
Upper limits are at .
| ID | [C I]/[H2](dust) | [C I]/[H2](CO) | ||||
|---|---|---|---|---|---|---|
| (1) | (2) | (3) | (4) | (5) | (6) | (7) |
| 4233 | ||||||
| 7540 | ||||||
| 13205 | ||||||
| 13250 | ||||||
| 18538 | ||||||
| 18911 | ||||||
| 19021 | ||||||
| 26925 | ||||||
| 30694 | ||||||
| 32394 | ||||||
| 35349 | ||||||
| 36053 | ||||||
| 36945 | ||||||
| 37250 | ||||||
| 37508 | ||||||
| 38053 | ||||||
| 44641 | ||||||
| 121546 | ||||||
| 188090 | ||||||
| 192337 | ||||||
| 218445 |
No continuum detection in the Rayleigh-Jeans tail of the dust emission. This value should be treated as an order of magnitude estimate.
${}^{\dagger}$${}^{\dagger}$footnotemark: Significant blending of the
photometry.
Note. — 1 - ID; 2 - Dust mass from SED modeling; 3 - Gas-to-dust conversion factor. Value fixed to for starbursts. Uncertainty: 0.2 dex; 4 - conversion factor. Value fixed to /(K km s-1 pc2) for starbursts. Uncertainty: 0.2 dex; 5 - Mass of [C I] (from assuming K); 6 - Atomic carbon abundance adopting (dust) and removing the contribution of helium; 7 - Atomic carbon abundance adopting (CO) and removing the contribution of helium.
Upper limits are . Systematic uncertainties on are not included in the error budget.
| ID | () | AGN | ||||||||||
|---|---|---|---|---|---|---|---|---|---|---|---|---|
| Mpc | K km s-1 pc2 | K km s-1 pc2 | K km s-1 pc2 | Jy km s-1 | Jy km s-1 | Jy km s-1 | ||||||
| (1) | (2) | (3) | (4) | (5) | (6) | (7) | (8) | (9) | (10) | (11) | (12) | (13) |
| Arp193 | 101.6 | 0.02330 | 10.5 | N | ||||||||
| Arp220 | 78.7 | 0.01813 | 10.7 | Y | ||||||||
| Arp299-A | 44.9 | 0.01041 | N | |||||||||
| Arp299-B | 44.9 | 0.01041 | N | |||||||||
| Arp299-C | 44.9 | 0.01041 | N | |||||||||
| CGCG049-057 | 56.2 | 0.01300 | 9.8 | N | ||||||||
| ESO173-G015 | 42.0 | 0.00974 | 10.4 | N | ||||||||
| IRASF18293-3413 | 78.9 | 0.01818 | 10.9 | N | ||||||||
| M82 | 3.4 | 0.00094 | 10.0 | N | ||||||||
| MCG+12-02-001 | 68.0 | 0.01570 | N | |||||||||
| Mrk331 | 80.3 | 0.01848 | 10.7 | N | ||||||||
| NGC0253 | 3.4 | 0.00081 | 10.4 | Y | ||||||||
| NGC1068 | 16.1 | 0.00379 | 11.0 | Y | ||||||||
| NGC1365-NE | 23.1 | 0.00546 | Y | |||||||||
| NGC1365-SW | 23.1 | 0.00546 | Y | |||||||||
| NGC3256 | 40.4 | 0.00935 | 10.8 | N | ||||||||
| NGC5135 | 59.3 | 0.01369 | 10.9 | Y | ||||||||
| NGC6240 | 106.8 | 0.02448 | 11.4 | Y | ||||||||
| NGC7469 | 70.8 | 0.01632 | 11.1 | Y | ||||||||
| NGC7552 | 22.8 | 0.00536 | 10.5 | N | ||||||||
| NGC7582 | 22.3 | 0.00525 | 10.6 | Y | ||||||||
| NGC7771 | 61.8 | 0.01427 | 11.2 | N | ||||||||
| VV340A | 147.9 | 0.03367 | 11.2 | N | ||||||||
| CenA | 7.7 | 0.00183 | 11.1 | Y | ||||||||
| IC1623 | 87.3 | 0.02007 | N | |||||||||
| NGC0034 | 85.3 | 0.01962 | 10.7 | Y | ||||||||
| NGC0891-North | 7.4 | 0.00176 | N | |||||||||
| NGC0891-South | 7.4 | 0.00176 | N | |||||||||
| NGC2146-NUC | 12.6 | 0.00298 | N | |||||||||
| NGC2146-NW | 12.6 | 0.00298 | N | |||||||||
| NGC2146-SE | 12.6 | 0.00298 | N | |||||||||
| NGC3227 | 16.3 | 0.00386 | 10.2 | Y |
Note. — 1 - ID; 2 - Distance; 3 - Redshift; 4 - Stellar mass from 2MASS -band photometry (Chabrier 2003 IMF, uncertainty dex); 5 - Total infrared luminosity integrated within m: ; 6 - 8: , , ; 9 - Galaxy integrated [C I] velocity integrated flux from FTS observations (Liu et al., 2015); 10, 11 - Galaxy integrated CO and CO fluxes from ground-based facilities. These values are signal-to-noise weighted means of all the available measurements in a fixed beam of 43.5” as in Table 3 of Kamenetzky et al. (2016), corrected by the beam factor in column (12); 12 - Beam correction for low- CO fluxes in columns (10, 11): ; 13 - Active galactic nuclei entry in Véron-Cetty & Véron (2010): Y(es)/N(o).
References: Cols 5, 9: Liu et al. (2015), this work; Cols 10, 11: Kamenetzky et al. (2016); Col 13: Véron-Cetty & Véron (2010).
| ID | (CO) | [C I]/[H2](CO) | |
|---|---|---|---|
| (1) | (2) | (3) | (4) |
| Arp193 | |||
| Arp220 | |||
| Arp299-A | |||
| Arp299-B | |||
| Arp299-C | |||
| CGCG049-057 | |||
| ESO173-G015 | |||
| IRASF18293-3413 | |||
| M82 | |||
| MCG+12-02-001 | |||
| Mrk331 | |||
| NGC0253 | |||
| NGC1068 | |||
| NGC1365-NE | |||
| NGC1365-SW | |||
| NGC3256 | |||
| NGC5135 | |||
| NGC6240 | |||
| NGC7469 | |||
| NGC7552 | |||
| NGC7582 | |||
| NGC7771 | |||
| VV340A | |||
| CenA | |||
| IC1623 | |||
| NGC0034 | |||
| NGC0891-North | |||
| NGC0891-South | |||
| NGC2146-NUC | |||
| NGC2146-NW | |||
| NGC2146-SE | |||
| NGC3227 |
Note. — 1 - ID; 2 - Mass of [C I] (from assuming K); 3 - Gas mass from CO , assuming /(K km s-1 pc2) (with an uncertainty of 0.2 dex); 4 - Atomic carbon abundance adopting (CO) and removing the contribution of helium.
| ID | QSOs | |||||||||||||
|---|---|---|---|---|---|---|---|---|---|---|---|---|---|---|
| (1) | (2) | (3) | (4) | (5) | (6) | (7) | (8) | (9) | (10) | (11) | (12) | (13) | (14) | (15) |
| SMMJ02399-0136 | 2.808 | 2.5 | 0.09 | N | ||||||||||
| APM08279+5255 | 3.911 | 80 | 0.99 | Y | ||||||||||
| RXJ0911+0551 | 2.796 | 20 | 0.98 | Y | ||||||||||
| F10214 | 2.285 | 10 | 0.74 | Y | ||||||||||
| SMMJ123549+6215 | 2.202 | 1 | N | |||||||||||
| BRI1335-0417 | 4.407 | 1 | 0.29 | Y | ||||||||||
| SMMJ14011+0252 | 2.565 | 4† | 0.05 | N | ||||||||||
| Cloverleaf | 2.558 | 11 | 0.98 | Y | ||||||||||
| SMMJ16359+6612 | 2.517 | 0.12 | N | |||||||||||
| SMMJ163650+4057 | 2.385 | 1 | N | |||||||||||
| SMMJ163658+4105 | 2.452 | 1 | N | |||||||||||
| MM18423+5938 | 3.930 | 20 | 0.18 | N | ||||||||||
| SMMJ213511-0102 | 2.326 | N | ||||||||||||
| PSSJ2322+1944 | 4.120 | 0.88 | Y | |||||||||||
| ID141 | 4.243 | 20† | N | |||||||||||
| SXDF7 | 2.529 | 1 | 0.01 | N | ||||||||||
| SXDF11 | 2.282 | 1 | N | |||||||||||
| SXDF4a‡ | 2.030 | 1 | N | |||||||||||
| SXDF4b‡ | 2.027 | 1 | N | |||||||||||
| SA22.96 | 2.517 | 1 | N |
Note. — 1 - ID; 2 - Spectroscopic redshift; 3 - Gravitational magnification factor; 4 - Total infrared luminosity integrated within m. This value is due to star formation only (i.e., corrected for torus emission) for SMGs (‘N’ in column 15), while it represents the SF+AGN emission for QSOs (‘Y’ in column 15); 5 - Far-infrared luminosity integrated within m. This value is due to star formation only (i.e., corrected for torus emission) for SMGs (‘N’ in column 15), while it represents the SF+AGN emission for QSOs (‘Y’ in column 15); 6, 7 - Galaxy-integrated and ; 8, 9 - Velocity-integrated [C I] and CO fluxes; 10 - Dust mass; 11 - Mass of [C I] (from assuming K); 12 - Atomic carbon abundances computed assuming (dust, ) and removing the contribution of helium; 13 - Atomic carbon abundances computed assuming (CO, /(K km s-1 pc2), ) and removing the contribution of helium; 14 - Fraction infrared AGN emission: ; 15 - Quasar activity: Y(es)/N(o).
Upper limits are at .
All values have been corrected for gravitational magnification.
†: From (Alaghband-Zadeh et al., 2013).
‡: This source is unresolved at m, but two components are evident in the H and CO maps. The photometry refers to the unresolved source.
References: Cols 1-3, 8, 9, 15: Walter et al. (2011, W11), Alaghband-Zadeh et al. (2013, AZ13), and references therein; Cols 4, 5 (photometry): SMMJ02399-0136, SMMJ14011+0252, SMMJ16359+6612: Magnelli et al. (2012); APM08279+5255, RXJ0911+0551, F10214, Cloverleaf, PSSJ2322+1944: Stacey et al. (2018); SMMJ123549+6215: W11, Kirkpatrick et al. (2012), Ivison et al. (2011); BRI1335-0417: Guilloteau et al. (1997), Carilli et al. (1999), W11, Wagg et al. (2014); SMMJ163650+4057, SMMJ163658+4105: Kovács et al. (2006), Tacconi et al. (2006), Efstathiou & Siebenmorgen (2009), W11; MM18423+5938: Lestrade et al. (2010), Catalano et al. (2014); McKean et al. (2011); SMMJ213511-0102: Ivison et al. (2010), Swinbank et al. (2010); ID141: Cox et al. (2011); SXDF7, SXDF11, SXDF4a+b: Ivison et al. (2007), Alaghband-Zadeh et al. (2012, 2013); SA22.96: Menéndez-Delmestre et al. (2009), Alaghband-Zadeh et al. (2012, 2013).
| ID | ||||||||||||||
|---|---|---|---|---|---|---|---|---|---|---|---|---|---|---|
| (1) | (2) | (3) | (4) | (5) | (6) | (7) | (8) | (9) | (10) | (11) | (12) | (13) | (14) | (15) |
| SPT0113-46 | 4.233 | |||||||||||||
| SPT0125-50 | 3.959 | 0.16 | ||||||||||||
| SPT0300-46 | 3.596 | † | ||||||||||||
| SPT0345-47 | 4.296 | |||||||||||||
| SPT0418-47 | 4.225 | |||||||||||||
| SPT0441-46 | 4.477 | † | ||||||||||||
| SPT0459-59 | 4.799 | |||||||||||||
| SPT0529-54 | 3.369 | |||||||||||||
| SPT0532-50 | 3.399 | 0.62 | ||||||||||||
| SPT2103-60 | 4.436 | |||||||||||||
| SPT2132-58 | 4.768 | † | ||||||||||||
| SPT2146-55 | 4.567 | 0.13 | ||||||||||||
| SPT2147-50 | 3.760 |
Note. — 1 - ID; 2 - Spectroscopic redshift; 3 - Gravitational magnification factor; 4 - Stellar mass from Ma et al. (2015). We did not correct it for the minimal differences in the choice of IMF (Chabrier (2003) vs Kroupa (2001)) and stellar population models (Bruzual & Charlot (2003) vs Maraston (2005), see Section 6.1 in Ma et al. 2015); 5 - Total infrared luminosity integrated within m due to star formation (i.e., corrected for torus emission); 6 - Far-infrared luminosity integrated within m due to star formation (i.e., corrected for torus emission); 7, 8 - Galaxy-integrated and ; 9 - Velocity-integrated [C I] fluxes; 10 - Velocity-integrated CO fluxes; 11 - Dust mass; 12 - Mass of [C I] (from assuming K); 13 - Atomic carbon abundances computed assuming (dust, ) and removing the contribution of helium; 14 - Atomic carbon abundances computed assuming (CO, /(K km s-1 pc2), ) and removing the contribution of helium; 15 - Fraction infrared AGN emission: .
Upper limits are at .
All values have been corrected for gravitational magnification.
†: We report the nominal flux measurements presented in Bothwell et al. (2017), but we adopt the upper limits for the analysis.
References: Cols 1-3, 9: Bothwell et al. (2017); Col 4: Ma et al. (2015); Cols 5, 6 (photometry): Weiß et al. (2013); Col 10: Aravena et al. (2016).