11email: {fafalios, iosifidis, ntoutsi}@l3s.de 22institutetext:
†Faculty of Natural Sciences, University of Tampere, Finland
22email: kostas.stefanidis@uta.fi
Tracking the History and Evolution of Entities: Entity-centric Temporal Analysis of Large Social Media Archives
Abstract
How did the popularity of the Greek Prime Minister evolve in 2015? How did the predominant sentiment about him vary during that period? Were there any controversial sub-periods? What other entities were related to him during these periods?
To answer these questions, one needs to analyze archived documents and data about the query entities, such as old news articles or social media archives. In particular, user-generated content posted in social networks, like Twitter and Facebook, can be seen as a comprehensive documentation of our society, and thus meaningful analysis methods over such archived data are of immense value for sociologists, historians and other interested parties who want to study the history and evolution of entities and events. To this end, in this paper we propose an entity-centric approach to analyze social media archives and we define measures that allow studying how entities were reflected in social media in different time periods and under different aspects, like popularity, attitude, controversiality, and connectedness with other entities. A case study using a large Twitter archive of four years illustrates the insights that can be gained by such an entity-centric and multi-aspect analysis.
Keywords:
Social Media Archives Entity Analytics Entity Linking Sentiment Analysis1 Introduction
Social networking services have now emerged as central media to discuss and comment on breaking news and noteworthy events that are happening around the world. In Twitter, for example, every second around 6,000 tweets are posted, which corresponds to over 350,000 tweets per minute, 500 million tweets per day and around 200 billion tweets per year111http://www.internetlivestats.com/twitter-statistics/ (August 30, 2018).
Such large amount of user-generated content produced continuously in social media is considered of immense historical value for future generations Bruns and Weller (2016). However, although there are initiatives that aim to collect and preserve social media archives, like the Twitter Archive at the Library of Congress Zimmer (2015), the absence of meaningful access and analysis methods still remains a major hurdle in the way of turning such archives into useful sources of information for historians, journalists and other interested parties Bruns and Weller (2016).
When exploring archived data, analysts are not interested in the documents per se, but instead they want to see, compare, and understand the behavior of (and trends about) entities, like companies, products, politicians, athletes, celebrities, or music bands, thus calling for entity-level analytics over the archived data Weikum et al (2011).
In this paper, we propose an entity-centric approach to analyze social media archives. Our approach allows tracking of how entities are reflected in a collection of user-generated content (e.g., tweets) in different time periods, and how such information evolves over time and also with respect to other entities. Specifically, we propose a multi-aspect description of an entity in terms of its popularity (how much discussion it generates), attitude (predominant sentiment towards the entity), sentimentality (magnitude of sentiment towards the entity), controversiality (whether there is a consensus about the sentiment towards the entity), connectedness to another entity (how strong is its connection to another entity), and network (strongly connected entities). We propose measures that capture all these aspects in a given time period (e.g., day, week, or month). A distinctive characteristic of our approach is that it does not rely on service-specific labels (like #hashtags and @mentions), rather it exploits entity linking Shen et al (2015) and thus can be applied over any type of time-annotated texts.
We examine the insights gained by the proposed measures on a large collection of billions of tweets spanning a period of 4 years (Jan 2013 - Jan 2017). Such analytics enable to answer questions like the following:
-
•
How did the popularity of Greek Prime Minister, Alexis Tsipras, evolve in 2015? Were there any “outlier” periods, i.e., periods of extremely high or low popularity? What were the entities discussed in social media together with Alexis Tsipras during these periods? How did the “connectedness” of Alexis Tsipras with Vladimir Putin evolve in 2015?
-
•
How did the predominant sentiment about Donald Trump and Hillary Clinton vary during 2016? Were there any “controversial” time periods related to these two politicians, i.e., time periods in which there were many positive and negative tweets? What other entities were discussed together with Donald Trump and Hillary Clinton in tweets with predominant positive or negative sentiment?
In a nutshell, this paper makes the following contributions:
-
•
We propose a set of measures for capturing important entity features in a given time period. A sequence of such captures comprises a multi-variate time series in which each point is a multi-aspect description of the entity at a certain time period. We demonstrate the usefulness of our approach through illustrative examples.
-
•
We provide an open source Apache Spark library for computing the proposed measures efficiently.
-
•
We analyze a large Twitter archive spanning 4 years and containing billions of tweets and make publicly available the entity and sentiment annotations of this archive. This dataset can foster further research in related topics like topic evolution, entity recommendation, and concept drift.
This paper is an extension of Fafalios et al (2017b). The major changes include: i) an extensive survey of the related literature, ii) a new family of time-related measures (Entity-Time Measures), iii) an extension of the entity-relation measures with new measures for identifying the networks with positive or negative sentiment of a given entity (Positive and Negative k-Networks), iv) an extension of the case study with results related to the new measures.
The rest of this paper is organized as follows: Section 2 provides the required background and related works. Section 3 motivates and introduces the proposed measures. Section 4 describes a library for the distributed computation of the measures. Section 5 presents the results of a case study. Finally, Section 6 concludes the paper and identifies interesting directions for future research.
2 Background and Related Literature
2.1 Entity and Sentiment Annotations
Our analysis is based on two different types of annotations applied in short texts from social media archives: entity linking and sentiment analysis.
2.1.1 Entities and Entity Linking
Following Chen’s definition Chen (1976), an entity is “a thing which can be distinctly identified”. In our problem, an entity has a Web identity expressed through a unique URI Heath and Bizer (2011). This does not only include persons, locations, organizations, etc., but also events (e.g., US 2016 presidential election) and general concepts (e.g., democracy or abortion). A knowledge base contains information about a set of entities, like properties or relations with other entities. This information is described using one or more ontologies/vocabularies Chandrasekaran et al (1999). DBpedia, for instance, is a cross-domain knowledge base derived from Wikipedia that makes use of the DBpedia Ontology for describing information about its entities Lehmann et al (2015).
Entity linking is the task of automatically identifying entity mentions in a piece of text and resolving them to their corresponding entries in a reference knowledge base Shen et al (2015). For example, given the text “Obama visited Cuba” and the reference knowledge base DBpedia, an effective entity linking system should link the text “Obama” to the former USA president Barack Obama (http://dbpedia.org/resource/Barack_Obama), and the text “Cuba” to the country Cuba (http://dbpedia.org/resource/Cuba). For each annotation, an entity linking system also provides a confidence score representing the confidence that the corresponding mention has been correctly disambiguated. The survey by Shen et al. Shen et al (2015) presents a thorough overview and analysis of the main approaches to entity linking, and discuss various applications as well as the evaluation of entity linking systems. In our case studies, we used the system Yahoo FEL Blanco et al (2015) which has been specially designed for linking entities from short texts to DBpedia/Wikipedia.
2.1.2 Sentiment Analysis
Sentiment analysis refers to the problem of assigning a sentiment label (e.g., positive, negative) or sentiment score to a document Pang and Lee (2007). We opt for the latest and we use SentiStrength, a robust tool for sentiment strength detection on social web data Thelwall et al (2012). SentiStrength assigns both a positive and a negative score (since both types of sentiment can occur simultaneously in a text). The strength score of a positive sentiment ranges from +1 (not positive) to +5 (extremely positive). Similarly, negative sentiment strength scores range from -1 (not negative) to -5 (extremely negative). For example, given the text “I love you but hate the current political climate”, SentiStrength provides the positive sentiment score +3 and the negative sentiment score -4.
In Section 5.1 we report evaluation results regarding the accuracy of Yahoo FEL and SentiStrength.
2.2 Related Works
The availability of web-based application programming interfaces (APIs) provided by popular social media services like Twitter and Facebook, has led to an “explosion” of techniques, tools and platforms for social media analytics. Batrinca and Treleaven Batrinca and Treleaven (2015) surveys analytics tools for social media as well as tools for scraping, data cleaning and sentiment analysis on social media data. There is also a plethora of works on exploiting social media for a variety of tasks, like opinion summarization Meng et al (2012), event and rumor detection Farzindar and Khreich (2015); Qazvinian et al (2011), topic popularity and summarization Ardon et al (2011); Yao et al (2016), information diffusion Guille et al (2013), popularity prediction Saleiro and Soares (2016), and reputation monitoring Amigó et al (2014). Furthermore, social media is exploited by research communities for research and experimentation in a variety of research problems. Examples include the Making Sense of Microposts series of workshops Rizzo et al (2015, 2016), or the Sentiment Analysis in Twitter tasks of the International Workshop on Semantic Evaluation Nakov et al (2016); Rosenthal et al (2017). Below, we describe works related to the temporal analysis of topics and entities in social media.
Stefanidis and Koloniari Stefanidis and Koloniari (2014) propose a query-answering framework to allow entity search in social networks by exploiting the underlying social graph and temporal information. To satisfy the varying search needs, the framework includes a time-aware query model and a corresponding logical algebra. To deal with the temporal aspect, the authors adopt an annotated graph model that incorporates time by associating each element in the graph with its temporal information. The nodes (representing users and objects) and the edges between them (representing social relationships) have a label that indicates their valid time. The proposed query model allows for time-dependent queries that exploit time explicitly by using it as a hard constraint to filter out irrelevant results.
Ardon et al. Ardon et al (2011) perform a spatiotemporal analysis of tweets, investigating the time-evolving properties of the subgraphs formed by the users discussing each topic. The focus is on the network topology formed by follower-following links on Twitter and the geospatial location of the users. The authors investigated the effect of initiators on the popularity of topics and find that users with a high number of followers have a strong impact on popularity. They also showed that topics become popular when disjoint clusters of users discussing them begin to merge and form one giant component that grows to cover a significant fraction of the network.
Bruns and Stieglitz Bruns and Stieglitz (2013) introduce a catalogue of metrics for analyzing hashtag-based communication on Twitter, with particular focus on hashtagged Twitter conversations. The proposed metrics can be categorized into: metrics that examine the total activity and visibility of individual participants, metrics that establish the temporal flow of conversation and of specific forms of conversation, and metrics that combine the activity of the users and the flow of conversations to examine the relative contributions of specific user groups in different time points.
Saleiro and Soares Saleiro and Soares (2016) tackle the problem of predicting entity popularity on Twitter based on the news cycle. The authors apply a supervised learning approach and extract four types of features (signal, textual, sentiment, and semantic) which are used to predict whether the popularity of a given entity will be high or low in the following hours. The results of an experimental evaluation showed that news perform better on predicting entity popularity on Twitter when they are the primary information source of the event, in opposition to events such as live TV broadcasts, political debates or football matches.
Celik et al. Celik et al (2011) investigate whether semantic relationships between entities can be learned by analyzing microblog posts published on Twitter. The authors developed a relation discovery framework that allows for the detection of typed relations that may have temporal dynamics. The evaluation results showed that co-occurrence based strategies allow for high precision and perform particularly well for relations between persons and events. Our entity-to-entity connectedness scores are also based on entity co-occurrences (more in Section 3). The authors also analyzed the performance in learning relationships that are valid only for a certain time period and revealed that Twitter is a suitable source for this type of relationships because it allows the discovery of trending topics with high accuracy and low delay.
Ren et al. Ren et al (2013) consider the task of time-aware tweets summarization exploiting user’s history and collaborative social influences from social circles. The authors propose a time-aware user behavior model, called Tweet Propagation Model, in which dynamic probabilistic distributions over interests and topics are inferred. In the same context, Zhao et al. Zhao et al (2013) study how to incorporate social attention in the generation of timeline summaries. Given a topic, the authors propose learning users’ collective interests in the form of word distributions from Twitter which are subsequently incorporated into a unified framework for timeline summary generation. In a similar problem, Chang et al. Chang et al (2013) introduce the task of Twitter context summarization, which generates a succinct summary from a large but noisy Twitter context tree. The authors study how user influence models, which project user interaction information onto a Twitter context tree, can help Twitter context summarization within a supervised learning framework.
Regarding more recent works on timeline summarisation, Yao et al. Yao et al (2016) focus on how to select a small set of representative tweets to generate a meaningful timeline, which provides enough coverage for a given topical query. The proposed approach jointly models individual topical relevance and overall diversity within a probabilistic model. Chang et al. Chang et al (2016) propose a framework called Timeline-Sumy, which consists of two main components: episode detecting, and summary ranking. Episode detecting aims to identify key episodes in a timeline, while summary ranking ranks the social media posts in each episode via a learning-to-rank approach.
Finally, Li and Cardie Li and Cardie (2014) propose an unsupervised framework for creating a chronological list of a user’s personal important events. The authors introduce a non-parametric multi-level Dirichlet Process model to recognize four types of tweets: personal time-specific, personal time-general, public time-specific, and public time-general. These tweets, in turn, are used for further personal event extraction and timeline generation.
To our knowledge, our work is the first that models multi-aspect entity-centric analytics for social media archives, by combining automatically extracted entities with sentiment information expressed in the tweets. The proposed measures capture the multi-aspect behavior of an entity in different time periods and can be exploited in a variety of tasks, like entity evolution, event detection, and entity recommendation. In addition, our approach does not rely on service-specific labels (likes hashtags) and thus can be applied over any type of time-annotated short texts.
3 Multi-aspect Entity Measures
3.1 Motivation
According to Weikum et al. Weikum et al (2011), when exploring archived data, like old web archives, analysts prefer to deal with semantically rich entities like people, places, organizations, and ideally relationships among them, instead of documents containing such references. The authors envision a system that should support a wide spectrum of analytical tasks that span the text, entity and time dimensions, such as identification of salient entities for different subsets of an archive, entity-to-entity co-occurrences, or detection of interesting time points or periods for a given entity. In addition, to preserve Twitter as a historical source, Bruns and Weller Bruns and Weller (2016) suggest that important events should be monitored while systems should offer the possibility to collect tweets for single events in order to document important background information or other contextual information (like related entities).
Considering the above, we propose a set of entity-centric measures that allow studying how entities (including events) are reflected in social media in different time periods and under different aspects. We propose a multi-aspect description of an entity in terms of the following aspects (computed for a given time period, like a specific day, week, or month):
-
•
entity popularity (how much discussion it generates)
-
•
entity attitude (predominant sentiment towards the entity)
-
•
entity sentimentality (magnitude of sentiment towards the entity)
-
•
entity controversiality (whether there is a consensus about the sentiment towards the entity)
-
•
entity-to-entity connectedness (how strong is its connection to another entity)
-
•
entity network (strongly connected entities)
These time-dependent entity features can facilitate research in a plethora of related problems, including prediction tasks Yu and Kak (2012); Saleiro and Soares (2016) (by exploiting popularity, attitude and sentimentality), controversy detection Garimella et al (2018) (by exploiting controversiality), time-aware entity relatedness Mohapatra et al (2018) (by exploiting entity-to-entity connectedness), and time-aware entity recommendation Zhang et al (2016) (by exploiting entity network).
Below, we formally introduce the proposed measures by classifying them into three categories: i) single-entity measures, ii) entity-time measures, and iii) entity-relation measures.
3.2 Single-Entity Measures
First, let be a collection of short texts (e.g., tweets) covering the time period (where are two different time points with ), and let be the total set of users who posted these texts. Let also denote a finite set of entities, e.g., all Wikipedia entities.
Popularity
Let be a given entity and a given time period. Let also be the collection of short texts posted during . The popularity of during equals to the percentage of texts mentioning during that period. Formally:
| (1) |
where denotes the set of texts mentioning during .
Using the above measure, an entity can be very popular even if it is discussed by a few users but in a large number of texts. A more fine-grained indication of popularity is given by the number of different users discussing the entity. In that case, if denotes the user who posted the text , the popularity of an entity during can be defined as the percentage of different users discussing during that period, i.e.:
| (2) |
We can now combine both aspects (percentage of texts and users) in one popularity score:
| (3) |
An entity has now a high popularity score if it is discussed in many tweets and by many different users.
Attitude and Sentimentality
We use two measures (proposed by Kucuktunc et al. Kucuktunc et al (2012) for the case of questions and answers) for capturing a text’s attitude (predominant sentiment) and sentimentality (magnitude of sentiment). First, for a text , let be the text’s positive sentiment score and be the text’s negative sentiment score (according to SentiStrength, c.f. Section 2.1). The attitude of a text is given by (i.e., ) and its sentimentality by (i.e., ).
We now define the attitude of an entity in a time period as the average attitude of texts mentioning during . Formally:
| (4) |
Likewise, the sentimentality of an entity in a time period is defined as the average sentimentality of texts mentioning during :
| (5) |
Controversiality
An entity can be considered controversial in a time period if it is mentioned in plenty of both positive and negative texts. First, let be the set of texts mentioning during with strong positive attitude, i.e., , where is a strong attitude threshold (e.g., ). Likewise, let be those with strong negative attitude, i.e., . We now consider the following formula for entity controversiality:
| (6) |
Intuitively, a value close to 1 means that the probability of the entity being “controversial” is high since there is a big percentage of texts with strong attitude (first part of the formula) and also there are many texts with both strong positive attitude and strong negative attitude (second part of the formula).
3.3 Entity-Time Measures
By exploiting the single-entity measures, we can now compute important time sub-periods of granularity (e.g., day, week or month) for a given entity in a given time-period. For instance, given the entity Barack Obama, the time period 2015 and the granularity month, we can find the top-3 months of 2015 of high or low Obama’s popularity. Then, for a specific month, we can find the top-5 days of high or low Obama’s popularity. We define the following measures:
-
•
Top-K time sub-periods of high/low popularity
-
•
Top-K time sub-periods of high/low attitude
-
•
Top-K time sub-periods of high/low controversiality
Top-K Time Periods of High/Low Popularity
Given an entity , a time period and a granularity , the top- time periods of high popularity of during is the set of time (sub-)periods of granularity with the highest entity popularity score (cf. Formula 3). Let first be the set of all time (sub-)periods of granularity covering the time-period (for example, all days in a month). Now, the top-K time (sub-)periods of high popularity of during can be defined as:
| (7) |
Likewise, the set of top-K time (sub-)periods of low popularity is defined as:
| (8) |
Top-K Time Periods of High/Low Attitude
By exploiting the attitude measure (cf. Formula 4), we can find time periods of high or low entity attitude. Given an entity , a time period and a granularity , the top- time periods of high attitude of during is the set of time (sub-)periods of granularity with the highest entity attitude score. Formally:
| (9) |
Likewise, the set of top- time periods of low attitude is defined as:
| (10) |
Top-K Time Periods of High/Low Controversiality
Given an entity , a time period and a granularity , the top- controversial time periods of during is the set of time (sub-)periods of granularity with the highest entity controversiality score (cf. Formula 6). Formally:
| (11) |
Likewise, the set of top- time periods of low controversiality is defined as:
| (12) |
3.4 Entity-Relation Measures
Here we define measures that quantify the degree of association (or connectedness) of a query entity with other entities mentioned in the same collection.
Entity-to-Entity Connectedness
We define a direct-connectedness score between an entity and another entity in a time period , as the number of texts in which and co-occur within . Formally:
| (13) |
Notice that the relation is not symmetric. We consider that if an entity is strongly connected with an entity , this does not mean that is also strongly connected with . For example, consider that Alexis Tsipras is mentioned in only 100 texts during , Barack Obama in 1M texts, while 90 texts mention both entities. We notice that Barack Obama seems to be a very important entity for Alexis Tsipras during , since it exists in 90/100 of texts mentioning Alexis Tsipras. On the contrary, Alexis Tsipras seems not to be important for Barack Obama , since it exists in only 90/1M of texts mentioning Barack Obama.
Two entities may not co-occur in texts, but they may share many common co-occurred entities. For example, both Barack Obama and Donald Trump may co-occur with entities like White House, US Election and Hillary Clinton. For an input entity and another entity , we define an indirect-connectedness score which considers the number of common entities with which and co-occur in a time period :
| (14) |
where is the entities mentioned in text . Also in this case, the relation between the two entities is not symmetric.
Entity -Network
This measure targets at finding a list of entities strongly connected to the query entity in a given time period . First, we define a connectedness score between an entity and a set of entities within , as the average direct-connectedness score of the entities in . Formally:
| (15) |
The -Network of an entity during is the set of entities with the highest average connectedness score. Namely:
| (16) |
In simple terms, the -Network of an entity consists of the entities with the highest direct-connectedness scores.
Positive & Negative -Networks
Based on the attitude of the texts mentioning two entities, we can compute the corresponding positive and negative -Networks. First, for an entity and a time period , the set of positive entities can be defined as the set of entities co-occurring with during in texts with strong average positive attitude, i.e.:
| (17) |
where is a strong attitude threshold (e.g., ). Likewise, the set of entities co-occurring with during in texts with strong average negative attitude can be defined as:
| (18) |
Now, the positive and negative -Networks of an entity in a time period can be defined as:
| (19) |
| (20) |
3.5 Discussion
The above presented measures capture the multi-aspect behavior of a given entity at a certain time period. In the long run, a multi-variate time series is formed where each point represents the multi-aspect description of the entity at a certain period in time.
An important characteristic of our approach is that we can support both entity-specific queries referring to a single entity and cross-entity queries involving more than one entities (e.g., a category of entities). This is achieved through the entity linking process in which entities are extracted from the texts and are linked to knowledge bases like Wikipedia/DBpedia. In that way, we can collect a variety of properties for the entities extracted from our archive. This enables us to aggregate information and capture the behavior of sets of entities. For example, by accessing DBpedia, we can collect a list of German politicians, derive their popularity and then compare it with that of another set of entities.
In addition, the proposed measures can be easily computed by submitting queries on related knowledge bases that contain metadata and annotation information about a collection of archived documents or social media posts Fafalios et al (2017a, 2018a, 2018b). This enables the production of time series at query-execution time, thereby allowing the answer of complex information needs (through structured SPARQL queries) as well as “on the fly” data integration (by exploiting other knowledge bases like DBpedia).
4 Library for Computing the Measures
For computing the measures, we provide an Apache Spark library. Apache Spark222http://spark.apache.org/ is a cluster-computing framework for large-scale data processing. The library contains functions for computing the proposed measures for a given entity and over a specific time period. It operates over an annotated (with entities and sentiments) dataset split per year-month (the dataset should be in a simple CSV format). The library is available as open source333https://github.com/iosifidisvasileios/Large-Scale-Entity-Analysis.
The time for computing the measures highly depends on the dataset volume, the used computing infrastructure as well as the available resources and the load of the cluster at the analysis time. The Hadoop cluster used in our experiments for analyzing a large Twitter archive of more than 1 billion tweets consisted of 25 computer nodes with a total of 268 CPU cores and 2,688 GB RAM (more about the dataset in the next section). Indicatively, the time for computing each of the measures was on average less than a minute (without using any index, apart from the monthly-wise split of the dataset).
5 Case Study: Entity Analytics on a Twitter Archive
In this section, we first describe the results of the analysis and annotation of a large Twitter archive. Then, we present examples of case studies illustrating the insights gained from the proposed measures.
5.1 Annotating a Large Twitter Archive
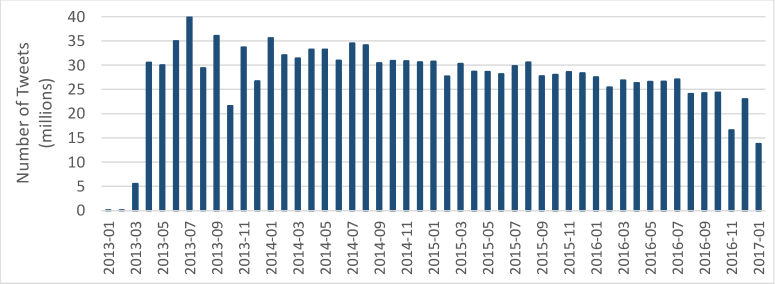
We analyzed a large Twitter archive spanning 4 years (January 2014 - January 2017) and containing more than 6 billion tweets. The tweets were collected through the Twitter streaming API. Our analysis comprised the following steps: i) filtering (filtering out re-tweets, keeping only English tweets), ii) spam removal, iii) entity linking, and iv) sentiment analysis. The filtering step reduced the number of tweets to about 1.5 billion tweets (specifically, to 1,486,473,038 tweets). For removing the spam tweets, we trained a Multinomial Naive Bayes (MNB) classifier over the HSpam dataset Sedhai and Sun (2015), which consists of tweets annotated as either spam or not. We applied the learned model to our dataset and removed all tweets classified as spam. This removed about 150 million tweets (around 10% of the tweets). The final dataset consists of 1,335,324,321 tweets posted by 110,548,539 users. Figure 1 shows the number of tweets per month on the final dataset.
For the entity linking task, we used Yahoo FEL Blanco et al (2015) with a confidence threshold score of -3. In total, 1,390,286 distinct entities were extracted from the collection. For each extracted entity, its confidence score provided by FEL is also stored. Thereby, data consumers can select suitable confidence ranges to consider, depending on the specific requirements with respect to precision and recall. For sentiment analysis, we used SentiStrength Thelwall et al (2012). The average sentimentality of all tweets is 0.92, the average attitude 0.2, while 622,230,607 tweets have no sentiment (-1 negative sentiment and 1 positive sentiment). Table 1 shows the number of tweets per attitude value.
| Attitude value | Number of Tweets |
|---|---|
| -4 | 2,234,887 (0.17%) |
| -3 | 34,666,708 (2.60%) |
| -2 | 68,812,370 (5.15%) |
| -1 | 104,628,022 (7.84%) |
| 0 | 670,484,267 (50.2%) |
| 1 | 301,635,430 (22.6%) |
| 2 | 138,197,637 (10.3%) |
| 3 | 13,610,492 (1.02%) |
| 4 | 1,054,508 (0.08%) |
Quality of entity annotations
We used the ground truth dataset provided by the 2016 NEEL challenge of the 6th workshop on “Making Sense of Microposts” (#Microposts2016)444http://microposts2016.seas.upenn.edu/ Rizzo et al (2016) for evaluating the quality of the entity annotations produced by FEL. The dataset consists of 9,289 English tweets of 2011-2015. We considered all tweets from the provided training, dev and test files. The results are the following: Precision = 86%, Recall = 39%, F1 = 54%. We notice that FEL achieves high precision, however recall is low. The reason is that FEL did not manage to recognize several difficult cases, like entities within hashtags and nicknames, which are common in Twitter. Nevertheless, FEL’s performance is comparable to existing approaches Rizzo et al (2015, 2016).
Quality of sentiment annotations
We evaluated the accuracy of SentiStrength using the ground truth datasets SemEval2017 (Task 4, Subtask A)555http://alt.qcri.org/semeval2017/task4/ Rosenthal et al (2017) and TSentiment15666https://l3s.de/~iosifidis/TSentiment15/ Iosifidis and Ntoutsi (2017). The SemEval2017 dataset consists of 61,853 English tweets collected during the period 2013-2017 and labeled by human annotators as positive, negative, or neutral. We run the evaluation on all the provided training files (of 2013-2016) and on the 2017 test file. SentiStrength achieved the following scores: AvgRec = 0.54 (recall averaged across the positive, negative, and neutral classes Sebastiani (2015)), = 0.52 (F1 averaged across the positive and negative classes), Accuracy = 0.57. The performance of SentiStrength is good considering that this is a multi-class classification problem. The user can also achieve higher precision by selecting only tweets with high positive or negative SentiStrength score (e.g., +2 for positive or for negative sentiment). Regarding the TSentiment15 dataset, it consists of 2,527,753 English tweets collected during 2015, labeled as either positive or negative through semi-supervised learning Iosifidis and Ntoutsi (2017). SentiStrength achieved the following scores: = 0.80, Accuracy = 0.91. Here we notice that SentiStrength achieves very good performance. To conclude, our evaluation on Twitter ground truth datasets showed that SentiStrength achieves good performance in sentiment annotation of tweets.
Dataset availability
The annotated dataset is publicly available in CSV format777http://l3s.de/~iosifidis/tpdl2017/. For each tweet the dataset includes the following information: ID, user (encrypted), post date, extracted entities, positive and negative sentiment values (the text of the tweets is not provided for copyright purposes888https://help.twitter.com/en/rules-and-policies/copyright-policy).
We make the dataset available so anyone interested can use it together with the library (described in Section 4) to extract the measures for any entity at the desired level of temporal granularity. We believe that such efforts can foster further research in a variety of areas like entity recommendation, entity summarisation and concept drift.
5.2 Case Studies
Entity Popularity
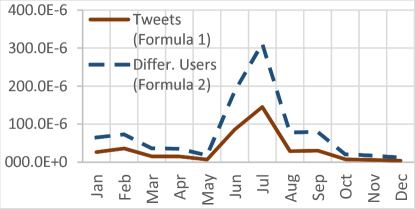
Figure 2 shows the popularity of Alexis Tsipras (Greek prime minister) within 2015. We notice that his popularity highly increased in July. Indeed, in July 2015 the Greek bailout referendum was held following the bank holiday and capital controls of June 2015. This event highly increased the popularity of the Greek prime minister. Moreover, by comparing the trend of the two different popularity scores (Formulas 1 and 2), we notice that, during June and July 2015, the percentage of different users discussing about Alexis Tsipras increased in bigger degree compared to the percentage of tweets, implying that more people were engaged in the discussion. As regards his top- time periods of high/low popularity (Formulas 7 and 8), we notice that the top-3 months of high popularity in 2015 are [July, June, February], while the corresponding top-3 months of low popularity are [December, November, May].
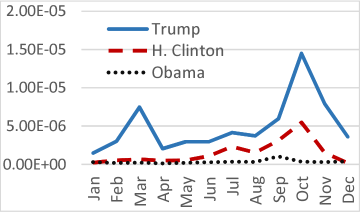
Likewise, we can compare the popularity of multiple entities within the same time period. For example, Figure 3 shows the popularity of Donald Trump, Hillary Clinton and Barack Obama within 2016 (according to Formula 3). We notice that Donald Trump is much more popular in all months. We also notice that, in October 2016 the popularity of Donald Trump and Hillary Clinton highly increased compared to the other months. This is an indicator of possible important events related to these two entities in October 2016 (indeed, two presidential general election debates took place in that period). The top-3 months of high popularity in 2016 are [October, November, March] for Donald Trump, [October, September, July] for Hillary Clinton, and [September, December, July] for Barack Obama.
Entity Attitude
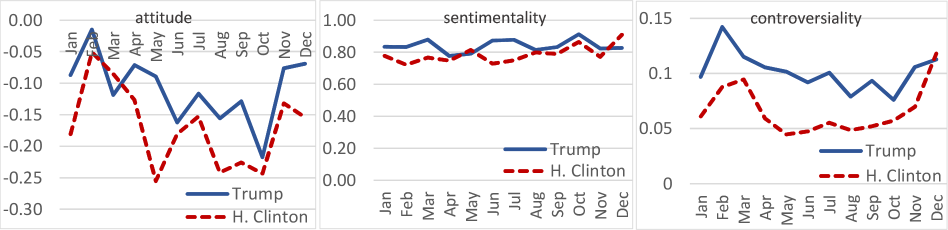
Figure 4 (left) depicts the attitude of Donald Trump and Hillary Clinton within 2016. We notice that both entities had constantly a negative attitude, however that of Hillary Clinton was worse in almost all months. Moreover, we notice that Hillary Clinton’s attitude highly decreased in May 2016 (possibly, for example, due to a report issued by the State Department related to Clinton’s use of private email), while October 2016 was the month with the lowest attitude value for Donald Trump (possibly due to the several sexual assault allegations leveled against Donald Trump during that period). The top-3 months of high attitude in 2016 are [February, December, April] for Donald Trump, and [February, March, April] for Hillary Clinton, while the corresponding top-3 months of low attitude are [October, June, August] for Donald Trump, and [May, October, August] for Hillary Clinton.
In general, we notice that the attitude values are relatively small and close to zero. This is due to the very big number of tweets with no sentiment (almost half of the tweets).
Entity Sentimentality
Figure 4 (middle) depicts the sentimentality of Donald Trump and Hillary Clinton within 2016. We notice that for the majority of months the tweets mentioning Donald Trump are a bit more sentimental than those mentioning Hillary Clinton.
October seems to be one of the most “sentimental” months for both Donald Trump and Hillary Clinton, possibly due to the several revelations that were uncovered for both candidates the period before the US presidential election (held on November 8).
Entity Controversiality
Figure 4 (right) shows the controversiality of Donald Trump and Hillary Clinton within 2016 (using ). We notice that Donald Trump induces more controversial discussions in Twitter than Hillary Clinton, while February was his most “controversial” month, probably because of his references to some debatable topics during his campaign trail. It is interesting also that Hillary Clinton’s controversiality has an exponential increment from September to December 2016 (the period before, during, and after the US presidential election).
As regards their top- time periods of high/low controversiality (Formulas 11 and 12), the top-3 months of high controversiality in 2016 are [February, March, December] for Donald Trump and [December, March, February] for Hillary Clinton, while the corresponding top-3 months of low controversiality are [October, August, June] for Donald Trump and [May, June, August] for Hillary Clinton.
Entity-to-Entity Connectedness
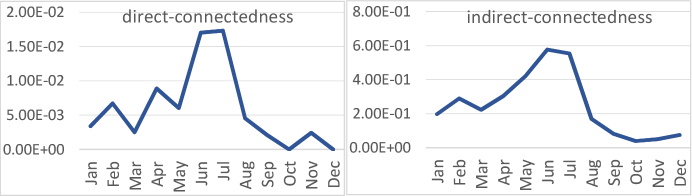
Figure 5 depicts the connectedness of Alexis Tsipras with the concept Greek withdrawal from the eurozone within 2015. We notice that these two entities are highly connected in June and July, while after August, their connectedness is very close to zero. Indeed, important events related to Greece’s debt crisis took place in June and July 2015, including the bank holiday, the capital controls and the Greek bailout referendum.
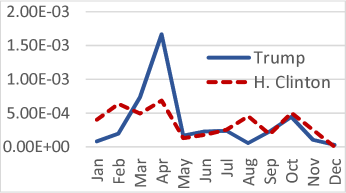
Likewise, Figure 6 shows the connectedness of both Donald Trump and Hillary Clinton with the concept Abortion in 2016. Here we notice that the connectedness is almost constant for Hillary Clinton, while for Donald Trump, there is a very large increment in March and April. During these two months, Donald Trump made several anti-abortion comments, like that “there has to be some form of punishment” for women who have abortions999https://www.nytimes.com/2016/03/31/us/politics/donald-trump-abortion.html (August 30, 2018).
Entity -Network
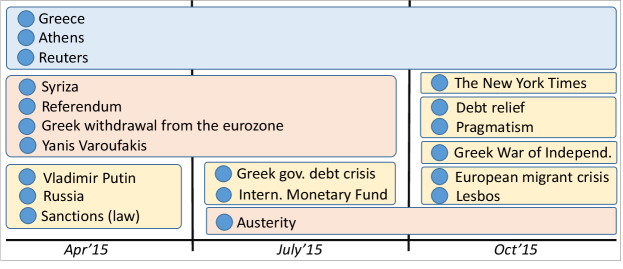
Figure 7 shows the 10-Network of Alexis Tsipras in three different time periods (April, July and October, 2015). We notice that there are three general entities that exist in all time periods (Greece, Athens, Reuters). For April and July, we notice that the 10-Network contains 4 common entities (Syriza, Referendum, Greek withdrawal from the eurozone, and Yanis Varoufakis), while for July and October, Austerity is the only common entity (probably related to the approval of strict measures required by the creditors). For April, the 10-Network contains three entities related to Russia (due to Tsipra’s visit in Moscow to meet Russian president Vladimir Putin), while for October, it contains two entities related to European migrant crisis (probably due to Tsipra’s visit in Lesvos island).
Entity Positive & Negative -Networks
In Figure 4 (left), we saw that the attitude towards Donald Trump highly decreased in October 2016. To understand this decrement, we can inspect his Negative -Network during the same period, i.e., the entities that co-occur with Donald Trump in tweets with strong average negative attitude during October 2016. Table 3 shows the results for and . We notice that the top-5 list contains entities related to important events that happened during this period and which are related to Donald Trump, including Iraq War (Donald Trump said that he opposed Iraq War from the start, however there appeared audio evidence of him saying he supported it), Bill Clinton (Donald Trump appeared with Bill Clinton accusers before a debate), Toddler (Donald Trump brought a toddler to the stage during a campaign rally), and Central Park (related to the Central Park jogger case: Donald Trump declared that the Central Park Five were guilty).
In Figure 4 (left), we also notice that the attitude towards Donald Trump highly increased in November-December 2016. Table 3 shows the corresponding Positive 5-Network of Donald Trump for this time period (using again ). The top-5 list contains entities related to Donald Trump’s election (Cold open, God Bless America, Cheers, and Excite) as well as the entity Henry Kissinger with whom Donald Trump met on November 17.
| Rank | Entity |
|---|---|
| 1 | Iraq War |
| 2 | Bill Clinton |
| 3 | Toddler |
| 4 | Embarrassment |
| 5 | Central Park |
| Rank | Entity |
|---|---|
| 1 | Cold open |
| 2 | God Bless America |
| 3 | Henry Kissinger |
| 4 | Cheers |
| 5 | Excite |
5.3 Limitations and Problems
Although the proposed analysis approach is generic and can be applied over different types of social media archives, it is clear that the quality of the generated data depends on the quality of the input data. Twitter, for example, provides 1% random sample, which though is subject to bias, fake news and possibly other adversarial attacks. In our case study, although we remove spam, we do not take similar actions to deal with bias and other data peculiarities. This also means that high profile entities might occupy a big volume in the archive, whereas long-tail entities might be underrepresented or not represented at all.
Except for the quality of the original data, the different preprocessing steps (spam removal, entity linking, sentiment analysis) are also prone to errors. This means that the data produced by the proposed measures are also prone to errors. For instance, regarding the entity linking task, selecting a low threshold for the confidence score of the extracted entities can result in many false annotations (disambiguation errors), which in turn can affect the quality and reliability of the produced time-series. For the case of Entity k-Networks in particular, one may get some unexpected and surprising results due to disambiguation errors. For instance, the Negative 10-Network of Donald Trump for October 2016 returns the entity Harrow (tool), while that of Hillary Clinton for May 2016 returns the entity Clueless (film). Both these two entities have been incorrectly disambiguated by FEL.
6 Conclusion
We have proposed an entity-centric and multi-aspect approach to analyze social media archives. For this, we defined a set of measures that allow studying how entities are reflected in social media in different time periods as well as how entity-related information evolves over time and also with respect to other entities. The proposed measures enable the temporal analysis of an entity in terms of its: popularity (how much discussion it generates), attitude (predominant sentiment towards the entity), sentimentality (magnitude of sentiment towards the entity), controversiality (whether there is a consensus about the sentiment towards the entity), connectedness to another entity (how strong is its connection to another entity), and network (strongly connected entities).
We believe that such a multi-aspect analysis approach is the first step towards more advanced and meaningful exploration of social media archives, while it can facilitate research in a variety of fields, such as data science, sociology, and digital humanities.
As part of our future work, we plan to exploit the rich amount of generated data for prediction of entity-related features. In particular, given an entity, our focus will be on how we can predict future values of the proposed measures (e.g., popularity or attitude in a given horizon) Saleiro and Soares (2016). We also intend to study approaches on understanding and representing the dynamics of such evolving entity-related information, using for instance an RDF-based approach Roussakis et al (2015). Another interesting direction is the exploitation of the entity-relation measures on the related problems of time-aware entity relatedness Mohapatra et al (2018) and event timeline summarisation Tran et al (2015).
Acknowledgements.
The work was partially funded by the European Commission for the ERC Advanced Grant ALEXANDRIA (No. 339233) and by the German Research Foundation (DFG) project OSCAR (Opinion Stream Classification with Ensembles and Active leaRners).References
- Amigó et al (2014) Amigó E, Carrillo de Albornoz J, Chugur I, Corujo A, Gonzalo J, Meij E, de Rijke M, Spina D (2014) Overview of replab 2014: Author profiling and reputation dimensions for online reputation management. In: CLEF
- Ardon et al (2011) Ardon S, Bagchi A, Mahanti A, Ruhela A, Seth A, Tripathy RM, Triukose S (2011) Spatio-temporal analysis of topic popularity in Twitter. arXiv preprint arXiv:11112904
- Batrinca and Treleaven (2015) Batrinca B, Treleaven PC (2015) Social media analytics: a survey of techniques, tools and platforms. AI & SOCIETY 30(1):89–116
- Blanco et al (2015) Blanco R, Ottaviano G, Meij E (2015) Fast and space-efficient entity linking for queries. In: WSDM
- Bruns and Stieglitz (2013) Bruns A, Stieglitz S (2013) Towards more systematic Twitter analysis: metrics for tweeting activities. Internat Journal of Social Research Methodology 16(2):91–108
- Bruns and Weller (2016) Bruns A, Weller K (2016) Twitter as a first draft of the present: and the challenges of preserving it for the future. In: WebSci
- Celik et al (2011) Celik I, Abel F, Houben GJ (2011) Learning semantic relationships between entities in Twitter. In: ICWE
- Chandrasekaran et al (1999) Chandrasekaran B, Josephson JR, Benjamins VR (1999) What are ontologies, and why do we need them? IEEE Intelligent Systems and their applications 14(1):20–26
- Chang et al (2013) Chang Y, Wang X, Mei Q, Liu Y (2013) Towards twitter context summarization with user influence models. In: WSDM
- Chang et al (2016) Chang Y, Tang J, Yin D, Yamada M, Liu Y (2016) Timeline summarization from social media with life cycle models. In: IJCAI
- Chen (1976) Chen PPS (1976) The entity-relationship model—toward a unified view of data. ACM Transactions on Database Systems (TODS) 1(1):9–36
- Fafalios et al (2017a) Fafalios P, Holzmann H, Kasturia V, Nejdl W (2017a) Building and querying semantic layers for web archives. In: 2017 ACM/IEEE Joint Conference on Digital Libraries (JCDL), IEEE, pp 1–10
- Fafalios et al (2017b) Fafalios P, Iosifidis V, Stefanidis K, Ntoutsi E (2017b) Multi-aspect entity-centric analysis of big social media archives. In: International Conference on Theory and Practice of Digital Libraries, Springer, pp 261–273
- Fafalios et al (2018a) Fafalios P, Holzmann H, Kasturia V, Nejdl W (2018a) Building and querying semantic layers for web archives (extended version). International Journal on Digital Libraries DOI 10.1007/s00799-018-0251-0
- Fafalios et al (2018b) Fafalios P, Iosifidis V, Ntoutsi E, Dietze S (2018b) Tweetskb: A public and large-scale rdf corpus of annotated tweets. In: European Semantic Web Conference, Springer, pp 177–190
- Farzindar and Khreich (2015) Farzindar A, Khreich W (2015) A survey of techniques for event detection in twitter. Computational Intelligence 31(1):132–164
- Garimella et al (2018) Garimella K, Morales GDF, Gionis A, Mathioudakis M (2018) Quantifying controversy on social media. ACM Transactions on Social Computing 1(1):3
- Guille et al (2013) Guille A, Hacid H, Favre C, Zighed DA (2013) Information diffusion in online social networks: A survey. SIGMOD Record 42(2):17–28
- Heath and Bizer (2011) Heath T, Bizer C (2011) Linked data: Evolving the web into a global data space. Synthesis lectures on the semantic web: theory and technology 1(1):1–136
- Iosifidis and Ntoutsi (2017) Iosifidis V, Ntoutsi E (2017) Large scale sentiment learning with limited labels. In: KDD
- Kucuktunc et al (2012) Kucuktunc O, Cambazoglu BB, Weber I, Ferhatosmanoglu H (2012) A large-scale sentiment analysis for Yahoo! answers. In: WSDM
- Lehmann et al (2015) Lehmann J, Isele R, Jakob M, Jentzsch A, Kontokostas D, Mendes PN, Hellmann S, Morsey M, Van Kleef P, Auer S, et al (2015) Dbpedia–a large-scale, multilingual knowledge base extracted from wikipedia. Semantic Web 6(2):167–195
- Li and Cardie (2014) Li J, Cardie C (2014) Timeline generation: Tracking Individuals on Twitter. In: WWW
- Meng et al (2012) Meng X, Wei F, Liu X, Zhou M, Li S, Wang H (2012) Entity-centric topic-oriented opinion summarization in Twitter. In: KDD
- Mohapatra et al (2018) Mohapatra N, Iosifidis V, Ekbal A, Dietze S, Fafalios P (2018) Time-aware and corpus-specific entity relatedness. In: Workshop on Deep Learning for Knowledge Graphs and Semantic Technologies (DL4KGS) - In conjunction with ESWC 2018, Heraklion, Greece
- Nakov et al (2016) Nakov P, Ritter A, Rosenthal S, Sebastiani F, Stoyanov V (2016) Semeval-2016 task 4: Sentiment analysis in twitter. In: SemEval@ NAACL-HLT
- Pang and Lee (2007) Pang B, Lee L (2007) Opinion mining and sentiment analysis. Foundations and Trends in Information Retrieval 2(1-2):1–135
- Qazvinian et al (2011) Qazvinian V, Rosengren E, Radev DR, Mei Q (2011) Rumor has it: Identifying misinformation in microblogs. In: EMNLP
- Ren et al (2013) Ren Z, Liang S, Meij E, de Rijke M (2013) Personalized time-aware tweets summarization. In: SIGIR
- Rizzo et al (2015) Rizzo G, Basave AEC, Pereira B, Varga A (2015) Making sense of microposts (#microposts2015) named entity recognition and linking (NEEL) challenge. CEUR-WS.org
- Rizzo et al (2016) Rizzo G, van Erp M, Plu J, Troncy R (2016) Making sense of microposts (#microposts2016) named entity recognition and linking (NEEL) challenge. CEUR-WS.org
- Rosenthal et al (2017) Rosenthal S, Farra N, Nakov P (2017) Semeval-2017 task 4: Sentiment analysis in twitter. In: SemEval
- Roussakis et al (2015) Roussakis Y, Chrysakis I, Stefanidis K, Flouris G, Stavrakas Y (2015) A Flexible Framework for Understanding the Dynamics of Evolving RDF Datasets. In: ISWC
- Saleiro and Soares (2016) Saleiro P, Soares C (2016) Learning from the news: Predicting entity popularity on twitter. In: International Symposium on Intelligent Data Analysis, Springer, pp 171–182
- Sebastiani (2015) Sebastiani F (2015) An axiomatically derived measure for the evaluation of classification algorithms. In: ICTIR
- Sedhai and Sun (2015) Sedhai S, Sun A (2015) Hspam14: A collection of 14 million tweets for hashtag-oriented spam research. In: SIGIR
- Shen et al (2015) Shen W, Wang J, Han J (2015) Entity linking with a knowledge base: Issues, techniques, and solutions. IEEE Transactions on Knowledge and Data Engineering 27(2):443–460
- Stefanidis and Koloniari (2014) Stefanidis K, Koloniari G (2014) Enabling Social Search in Time through Graphs. In: Web-KR@CIKM
- Thelwall et al (2012) Thelwall M, Buckley K, Paltoglou G (2012) Sentiment strength detection for the social web. Journal of the American Society for Information Science and Technology 63(1):163–173
- Tran et al (2015) Tran TA, Niederée C, Kanhabua N, Gadiraju U, Anand A (2015) Balancing novelty and salience: Adaptive learning to rank entities for timeline summarization of high-impact events. In: Proceedings of the 24th ACM International on Conference on Information and Knowledge Management, ACM, pp 1201–1210
- Weikum et al (2011) Weikum G, Spaniol M, Ntarmos N, Triantafillou P, Benczúr A, Kirkpatrick S, Rigaux P, Williamson M (2011) Longitudinal Analytics on Web Archive Data: It’s About Time! In: CIDR
- Yao et al (2016) Yao Jg, Fan F, Zhao WX, Wan X, Chang E, Xiao J (2016) Tweet timeline generation with determinantal point processes. In: AAAI
- Yu and Kak (2012) Yu S, Kak S (2012) A survey of prediction using social media. arXiv preprint arXiv:12031647
- Zhang et al (2016) Zhang L, Rettinger A, Zhang J (2016) A probabilistic model for time-aware entity recommendation. In: International Semantic Web Conference, Springer, pp 598–614
- Zhao et al (2013) Zhao XW, Guo Y, Yan R, He Y, Li X (2013) Timeline generation with social attention. In: SIGIR
- Zimmer (2015) Zimmer M (2015) The Twitter Archive at the Library of Congress: Challenges for information practice and information policy. First Monday 20(7)