2018/07/20\Accepted2018/10/23
surveys – circumstellar matter – stars: mass-loss – stars: AGB and post-AGB – infrared: stars
AKARI Mission Program: Excavating Mass Loss History in Extended Dust Shells of Evolved Stars (MLHES) I. Far-IR Photometry111Based on observations with AKARI, a JAXA project with the participation of ESA.
Abstract
We performed a far-IR imaging survey of the circumstellar dust shells of 144 evolved stars as a mission programme of the AKARI infrared astronomical satellite using the Far-Infrared Surveyor (FIS) instrument. With this survey, we deliver far-IR surface brightness distributions of roughly 10′ 40′ or 10′ 20′ areas of the sky around the target evolved stars in the four FIS bands at 65, 90, 140, and 160 . Our objectives are to characterize the far-IR surface brightness distributions of the cold dust component in the circumstellar dust shells, from which we derive the amount of cold dust grains as low as 20 K and empirically establish the history of the early mass loss history. In this first installment of the series, we introduce the project and its aims, describe the observations, data reduction, and surface brightness correction process, and present the entire data set along with the results of integrated photometry measurements (i.e., the central source and circumstellar dust shell altogether). We find that (1) far-IR emission is detected from all but one object at the spatial resolution about 30′′ - 50′′ in the corresponding bands, (2) roughly 60 – 70 % of the target sources show some extension, (3) previously unresolved nearby objects in the far-IR are now resolved around 28 target sources, (4) the results of photometry measurements are reasonable with respect to the entries in the AKARI/FIS Bright Source Catalogue, despite the fact that the targets are assumed to be point-sources when catalogue flux densities were computed, and (5) an IR two-color diagram would place the target sources in a roughly linear distribution that may correlate with the age of the circumstellar dust shell and can potentially be used to identify which targets are more extended than others.
1 Introduction
Low to intermediate initial mass stars (of 0.8–8 M⊙) experience copious mass loss at the rate of to M⊙ yr-1 in the late stages of evolution, especially during the asymptotic giant branch (AGB) phase (cf., [Herwig (2005)], [Iben (2012)], [Karakas & Lattanzio (2014)]). This stellar mass loss is expected to be induced by specific physical conditions at the stellar surface as a consequence of the internal evolution, while the course of the internal evolution is thought to be influenced by this mass loss that impacts the physical conditions at the stellar surface. For example, mass loss may show temporal variations because of the alternative burning of hydrogen and helium in distinct layers via a mechanism called “thermal pulses” (Paczyński, 1971) during the AGB phase, while a sudden, drastic increase of mass loss – the so-called “superwind” (Renzini, 1981) – near the end of the AGB phase can remove a significant portion of the surface layer from the star, forcing the star to terminate the AGB evolution. The AGB mass loss, therefore, determines the fate of AGB stars by controlling the highest luminosity that they can attain and duration of the AGB phase, which would proportionally increase the lower limit of the zero-age main-sequence (ZAMS) mass that results in a supernova (c.f., Weidemann (1990)). However, no theoretical description of mass loss has ever been derived fully from first principles, despite that identifying the exact mechanisms of mass loss in these cool stars has been and still is a long-standing problem in the stellar evolution.
During the AGB phase, mass-loss ejecta from the central star form a circumstellar dust shell (CDS)222Indeed, a unique set of information, especially on the velocity and chemistry, of the mass-loss history can be derived from the gas component of the circumstellar gas shells (CGS). Readers who are also interested in following the latest developments in the investigation of the gas component of the AGB circumstellar shells are encouraged to refer to recent reviews such as the one by Höfner & Olofsson (2018).. When mass loss is terminated at the end of the AGB phase, the CDS becomes physically detached from the central star and starts to drift away. At this point, the newly-formed post-AGB CDSs appear to have already developed largely axisymmetric structures (cf., Meixner et al. (1999); Ueta et al. (2000); Meixner et al. (2002); Sahai et al. (2007); Siódmiak et al. (2008)). Thus, the AGB mass loss affects not only the internal evolution but also the external evolution. While an ample amount of effort was made to confirm that the post-AGB CDSs do possess at least some axisymmetric structure, still lacking is the direct observational evidence for the structure development in the AGB CDSs. In particular, the temporal evolution of the CDS structure development needs to be constrained by observations. Hence, a thorough observational study of the AGB CDSs must be done to understand the earlier AGB mass loss history pertaining to the CDS structure formation.
To follow the early AGB mass loss history observationally, one must employ far-IR thermal emission arising from the colder dust grains in the outermost regions of the CDSs as a primary tracer. While there is also molecular gas emission in the inner regions of the CDSs, molecules tend to be photo-dissociated by the interstellar radiation field (ISRF) in the outermost parts of the CDSs (e.g., Meixner et al. (1998)). The presence of the ISRF does a favor for our purposes: (1) the ISRF would warm up dust grains in the outermost regions of the CDS at about K (e.g., Gillett et al. (1986); Young et al. (1993a)), and hence, would enhance, however slightly, the detectability of the CDSs in the far-IR, and (2) the CDSs are likely more extended than the molecular shells because of photo-dissociation by the ISRF, and possibly, by dust/gas drift. Thus, dust grains in these regions would not suffer from cooling by molecules.
Here, we present the far-IR imaging survey of evolved star CDSs at various evolutionary stages from the tip of the first giant branch to the planetary nebula (PN) phase including AGB and post-AGB phases, conducted using the AKARI infrared (IR) astronomical satellite and the Far-IR Surveyor (FIS) instrument. Our primary goals of this survey are to (1) detect far-IR emission from cold dust grains that reside in the CDSs of evolved stars, (2) perform photometry of the detected sources, and (3) establish the density distribution in the CDSs from the detected far-IR surface brightness distributions for the CDSs without the influence of the central star and reconstruct the AGB mass loss history in detail, and (3) quantify parameters concerning the AGB mass loss and CDS structures. In this first installment of the series, we introduce the project, describe the observations, data reduction, and surface brightness correction process, and present far-IR images for the entire sample of 144 targets along with the results of integrated photometry measurements made for the entire object (i.e., the central star and CDS altogether). Separation of the CDS and stellar emission via PSF removal and subsequent characterization of the CDS emission will be dealt with in the second installment of the series (Torres et al. in preparation).
2 Previous Far-IR Studies of the Evolved Star CDSs
The existence of very extended CDSs was originally recognized by individual spatial investigations by, for example, Hacking et al. (1985), Gillett et al. (1986), and Stencel et al. (1988), using IRAS (Neugebauer et al., 1984). Alternatively, Willems & de Jong (1988) and Chan & Kwok (1988) indicated the presence of the detached CDSs to explain the distribution of cool evolved stars on the IRAS 12-25-60 two-color diagram. Meanwhile, Young et al. (1993a) and Young et al. (1993b) were the first to fully exploit the potential of IRAS survey scan data in the far-IR, fitting the scan data passing over a target object by a simple CDS model. However, due to insufficient spatial resolutions, it was not possible to examine the internal structures of the extended CDSs around evolved stars until later when an advanced image processing technique was introduced (e.g., Waters et al. (1994); Izumiura et al. (1997); Hashimoto et al. (1998)). Also, IRAS was not quite suited to probe the coldest dust emission from the evolved star CDSs as its reddest band was 100 . Then, ISO (Kessler et al., 1996) was used to observe a small sample (about 10) of evolved stars. Despite ISO’s small sky coverage and large pixels, extended CDSs were detected and their structures were studied for both O-rich and C-rich AGB stars (e.g., Izumiura et al. (1996); Hashimoto & Izumiura (1998)).
Although observations made with IRAS and ISO were successful, observational evidence was still lacking if we strive for the level of understanding that would allow more detailed characterization of mass loss and CDS structure formation during the AGB phase and beyond. In particular, detector sensitivities had to be improved to detect much weaker thermal dust emission, which may arise from a weakly mass-losing stars or the outermost regions of very extended CDSs. The former is necessary to learn mass loss experienced by lower progenitor-mass stars, while the latter is essential to investigate even earlier phases of mass loss.
At the turn of the 21st century, there was a renaissance of far-IR astronomy with the coming of the next generation of space telescopes launched successively – the Spitzer Space Telescope (Spitzer; Werner et al. (2004)) in 2003 by the National Aeronautics and Space Administration, the AKARI IR astronomical satellite (AKARI; Murakami et al. (2007)) in 2006 by the Institute of Space and Aeronautical Science (ISAS) of the Japan Aerospace Exploration Agency (JAXA), and the Herschel Space Observatory (Herschel; Pilbratt et al. (2010)) in 2009 by the European Space Agency. These new opportunities permitted us to probe CDSs at better sensitivities and spatial resolution than the preceding studies with IRAS and ISO.
However, observations of the extended CDS around evolved stars by Spitzer was met by a surprise. The bow-shock-like interface structure between the CDS and the interstellar medium (ISM) of radius was detected in the far-IR around the AGB star, R Hya (Ueta et al., 2006), as part of the MIPS IR Imaging of AGB Dust shells (MIRIAD; PI: A. K. Speck) program. The detected structure was very much similar to the one found around Betelgeuse and other high-mass stars found earlier by IRAS, albeit smaller (Stencel et al., 1988; Noriega-Crespo et al., 1997). It was a surprise because the CDS-ISM interface structure was not expected around AGB stars, simply because the stellar wind velocity of AGB stars (of km s-1) was in general considered too low to cause shocks and active interactions at the CDS-ISM interface. As it turned out, what matters was the relative velocity of the stellar wind with respect to the local ISM. Hence, the CDS-ISM interactions can happen even for AGB stars if there is sufficient relative motion between the star and the local ISM (Ueta, 2011). In fact, Herschel followed suit to discover the CDS-ISM interface structures in the far-IR in a significant fraction of the AGB stars and red supergiants in the sample (50 out of 78, or 63 %; Cox et al. (2012)) observed as part of the Mass-loss of Evolved StarS (MESS; PI: M. A. T. Groenewegen) guaranteed time key program (Groenewegen et al., 2011).
Meanwhile, a number of programs were executed to address the issue of AGB mass loss by probing the CDS density distributions in the far-IR, aiming to capture the onset of the axisymmetric structure development. Besides MIRIAD and MESS mentioned above, these programs include, COASTING (PI: M. Morris; Do et al. (2007)), and Spitzer-MLHES (PI: T. Ueta; Ueta et al. (2010)) with Spitzer, MLHES (PI: I. Yamamura; Ueta et al. (2007); Izumiura et al. (2009)), and FISPN (PI: P. García-Lario; Cox et al. (2011)) with AKARI, and HerPlaNS (Herschel Planetary Nebula Survey; PI: T. Ueta; Ueta et al. (2017); Otsuka et al. (2017)) with Herschel.
Unfortunately, mapping extended CDSs with Spitzer turned out to be challenging because (1) a significant portion of the MIPS 70 and 160 arrays were lost during launch and (2) the central star had to be avoided to prevent the MIPS 24 array from saturating (even when the 24 data were not needed). Nevertheless, both of the MIRIAD and Spitzer-MLHES programs yielded a certain amount of results: besides the R Hya discovery of the CDS-ISM interface (Ueta et al., 2006), another peculiar CDS-ISM interface case of R Cas was studied (Ueta et al., 2010). However, because Spitzer CDS maps usually lack the central region, the latest mass loss history cannot be learned effectively from these maps.
The MESS program was a major survey of the evolved star CDSs with Herschel. The power of its unprecedented spatial resolution was seen from the detection of wakes due to instabilities in the CDS-ISM interface structures around X Her and TX Psc (Jorissen et al., 2011) and the CDS-ISM interface structure around Betelgeuse resolved into three separate arcs (Decin et al., 2012), besides the discovery of a number of CDS-ISM interaction cases (Cox et al., 2012). As for more genuine CDS cases, Kerschbaum et al. (2010) detected a detached circular CDS almost coincident with the previously known CO circular shell around AQ And, U Ant, and TT Cyg. Moreover, following the discovery of the spiral structures due to mass loss modulations of the central binary system in CO (Maercker et al., 2012), Mayer et al. (2013, 2014) found internal spiral structures in the far-IR CDS characteristic to mass loss modulations of the central binary system.
Some of the AKARI maps were also already presented in the context of the CDS-ISM interface structure (Ueta et al., 2008, 2010). Izumiura et al. (2011) revealed a detached CDS after removing the point-spread function (PSF) effects due to the central star by subtracting a scaled image of a reference point source and interpreted the deduced radial profiles as caused by (1) the temporal enhancement of mass loss due to thermal pulse and the subsequent two-wind interactions or (2) the reverse/termination shock of the stellar wind bounced back from the CDS-ISM interface. While the former scenario was likely and preferred, the latter scenario was not completely refuted by the presence of the cometary tail structure seen (Fig. 8 in Izumiura et al. (2011)) and the marginal image quality at the preliminary stage of the data reduction.
3 Observations
3.1 AKARI Infrared Astronomical Satellite
AKARI (formerly ASTRO-F) was the Japanese IR space mission launched on 2006 February 21 (UT). The mission goals of AKARI are to (1) perform a high spatial resolution all-sky survey in six IR bands from 9 to 160 , and (2) conduct pointed observations of specific targets to obtain deeper images and spectroscopic data from 2 to 180 . AKARI carried out its 550-day cryogenic mission until it exhausted its liquid helium on 2007 August 26, and continued its post-cryogenic mission in the near-IR until the satellite was finally turned off on 2011 November 24.
The Far-IR Surveyor (FIS: Kawada et al. (2007)) was one of the two instruments on-board AKARI, covering the wavelength range of 50 to 180 with two sets of Ge:Ga arrays, the Short Wavelength (SW) detector in the N60 (50–80 m, the reference wavelength m) and WIDE-S (60–110 m, m) bands (Fujiwara et al., 2003) and the Long Wavelength (LW) detector in the WIDE-L (110–180 m, m) and N160 (140–180 m, m) bands (Doi et al., 2002). During all-sky survey observations, the sky was swept at s-1 covering more than 98% of the entire sky (the all-sky scan mode; Doi et al. (2015); Takita et al. (2015)). During pointed observations, on the other hand, intended targets were scanned about slower at 8 or 15′′ s-1 to achieve one to two orders of magnitude better sensitivity than the all-sky survey observations (the slow-scan mode; Shirahata et al. (2009)).
As we will demonstrate below, AKARI slow-scan maps achieve the 1- sensitivity of less than 1 MJy sr-1, thanks to the slow scan-mapping speed, its cooled mirror, and the marginal spatial resolution (as opposed to Herschel maps that went as deep as MJy sr-1 1- sensitivities; cf. Groenewegen et al. (2011); Ueta et al. (2014)). Hence, AKARI CDS maps are by far the most sensitive far-IR images of evolved star CDSs ever produced.
3.2 Observing Strategy
Our primary aim is to establish the AGB mass loss history observationally to enhance our understanding of mass loss and the CDS structure formation. To trace the history of AGB mass loss over the last years, it is necessary to examine the CDS out to 1.5 pc from the central star assuming the shell expansion velocity of 15 km s-1. This means that the apparent size of the CDSs is on the order of at typical distances of evolved stars ( kpc). Meanwhile, we also need to cover the sufficient amount of blank sky to assure reliable background subtraction for the clear detection of CDSs. Furthermore, we must examine the CDS structures in 2-D maps to distinguish between a real extension of dust emission and a local cirrus that mimics a dust shell in a 1-D scan. 2-D mapping is also important to study non-spherical morphologies expected in the CDSs around AGB and post-AGB stars. Therefore, the use of 2-D mapping in our investigation is essential, and thus, we employ the Astronomical Observation Template (AOT) FIS01, which is designed for photometry observations of compact sources in the slow-scan mode, to make scan maps of (width length) typically in the SW bands.
This AOT performs two round-trip scans along the in-scan direction in the vicinity of the target source during the 10 min window of pointed observation in the 90-min sun-synchronous orbit. Between two round-trip scans, there is a small offset along the cross-scan direction to secure coverage of the target source by different detector elements. In the end, this AOT provides four independent redundant scans of the target to be combined into a single map, assuring the reliability of the resulting map. For the actual execution of the AOT, we use a reset interval of 0.5, 1.0, or 2.0 sec, the scan speed of 8 or 15′′ s-1, and the cross-scan offset of 70 or 240′′ depending on the expected surface brightness and size of the target.
3.3 Target Selection
Our understanding of mass loss and the CDS structure formation can only be enhanced by collecting data from a large number of sources at various evolutionary stages (i.e., at the AGB, post-AGB/proto-PN, and PN phases), of different pulsation types (i.e., of Lb, SR, and Mira), and of different chemical types (i.e., C-, M-, and S-type). For the AKARI MLHES mission program, we establish first a volume limited sample of evolved stars before the launch of AKARI by the following procedure:
- AGB stars
-
1) we extract known Lb, SR(a,b,c), and Mira type variables from the IRAS point source catalog, 2) we calculate the bolometric flux for each source using the 12 flux density and a bolometric correction based on the mid-IR color by , 3) we estimate the distance to these sources by assuming a bolometric luminosity of 2,500 L⊙ for all sources and extract those closer than 500 pc. Note that the luminosity is set conservatively somewhat smaller than the average value of 3,000 L⊙ for AGB stars (e.g., 2,600 L⊙ by Habing et al. (1985); 3,000 L⊙ by Knauer et al. (2001); 3,500 L⊙ by Jackson et al. (2002)).
- OH/IR stars
-
1) we extract IRAS point sources which have mid-IR colors typical for OH/IR stars, 2) we calculate the bolometric flux for each source using the 12 flux density and a bolometric correction based on the mid-IR color, 3) we estimate the distance to these sources by assuming a bolometric luminosity of 5,500 L⊙ for all sources and extract those closer than 1,000 pc. Note that the distance limit for OH/IR stars is larger because the space density of OH/IR stars is very low and we do not find any of them within 500 pc.
- Post-AGB stars/Proto-PNe
- PNe
- Extended Sources
-
We also include evolved objects which were previously found to be extended in the IRAS/ISO far-IR bands in the literature.
We then check the AKARI visibility of the selected targets and exclude those with low visibilities. Among the resulting sample, we give the highest priority to those that (1) show extension in the previous IRAS survey scan data (e.g., Young et al. (1993a, b)), (2) are reported to possess an extended CDS in the ISO studies (e.g., Izumiura et al. (1996); Hashimoto & Izumiura (1998)), and (3) are found to be extended in our unpublished studies using the High Resolution IRAS images and ADDSCAN data. We also take into account the critical observing conditions/constraints such as saturation, sensitivity, map size, and detection reliability. Sources located in high far-IR background regions are removed from the target list: we set the limiting threshold as 20 MJy sr-1 at 100 . However, the last criterion greatly reduces the number of promising candidates. Last but not least, the target size is practically limited by the fact that we are awarded with 150 pointings, of course.
3.4 Observations
The science operation of AKARI, consisting of large-area survey programs (LSs), mission programs (MPs), and open-time programs (OTs), began on 2006 May 8. The all-sky survey was prioritised during Phase 1, which lasted until 2006 November 10. In addition to the all-sky survey, surveys of the North Ecliptic Pole and Large Magellanic Cloud were conducted as the LS program. Most of the MPs and OTs, including our observations, were executed during Phase 2, which followed Phase 1 and continued until the end of AKARI’s cold campaign. In the end, 149 pointed observations are made by AKARI under the MLHES MP between 2006 September 9 and 2007 August 20, of which 144 are FIS scans in the far-IR and five are IRC mapping in the mid-IR. Some of the IRC maps have already been presented (Arimatsu et al., 2011). Table AKARI Mission Program: Excavating Mass Loss History in Extended Dust Shells of Evolved Stars (MLHES) I. Far-IR Photometry111Based on observations with AKARI, a JAXA project with the participation of ESA. summarizes the 144 FIS targets and their basic characteristics, together with a log of observations including target name (usually the target’s IRAS designation), alternative/more common name, equatorial coordinates (J2000), Simbad object type, variability type, spectral type, date of observations, time of observations, observation ID (a unique number to specify an AKARI data set), and AOT parameters.
4 Data Reduction
The AKARI/FIS slow-scan mapping data are archived in the Data ARchives and Transmission System (DARTS) maintained by ISAS/JAXA333http://darts.isas.jaxa.jp/astro/akari/ in the time-series data (TSD) format. After the archived TSD sets are downloaded from DARTS, they need to be processed into co-added far-IR maps with a map-making tool. We employ the second-generation data reduction package, FIS AKARI Slow-scan Tool (FAST: Ikeda (2012); also briefly described by Ueta et al. (2017)). While FAST is similar to the first-generation data reduction package, FIS Slow-Scan data analysis Toolkit (SS-Tool: Matsuura et al. (2007)), FAST can perform superior glitch and calibration lamp after-effect removal (Suzuki et al., 2008).
During the AOT FIS01 scan sequence in orbit, calibration measurements are taken five times before and after each of the four parallel scan legs with the shutter closed (Kawada et al., 2007). The dark current and calibration lamp signals are monitored during each of these five calibration exposures to follow the time-varying instrument responsivity. On the other hand, self flat-field measurements, in which a flat frame is constructed to correct for the pixel-to-pixel detector responsivity variations, are made with the shutter opened by exposing the detector to the “flat” sky during the calibration sequences at the beginning and end of the entire scan sequence (pre-cal and post-cal) while the telescope transitions between the all-sky survey mode and the slow-scan pointed observation mode (Matsuura et al., 2007).
While SS-Tool is set to use all of the dark subtraction, detector responsivity time variation correction, and the pre-cal flat-fielding, FAST allows users to determine whether or not particular calibration measurements are used in the data processing with the help of the GUI, which visualizes the calibration measurements in the TSD. This flexible selection of calibration measurements with FAST greatly enhances the effectiveness of the corrections and improves the resulting data quality. This is especially true because it is now possible to discard calibration data that are compromised by anomalies. These improvements available in FAST results in cleaner final co-added maps than those made by SS-Tool.
Yet another difference between SS-Tool and FAST is how photon energy is assumed to be distributed over the FIS arrays for each photon hit in respective map-making processes. With SS-Tool, photon energy is always distributed uniformly within the pre-determined beam size (i.e., a boxcar/pillbox function) of and for the SW and LW band, respectively. With FAST, however, a variety of gridding convolution functions such as Gaussian and sinc functions are available to users (Ikeda, 2012). For the present work, we opt to adopt a Gaussian gridding convolution function (GCF) that would mimic the Airy disk of 33′′ and 51′′ at 90 and 140 m, respectively. These parameters are chosen because they would reproduce the diffraction limit at the respective wavelengths in the resulting maps. Our particular parameter choices are different from those made by Ueta et al. (2017), and therefore, would inevitably result in slightly different PSF shapes. Hence, we need to derive our own surface brightness correction factors (see the next section; also see Appendix A).
We thus take advantage of the improved capability of FAST to optimize calibration and angular resolution of the resulting co-added maps. In the final map-making, we orient the resulting images to align with the scan direction (i.e., the image -direction is parallel to the scan direction; also see Figure 3 of Kawada et al. (2007)) and use the following options: Earth-shine/stray-light removal, 200 s median filtering, 5- clipping, and GCF corresponding to the Airy disk of 33′′ and 51′′ at 90 and 140 m. The resulting FAST co-added maps are produced at the pixel scale of 8′′ pix-1 (corresponding to roughly 1/4 to 1/6 of the angular resolution).
5 Surface Brightness Correction
The absolute surface brightness calibration of the FIS instrument was done through (1) pre-launch laboratory measurements of a blackbody source which indicated a 5 % accuracy, and (2) in-orbit comparisons between measurements of IR cirrus regions without significant small-scale structures made by FIS and the DIRBE instrument on board the COBE satellite (Matsuura et al., 2011). Hence, the FIS data (both all-sky and slow-scan data) presently archived should give correct surface brightnesses of diffuse background emission. However, when aperture photometry was performed for a set of IR flux standard stars detected in the COBE/DIRBE-calibrated FIS slow-scan maps (processed by SS-Tool), the resulting fluxes came out to be roughly 40 % less than expected (Shirahata et al., 2009). This apparent flux underestimates were attributed to the slow transient response of the Ge:Ga detectors (e.g., Kaneda et al. (2002)).
To alleviate this issue, Shirahata et al. (2009) devised a method of flux correction for point sources detected in the AKARI/FIS slow-scan maps processed by SS-Tool. This point-source flux correction method is based on the the premise that the shape of the PSF is well-defined and invariant with the source flux. This point-source flux correction method works because flux within an idealized infinite aperture can always be recovered by scaling the flux measured within a finite aperture (which corresponds to a part of the bright PSF core) by an appropriate aperture correction factor. However, such a correction method would not work in general for objects that are neither point-like nor diffuse (i.e., marginally extended, such as CDSs), because the surface brightness distribution of such an object is not known a priori (and hence the aperture correction factor cannot be uniquely determined).
Ueta et al. (2017) established a general procedure to correct directly the far-IR surface brightness distribution of AKARI/FIS slow-scan maps generated by SS-Tool or FAST. This procedure is based on the empirical power-law FIS detector response function, , which is defined to be
| (1) |
where is the measured surface brightness distribution in the archived, uncorrected FIS map, is the “true” surface brightness distribution of the mapped region of the sky in the far-IR, and are, respectively, the power-law index and the scaling coefficient of the adopted power-law FIS response function, and and refer to the pixel position in the FIS map.
This FIS response function was determined to possess a power-law form given the observed scale-invariant characteristics of slow-scan maps (i.e., PSF shapes remain the same irrespective of the PSF brightness). With this formulation, one can recover the true far-IR surface brightness distribution of the sky falling onto the FIS detectors via the inverse function, , via
| (2) |
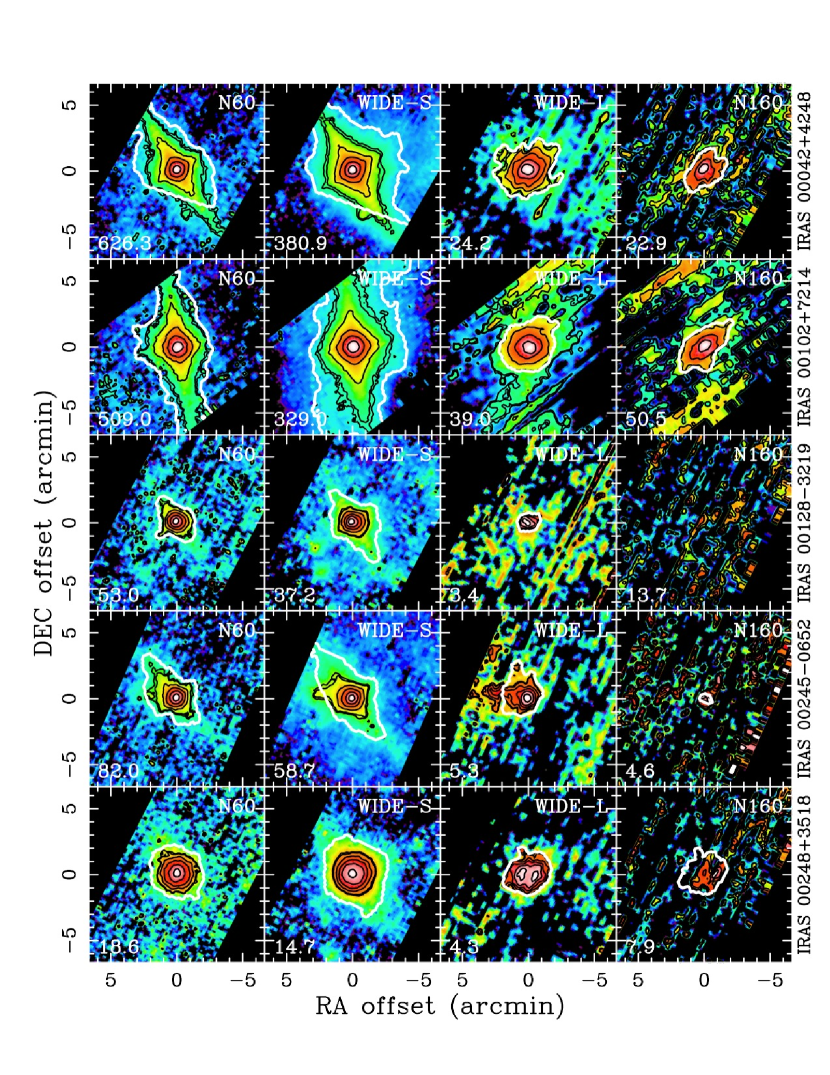
with the appropriately-determined and power-law scaling parameters. The and parameters adopted in the present work are listed in Table AKARI Mission Program: Excavating Mass Loss History in Extended Dust Shells of Evolved Stars (MLHES) I. Far-IR Photometry111Based on observations with AKARI, a JAXA project with the participation of ESA.. These parameters are slightly different from those previously determined by Ueta et al. (2017), because, as stated in the previous section, we opt to adopt specific GCF parameters to optimize the resulting PSF shape. The derivation of the present and values is outlined in Appendix A in detail. The resulting surface-brightness-corrected AKARI/FIS maps of the MLHES target sources are exhibited in Figure 1 and Supplementary Figures 1 through 28 444Supplementary Figures 1 through 28 are available only in the on-line version..
6 Photometry
After AKARI/FIS maps of the MLHES target sources are processed and their surface brightnesses are corrected as described in the previous sections, we measure the total flux density for each target source in each of the four AKARI/FIS band using the following three-step procedure, scripted with Python aided by the Astropy package.
Step 1: We determine the first-pass sky surface brightness, , and its uncertainty, , by taking the median and standard deviation of the entire FIS map, respectively, using 3- clipping. We then define the extent of the target source by adopting a region-growth algorithm. With this algorithm, a given region starting with the seed pixel at the target coordinates is grown by finding and incorporating all pixels that are connected neighbors to the region pixels as long as their pixel surface brightness value registers greater than the tentative sky value by 2 or more (i.e., )).
Step 2: We then establish the sky regions adjacent to the grown target region in the surface brightness map (i.e., fore and aft directions along the scan path) to determine the second-pass and by taking the median and standard deviation of the pixels within the sky regions using 3- clipping. With the re-determined and , we use the region-growth algorithm again to re-define the extent of the target source. The source region is grown to include all connected pixels registering greater than the updated sky value by 2 or more. The adopted 2 threshold is chosen from comparisons among 1, 1.5, 2, 2.5, and 3 to find the optimum level that would recover the faintest surface brightness of the target sources while not including spurious emission from the sky or nearby sources.
This iteration is intended to make sure that the extent of the target source comes as low in the surface brightness as possible and that the sky regions do not overlap with the derived extent of target source. For this region-grow method to work, however, the target sources are assumed to have a single emission peak at the target position with their surface brightness distributions in general radially decreasing monotonically. This assumption, however, is not always true because the surface brightness distribution can vary considerably when the circumstellar shell possesses noticeable structures. Thus, we also visually inspect the results of the second-pass region-grow algorithm to check especially if real structures are missed or spurious structures are included. There are indeed cases where (1) what appears to be a nearby source is present in the immediate vicinity of the target (e.g., I00042555From here, we refer to our targets by the abbreviated IRAS designation, an “I” followed by the first 5 digits of the IRAS designation, or alternative name when there is no IRAS designation., I00245, I04020, I16011, I21197, I21440, and I27173), and (2) the target object is confused by the strong large-scale background emission (e.g., I3062 and I21419). These cases are handled on an individual basis by manually modifying the photometry boundary to exclude confused parts. In general, nearby sources are deemed real when they appear in more than one consecutive bands and/or exhibit different emission characteristics than the target source itself (i.e., the way the brightness varies across bands is dissimilar).
Also, there are cases where the background is too noisy to define a reasonable boundary at the adopted 2 threshold. In such cases, the target sources may not be automatically recognized even though they may appear obvious to human eyes. If that is the case, we adopt the boundary determined at the waveband of the best data quality (typically the waveband of the shortest wavelength where the boundary was algorithmically determined; i.e., the WIDE-L boundary is adopted for the N160 band, and the WIDE-S boundary is adopted for the WIDE-L and N160 bands). At any rate, whenever we adopt the photometry boundary that is not algorithmically determined (i.e., there is some manual intervention), it is noted in Table AKARI Mission Program: Excavating Mass Loss History in Extended Dust Shells of Evolved Stars (MLHES) I. Far-IR Photometry111Based on observations with AKARI, a JAXA project with the participation of ESA.. These manual modifications of the photometry boundary typicaly introduce a difference of at most a few % (nearby source cases) to a few tens of % (background confusion cases).
Step 3: We then compute the flux density of the target source and its uncertainty using the following formulae:
| (3) | |||||
| (4) | |||||
where img is the re-calibrated surface brightness map and err is the associated uncertainty map, and are the number of pixels within the extent of the target object (“obj”) and of the corresponding sky region (“sky”), respectively, and is the standard deviation in the sky regions. The second-pass sky regions immediately before and after the second-pass grown target source region are referred to as the sky regions (“sky”), while the second-pass grown target source region itself is referred to as the target object region (“obj”). Similarly, the corresponding regions in the associated error map are referred to as in the same way (as the “sky” and “obj”), respectively. The err term corresponds solely to the uncertainties of the detector signal per sampling, while is the fluctuation of the observed sky emission (i.e., confusion noise and uncertainties of the detector signal per sampling): the term is often a significant component in the far-IR.
The second term of eqn (3) subtracts the sky contribution in the target area. The first term in eqn (4) is a mixture of the photon shot noise due to signals from the target, photon shot noise due to sky emission, readout noise, dark current noise, and uncertainties in flatfielding. The third term in eqn (4) refers to the uncertainty that arises in the target region due to sky fluctuation (i.e., the photon shot noise due to sky emission, confusion noise, readout noise, dark current noise, and uncertainties in flatfielding, assuming that similar sky fluctuation continues into the target region). Finally, the fourth term in eqn (4) is the uncertainty due to sky subtraction. Thus, we are actually double-counting the photon shot noise due to sky emission, readout noise, dark current noise, and uncertainties in flatfielding. Hence, the second term in eqn (4) is included to compensate for those doubly-added noise terms. In addition, surface brightnesses of the re-calibrated map and its associated uncertainty map are converted from the native MJy sr-1 to Jy pix-1 units given the adopted pixel scale at 8′′ pix-1 to yield flux densities in the end.
The measured flux densities of the MLHES target sources in the four AKARI far-IR bands are presented in Table AKARI Mission Program: Excavating Mass Loss History in Extended Dust Shells of Evolved Stars (MLHES) I. Far-IR Photometry111Based on observations with AKARI, a JAXA project with the participation of ESA.. The listed flux densities are expressed in scientific notation, , where is the absolute value and is the power index of base ten, i.e., . Here, readers are reminded that these flux densities are the sum of the flux densities from the central star and the CDS. In this list, we also note if the photometry aperture boundary set by the procedure outlined above is manually adjusted (e.g., a nearby object needs to be removed) or adopted from a shorter waveband (e.g., the sky is too noisy to define a decent aperture in the present band).
In addition, we also present the far-IR sky surface brightnesses and their uncertainties at the positions of the MLHES target sources (Table AKARI Mission Program: Excavating Mass Loss History in Extended Dust Shells of Evolved Stars (MLHES) I. Far-IR Photometry111Based on observations with AKARI, a JAXA project with the participation of ESA.). These sky values are computed by taking the median and standard deviation of the sky-only maps, which are created by taking the difference between the surface-brightness-corrected FIS maps with the median-filter on (i.e., the sky emission is subtracted from the map) and off (i.e., the sky emission remains in the map).
7 Discussion
7.1 AKARI/FIS Images of Evolved Star CDSs
One of the main objectives of the present investigation is to understand the history of AGB mass loss via the far-IR surface brightness distribution of the cold dust component in the evolved star CDSs. This is because the CDSs are the direct consequences of mass loss. Upon quickly inspecting the resulting AKARI/FIS images (Figure 1 and Supplementary Figures LABEL:F:map2 through LABEL:F:map29), we immediately notice that the central star is in general still the dominant emission source even at these far-IR wavelengths. This is especially true in the SW bands, and quite often so even in the WIDE-L band. Nevertheless, we find many sources with a faint extended CDS.
While we leave detailed analyses into the CDS structures to the next installment of the present series, we briefly comment on the general characteristics of the CDS structures that we can observe from a quick inspection. Many sources appear to be associated with a round extended CDS, some are very obvious (up to about radius) and others are less so. Such sources, of which a few have been previously presented elsewhere, include I04330, I05524 (Ueta et al., 2008), I10329 (Izumiura et al., 2011), I10350, I10580, I12427, I13462, I15465, I15094, I18537, and I23558 (Ueta et al., 2010).
There are many sources whose emission core appears to be more extended than that of the PSF at varying degrees. These objects can also be identified as those whose internal contours are more widely spaced. Such sources include I01037, I02108, I02522, I03062, I03374, I04361, I05251, I06176, I09452, I10223, I10416, I11385, I12380, I13370 I14003, I14219, I16011, I17028, I19390, I19434, AFGL2688, NGC7027, I21419, I22035, I22196, and I23166. Those showing an especially extended emission core are I00248, I11119, I18517, I19574, and I20120. Some of these sources have been found extended in resolved far-IR images taken by Herschel (e.g., I00248, I10329, and I19390; Kerschbaum et al. (2010)). Many others seem at least marginally extended, and they need more detailed analyses before concluding anything.
Another group of sources that is worth mentioning here is those that show some indications of interactions between the CDS and ISM. Such cases have been detected in the far-IR around evolved stars and suggested to exist rather commonplace (e.g., Ueta et al. (2006, 2010); Ueta (2011); Jorissen et al. (2011); Cox et al. (2012); Mayer et al. (2013, 2014)). Such objects are I03463, I04459, I13001, I16255. I18216, I20038, I21412, I22017, I22272, and I23416.
GK Per is an unusual magnetic cataclysmic variable star that went into a nova in 1901 and the remnant of the outburst is presently seen as a nebula of about 100′′ diameter (Slavin et al., 1995). This system, recently undergoing outbursts roughly every 3 years, exhibited a longer-than-normal outburst in 2006 (Evans et al., 2009). This motivated us to observe this system in the far-IR to see if there is any cold thermal dust emission. However, no appreciable far-IR emission was detected in all four AKARI bands.
Overall, we typically find at least a couple of marginally extended sources in each of the 29 panels of images presented. Thus, about 60-70 % of the observed objects, roughly speaking, appear to exhibit some kind of extension of the CDS in the far-IR. Many extended objects, especially those listed above, appear to be large enough that its inner shell structure is resolved and can be revealed after the effects of the bright central star is suppressed. Hence, careful central star removal will have to be performed to fully assess the nature of the extended CDSs of evolved stars in the far-IR. Such an analysis will be the main topic of the next installment of the present series of papers (Torres et al. in preparation).
7.2 Comparison with the IRAS PSC and AKARI/FIS BSC Entries
One of the main purposes of AKARI is to perform a census of far-IR objects in the whole sky (Yamamura et al., 2009). Hence, there must be corresponding catalog entries for all MLHES sources, as the MLHES targets are essentially selected from the IRAS catalog (i.e., bright enough for AKARI). Thus, as a quick consistency check, we compare the flux densities of the MLHES targets determined by our method with their counterparts in the AKARI/FIS Bright Source Catalog Ver. 2 (BSCv2; Yamamura et al. (2016))666Available via http://www.ir.isas.jaxa.jp/AKARI/Archive/.. We compare only those whose quality flag is 3 (the presence of the source is confirmed and its flux determined to be valid in BSCv2).
Here, we need to remind ourselves that the flux density entries in BSCv2 are measured by yet another independent method, dedicated to produce BSC flux entries with the assumption that the signal is always caused by a point source (Yamamura et al., 2009). Moreover, BSCv2 flux entries are calibrated by a direct comparison with the point-source calibration standard fluxes and not from the surface brightness maps as in our method presented in this work . These differences practically mean that the BSCv2 flux density entries for the MLHES target sources tend to miss contributions from the extended parts of the CDS around the central star. However, the severities of this potential flux density underestimate would depend on the actual appearance of the target sources in the AKARI focal plane. Hence, BSCv2 entries may not always underestimate flux densities of the MLHES sources.
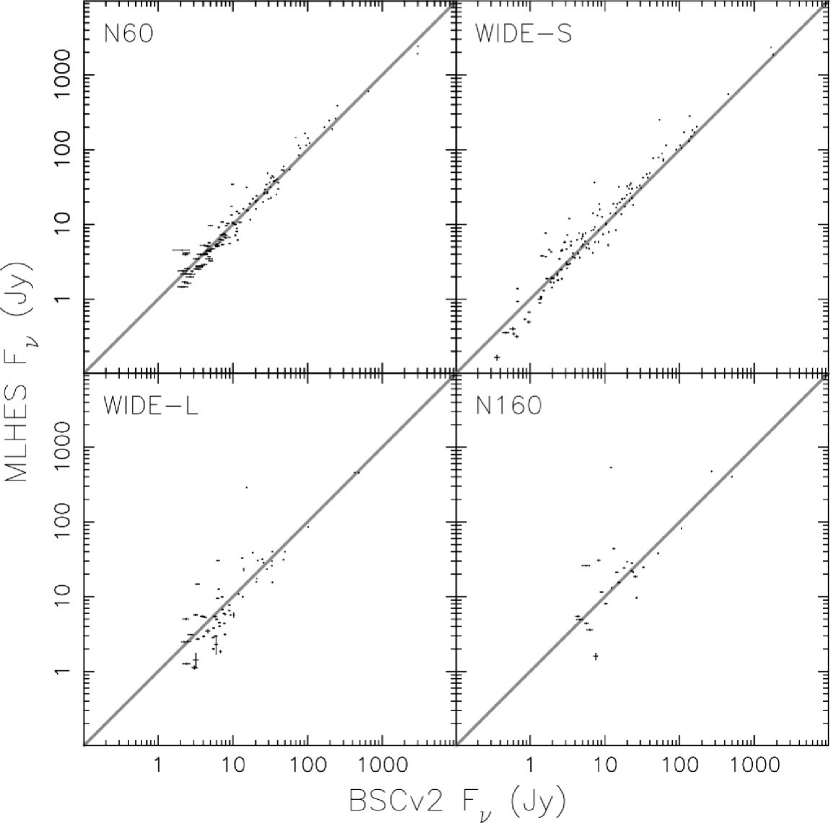
Figure 2 shows the direct comparison between the photometry results of the MLHES targets and their counterparts in BSCv2. In general, our photometry results are consistent with their BSCv2 counterparts, as seen from the distribution of data points that follows the line in gray. However, there is also a relatively large scatter in the distribution of the data points. The width of the scatter is therefore interpreted as the manifestation of this intrinsic difference between the way photometry is done by us and for BSCv2. While there is this subtle difference between our measurements and BSC entries, blind power-law fitting of all the data points yield , , , and , for N60, WIDE-S, WIDE-L, and N160, respectively. The derived power-law indices are indeed fairly close to unity, and hence, we consider that our photometry results are reasonable.
7.3 Far-IR Colors of the Evolved Star CDS
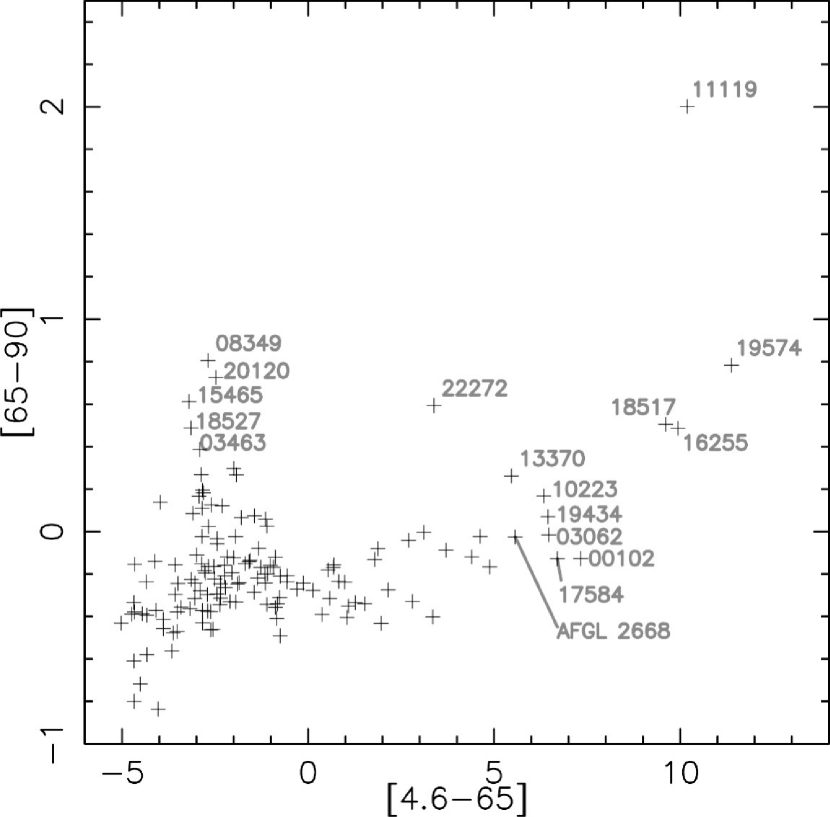
After the IRAS all-sky survey, van der Veen & Habing (1988) proposed that IRAS two-color diagrams can be used to distinguish C- and O-rich CDSs and put these stars align with the evolutionary sequence. Here, we attempt similar exercise with AKARI two-color diagrams. However, no colors based purely on AKARI flux densities yields any informative distribution of source in any AKARI two-color space, because (1) AKARI’s bands are defined over a relatively smaller range of wavelengths and (2) there is a significant overlap between the N60 and WIDE-S bands and the WIDE-L and N160 bands, respectively. Hence, after experimenting with various photometry data in the infrared, we settle with the WISE W2 band (Cutri et al., 2012), because WISE data are among the latest and this band appears least likely to be contaminated by some line emission.
Figure 3 shows the distribution of the MLHES sources in the [65-90] vs. [4.6-65] two-color diagram777The color is defined to be , where and are flux densities in the band a and b, respectively.. Many sources cluster in the region of [65-90] and [4.6-65]. From this clustering of sources in the [65-90]-[4.9-65] color space, it appears that there are two loci, one horizontal and one vertical, along which other sources are found. In Figure 3, sources located along the tips of these loci are identified. Interestingly, sources at the tip of the horizontal locus (i.e., those with redder [4.6-65] colors) are found to be exclusively PNe, while those at the tip of the vertical locus (i.e., those with redder [65-90] colors) are AGB stars already associated with extended CDSs.
The [65-90] color essentially determines where the dust emission peak is in the spectral energy distribution. That is, if the dust emission peaks at the blueward of 65 m the color is blue (negative), at around m the color is gray (around zero), and the redward of 90 m the color is red (positive). Meanwhile, the [4.6-65] color compares the relative strength between the stellar emission and the dust emission. While the CDS is being developed during the mass-losing phase the [4.6-65] color is still quite blue, because the flux at 4.6 m from the cold central star is strong. However, when the CDS is fully developed the [4.6-65] color would be reddened, because the flux at 90 m from the CDS is now full-fledged. Hence, this two-color diagram allows us to determine which sources are likely to have an extended CDS and perform central source subtraction in characterizing further the intrinsic CDS structures for the second installment of the series.
7.4 Newly Resolved Sources
AKARI’s spatial resolutions are superior with respect to those previously achieved by IRAS and ISO. Indeed, we find 29 instances in 28 targets in which another source is resolved in the immediate vicinity of the MLHES target sources (within the FoV shown; two nearby sources are found in one case). These newly-resolved nearby sources are most likely blended with the target sources themselves when previously observed with IRAS and/or ISO. Most of these newly resolved sources are point sources and fainter than the main target source. However, in a few cases the newly found sources are almost comparable to the main target in brightness. Furthermore, there are several cases in which these nearby sources appear extended (sometimes more than the main target).
Such newly resolved sources are summarized in Table AKARI Mission Program: Excavating Mass Loss History in Extended Dust Shells of Evolved Stars (MLHES) I. Far-IR Photometry111Based on observations with AKARI, a JAXA project with the participation of ESA., with their coordinates, photometry results, and their nature. We use the Simbad database888http://simbad.u-strasbg.fr/simbad/ to query the AKARI coordinates of these newly resolved sources to see if any of these sources have been recognized previously. When a previously known source is found within the FWHM of the PSF, we associate the AKARI detection to such a source. Out of 29 objects newly resolved by AKARI, 17 are found to have been previously known as identified in Table AKARI Mission Program: Excavating Mass Loss History in Extended Dust Shells of Evolved Stars (MLHES) I. Far-IR Photometry111Based on observations with AKARI, a JAXA project with the participation of ESA.. Of which, 14 are identified to be galaxies, while the rest is simply known as an IR or a radio source. Below, we briefly comment on each of these newly resolved sources.
Those associated with I00042 ( to S), I00245 ( to E), I04020 ( to SW, extended), I04387 ( to NE), I05096 ( to S), I07245 ( to S, the farther of the two), I10323 ( to S), I14567 ( to W), I18527 ( to S, the closer of the two) I21197 ( to NE), I21440 ( to NE, extended), and I23013 ( to N) are previously “unknown” (i.e., no corresponding object found after Simbad queries). Given that the majority of the previously known sources are galaxies, these presently unknown sources are most probably galaxies. However, two of these presently unknown sources are extended: we will investigate their nature in future.
8 Summary
Using the FIS on-board the AKARI IR astronomical satellite, we carried out a far-IR imaging survey of the CDSs of 144 evolved stars as one of the AKARI mission programmes that supplemented the satellite’s all-sky survey observations. With this survey we collected far-IR images of roughly or around the target evolved stars at 65, 90, 140, and 160 (Figure 1 and Supplementary Figures LABEL:F:map2 through LABEL:F:map29).
We detect far-IR emission from all but one object (nova GK Per) at the spatial resolution about . Roughly % of the detected sources are found extended, to be followed up with more rigorous central source subtraction to isolate the CDS, which will be discussed in the second installment of the present series. With AKARI’s better spatial resolution in comparison with the previous IRAS and ISO images, 29 new sources are now resolved separately around 28 target sources in the very vicinity of the targets. About half of the newly-resolved sources (17/29) turn out to be previously known sources, and the majority (14/17) happens to be galaxies. Hence, the majority of previously unknown sources is also expected to be galaxies. However, there are two extended nearby sources that are previously unidentified, and they will be followed up in future.
The results of photometry measurements (Table AKARI Mission Program: Excavating Mass Loss History in Extended Dust Shells of Evolved Stars (MLHES) I. Far-IR Photometry111Based on observations with AKARI, a JAXA project with the participation of ESA.) are reasonable with respect to the entries in the AKARI/FIS BSCv2, despite the fact that the targets are assumed to be point-sources when the BSCv2 catalogue flux densities were computed. We also tabulate the measured far-IR sky surface brightness in MJy sr-1 at the positions of the MLHES targets as a future reference (Table AKARI Mission Program: Excavating Mass Loss History in Extended Dust Shells of Evolved Stars (MLHES) I. Far-IR Photometry111Based on observations with AKARI, a JAXA project with the participation of ESA.). The AKARI-WISE two-color diagram of [65-90] vs. [4.6-65] appears to indicate the progression of the evolution of the CDSs as the CDS becomes more extended and colder (i.e., redder) as time passes. Hence, this two-color diagram can be an ideal tool to determine which sources are likely to have an extended CDS and perform PSF subtraction in characterizing further the intrinsic CDS structures for the second installment of the series.
This research is based on observations with AKARI, a JAXA project with the participation of ESA. TU recognizes partial support from the Japan Society for the Promotion of Science (JSPS) through a FY2013 long-term invitation fellowship program (L13518). RLT was partially supported by the NSF EAPSI Program (OISE-1209948). This research has made use of the SIMBAD database, operated at CDS, Strasbourg, France, as well as data products from the Wide-field IR Survey Explorer, which is a joint project of the University of California, Los Angeles, and the Jet Propulsion Laboratory/California Institute of Technology, funded by NASA. Authors also thank the anonymous referee for his/her valuable comments to improve on the clarity of the manuscript.
Supplementary Data
The following supplementary data is available at PASJ online.
Supplementary Figures 1–28.
Appendix A Revised Scaling Parameters for the Power-Law FIS Response Function
A.1 Background
The AKARI/FIS slow-scan maps need to be re-calibrated depending on the science to be done with the maps unless the science targets are the diffuse background emission, with which the maps are absolutely calibrated (Doi et al., 2015). For point sources, measured fluxes need to be re-scaled to yield corrected fluxes (Shirahata et al., 2009), whereas for slightly extended objects such as circumstellar shells, surface brightness maps themselves must be re-scaled before fluxes can be correctly measured (Ueta et al., 2017). These re-calibration steps are necessary because the sensitivity of the FIS detector arrays is dependent on the strength of the incoming signal (Matsuura et al., 2011).
The basis of the surface brightness correction method for AKARI/FIS maps is that the PSF shape always remains the same irrespective of the source flux (i.e., scale invariance). This particular characteristic of the FIS detector arrays permit us to describe the FIS response function as a power-law. Therefore, a specific set of parameters for the adopted FIS power-law function (the and values; § 5) would specifically describe the way the FIS detector arrays responded to incoming signals to yield the specific PSF shape (Ueta et al., 2017).
In characterizing this FIS response function, Ueta et al. (2017) previously used the Gaussian gridding convolution function (GCF) of the beam (FWHM) size of and for the SW and LW bands, respectively, upon converting the archived AKARI/FIS TSD into 2-D co-added maps with FAST. These numbers were chosen to keep the consistency between the AKARI FIS All-Sky Survey (AFASS) images and the FIS slow-scan maps. However, this particular parameter choice was not the best if the angular resolution of the resulting co-added images of the FIS slow-scan maps was to be optimized. This is because the kernel size for the point-spread-function (PSF) profile adopted was roughly 1.7 times greater than the intrinsic diffraction limit of AKARI at the wavelength of the wide bands at 90 and 140 m.
Thus, we need to re-define parameters of the FIS power-law scaling function that are optimized for the present investigation in which the spatial resolution is the utmost importance. In other words, in the present investigation we aim to recover the intrinsic diffraction limit of AKARI at the wavelength of the wide bands at 90 and 140 m, and hence, we have to use the GCF that represents to the PSF shape at AKARI’s intrinsic diffraction limit. Hence, the and parameters of the FIS power-law scaling function (s; § 5) must be updated according to the newly adopted PSF shape at the intrinsic diffraction limit.
A.2 Super-PSF of the FIS Slow-Scan Maps at AKARI’s Diffraction Limit
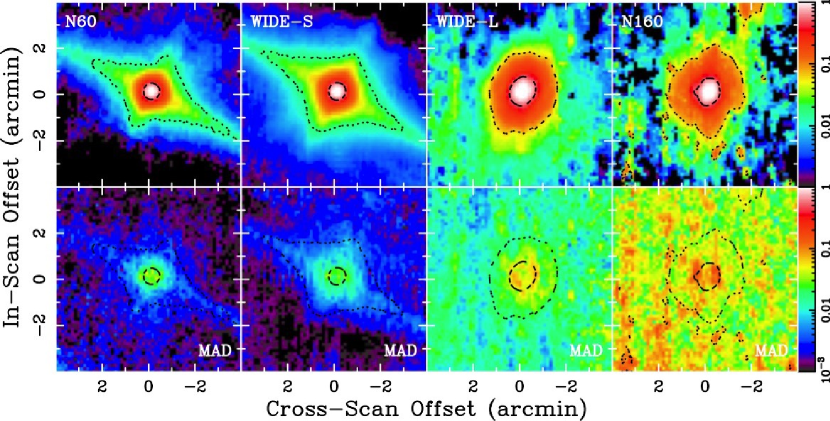
For the present analysis in which we aim to produce AKARI/FIS images of the highest spatial resolution, we adopt the GCF mimicking the Airy disk of 33′′ and 51′′ for SW and LW, respectively (i.e., the intrinsic diffraction limit of AKARI at these wavelengths). The effective Airy disk size (defined to be of the 1/ diameter) measured from the resulting super-PSFs turns out to be 49\farcs1 and 76\farcs7, while the effective FWHM is 23\farcs3 and 34\farcs9. Thus, the effective FWHM size is roughly a factor of 2 smaller in the present study with respect to those used by Ueta et al. (2017).
Fig. 4 shows the “super-PSF” images of the intrinsic diffraction limit in the four AKARI/FIS bands, made by taking the median of the normalized FAST-processed FIS maps of the PSF/photometric reference sources (using 24 and 18 sources for the SW and LW bands, respectively; Table 1 of Ueta et al. (2017)). The median MADs intrinsic to the source emission are found to be %, %, %, and %, for the N60, WIDE-S, WIDE-L,and N160 bands, respectively, within the 5- region (dashed contour in the PSF images), almost identical to the previous cases (Ueta et al., 2017).
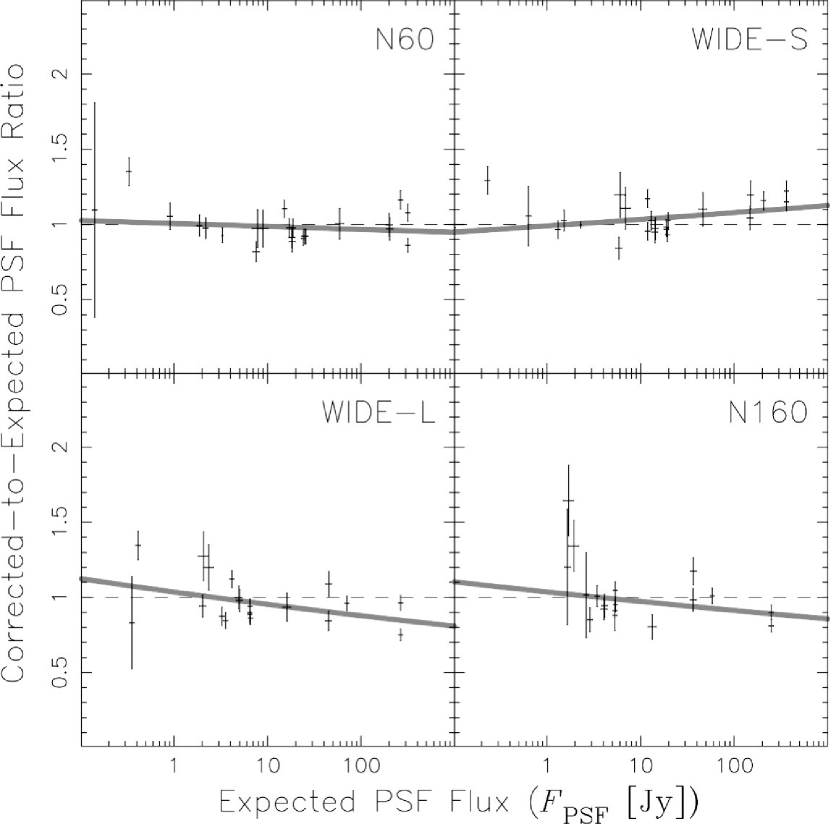
A.3 Determination of the Updated Scaling Factors
We follow exactly the same procedure as described by Ueta et al. (2017) in deriving the power-law FIS response function and scaling factors. In a nutshell, we fine-tune the and parameters until the resulting “corrected” measured fluxes reproduce the “expected” values of far-IR photometric calibration objects (Shirahata et al., 2009; Ueta et al., 2017). The derived parameters are shown in Table AKARI Mission Program: Excavating Mass Loss History in Extended Dust Shells of Evolved Stars (MLHES) I. Far-IR Photometry111Based on observations with AKARI, a JAXA project with the participation of ESA.. Here, we just present the comparison ratio between the corrected and expected PSF fluxes as a function of the expected PSF flux for each FIS band in Fig. 5. The power-law fits of the corrected-to-expected PSF flux ratios are , , , and , respectively, for the N60, WIDE-S, WIDE-L, and N160 bands, where is the 3 expected flux in Jy. Compared with the previous case, the present re-scaling is a few percent better in the SW band and equally good in the LW band. This suggests that the quality of the results of the flux calibration does not differ much by the choice of the PSF shape (i.e., the GCF parameters).
References
- Acker et al. (1992) Acker, A., Marcout, J., Ochsenbein, F., et al. 1992, The Strasbourg-ESO Catalogue of Galactic Planetary Nebulae. Parts I, II. (Garching: European Southern Observatory)
- Arimatsu et al. (2011) Arimatsu, K., Izumiura, H., Ueta, T., et al. 2011, ApJ, 729, L19
- Beichman et al. (1989) Beichman, C. A., Neugebauer, G., Habing, H. J., et al. 1989, IRAS Point Source Reject Catalog, Version 2.1 (Washington, D.C.: NASA GPO)
- Chan & Kwok (1988) Chan, S. J., & Kwok, S. 1988, ApJ, 334, 362
- Cox et al. (2011) Cox, N. L. J., García-Hernández, D. A., García-Lario, P., et al. 2011, AJ, 141, 111
- Cox et al. (2012) Cox, N. L. J., Kerschbaum, F., van Marle, A.-J., et al. 2012, A&A, 537, A35
- Cutri et al. (2012) Cutri, R. M., Wright, E. L., Conrow, T., et al. 2012, Explanatory Supplement to the WISE All-Sky Data Release Products (Pasadena: IPAC/Caltech)
- Decin et al. (2012) Decin, L., Cox, N. L. J., Royer, P., et al. 2012, A&A, 548, A113
- Do et al. (2007) Do, T., Morris, M., Sahai, R., & Stapelfeldt, K. 2007, AJ, 134, 1419
- Doi et al. (2002) Doi, Y., Hirooka, S., Sato, A., et al. 2002, Advances in Space Research, 30, 2099
- Doi et al. (2015) Doi, Y., Takita, S., Ootsubo, T., et al. 2015, PASJ, 67, 50
- Evans et al. (2009) Evans, P. A., Beardmore, A. P., Osborne, J. P., & Wynn, G. A. 2009, MNRAS, 399, 1167
- Fujiwara et al. (2003) Fujiwara, M., Hirao, T., Kawada, M., et al. 2003, Appl. Opt., 42, 2166
- Gillett et al. (1986) Gillett, F. C., Backman, D. E., Beichman, C., & Neugebauer, G. 1986, ApJ, 310, 842
- Groenewegen et al. (2011) Groenewegen, M. A. T.,Waelkens, C., Barlow, M. J., et al. 2011, A&A, 526, A162
- Habing et al. (1985) Habing, H. J., Olnon, F. M., Chester, T., Gillett, F., & Rowan-Robinson, M. 1985, A&A, 152, L1
- Hacking et al. (1985) Hacking, P., Neugebauer, G., Emerson, J., et al. 1985, PASP, 97, 616
- Hashimoto & Izumiura (1998) Hashimoto, O., & Izumiura, H. 1998, Ap&SS, 255, 349
- Hashimoto et al. (1998) Hashimoto, O., Izumiura, H., Kester, D. J. M., & Bontekoe, T. R. 1998, A&A, 329, 213
- Herwig (2005) Herwig, F. 2005, ARA&A, 43, 435
- Höfner & Olofsson (2018) Höfner, S., & Olofsson, H. 2018, A&ARv, 26, 1
- Iben (2012) Iben, I. 2012, Stellar Evolution Physics (Cambridge: CUP)
- Ikeda (2012) Ikeda, N. 2012, FAST User’s Handbook, ver. 0.1 (Sagamihara: ISAS)
- Izumiura et al. (1996) Izumiura, H., Hashimoto, O., Kawara, K., Yamamura, I., & Waters, L. B. F. M. 1996, A&A, 315, L221
- Izumiura et al. (2009) Izumiura, H., Ueta, T., Yamamura, I., et al. 2009, ASP Conf. Ser. 418: AKARI, a Light to Illuminate the Misty Universe, eds. T. Onaka, G. J. White, T. Nakagawa, & I. Yamamura (San Francisco: ASP), 127
- Izumiura et al. (2011) Izumiura, H., Ueta, T., Yamamura, I., et al. 2011, A&A, 528, A29
- Izumiura et al. (1997) Izumiura, H., Waters, L. B. F. M., de Jong, T., et al. 1997, A&A, 323, 449
- Jackson et al. (2002) Jackson, T., Ivezić, Ž., & Knapp, G. R. 2002, MNRAS, 337, 749
- Jorissen et al. (2011) Jorissen, A., Mayer, A., van Eck, S., et al. 2011, A&A, 532, A135
- Kaneda et al. (2002) Kaneda, H., Okamura, Y., Nakagawa, T., & Shibai, H. 2002, Advances in Space Research, 30, 2105
- Karakas & Lattanzio (2014) Karakas, A. I., & Lattanzio, J. C. 2014, PASA, 31, e030
- Kawada et al. (2007) Kawada, M., Baba, H., Barthel, P. D., et al. 2007, PASJ, 59, S389
- Kerschbaum et al. (2010) Kerschbaum, F., Ladjal, D., Ottensamer, R., et al. 2010, A&A, 518, L140
- Kessler et al. (1996) Kessler, M. F., Steinz, J. A., Anderegg, M. E., et al. 1996, A&A, 315, L27
- Kimeswenger & Kienel (1997) Kimeswenger, S., & Kienel, C. 1997, ASSL Vol. 210: The Impact of Large Scale Near-IR Sky Surveys, eds. F. Garzón, N. Epchtein, A. Omont, B. Burton, & P. Persi (Dordrecht: Kluwer), 105
- Knauer et al. (2001) Knauer, T. G., Ivezić, Ž., & Knapp, G. R. 2001, ApJ, 552, 787
- Maercker et al. (2012) Maercker, M., Mohamed, S., Vlemmings, W. H. T., et al. 2012, Nature, 490, 232
- Marton et al. (2017) Marton, G., Calzoletti, L., Perez Garcia, A. M., et al. 2017, The Herschel/PACS Point Source Catalogue Explanatory Supplement Ver. 2.2 ()
- Matsuura et al. (2007) Matsuura, S., Shirahata, M., Kawada, M., et al. 2007, PASJ, 59, S503
- Matsuura et al. (2011) Matsuura, S., Shirahata, M., Kawada, M., et al. 2011, ApJ, 737, 2
- Mayer et al. (2013) Mayer, A., Jorissen, A., Kerschbaum, F., et al. 2013, A&A, 549, A69
- Mayer et al. (2014) Mayer, A., Jorissen, A., Paladini, C., et al. 2014, A&A, 570, A113
- Meixner et al. (1998) Meixner, M., Campbell, M. T., Welch, W. J., & Likkel, L., 1998, ApJ, 509, 392
- Meixner et al. (2002) Meixner, M., Ueta, T., Bobrowsky, M., & Speck, A. 2002, ApJ, 571, 936
- Meixner et al. (1999) Meixner, M., Ueta, T., Dayal, A., et al. 1999, ApJS, 122, 221
- Moshir et al. (1990) Moshir, M., Copan, G., Conrow, T., et al. 1990, IRAS Faint Source Catalogue, version 2.0 (Washington, D.C.: NASA GPO)
- Murakami et al. (2007) Murakami, H., Baba, H., Barthel, P., et al. 2007, PASJ, 59, S369
- Neugebauer et al. (1984) Neugebauer, G., Habing, H. J., van Duinen, R., et al. 1984, ApJ, 278, L1
- Noriega-Crespo et al. (1997) Noriega-Crespo, A., van Buren, D., Cao, Y., & Dgani, R. 1997, AJ, 114, 837
- Otsuka et al. (2017) Otsuka, M., Ueta, T., van Hoof, P. A. M., et al. 2017, ApJS, 231, 22
- Paczyński (1971) Paczyński, B. 1971, Acta Astronom, 21, 417
- Pilbratt et al. (2010) Pilbratt, G. L., Riedinger, J. R., Passvogel, T., et al. 2010, A&A, 518, L1
- Renzini (1981) Renzini, A. 1981, Astrophysics and Space Science Library 88: Physical Processes in Red Giants, eds. I. Iben, Jr. & A. Renzini (Dordrecht: D. Reidel), 431
- Sahai et al. (2007) Sahai, R., Morris, M., Sánchez Contreras, C., & Claussen, M. 2007, AJ, 134, 2200
- Shirahata et al. (2009) Shirahata, M., Matsuura, S., Hasegawa, S., et al. 2009, PASJ, 61, 737
- Siódmiak et al. (2008) Siódmiak, N., Meixner, M., Ueta, T., et al. 2008, ApJ, 677, 382-400
- Slavin et al. (1995) Slavin, A. J., O’Brien, T. J., & Dunlop, J. S. 1995, MNRAS, 276, 353
- Speck et al. (2000) Speck, A. K., Meixner, M., & Knapp, G. R. 2000, ApJ, 545, L145
- Stencel et al. (1988) Stencel, R. E., Pesce, J. E., & Hagen Bauer, W. 1988, AJ, 95, 141
- Suzuki et al. (2008) Suzuki, T., Kaneda, H., Matsuura, S., et al. 2008, PASP, 120, 895
- Szczerba et al. (2007) Szczerba, R., Siódmiak, N., Stasińska, G., & Borkowski, J. 2007, A&A, 469, 799
- Takita et al. (2015) Takita, S., Doi, Y., Ootsubo, T., et al. 2015, PASJ, 67, 51
- Ueta (2011) Ueta, T. 2011, ASP Conf. Ser. 445 Why Galaxies Care about AGB Stars II: Shining Examples and Common Inhabitants (San Francisco: ASP), 295
- Ueta et al. (2000) Ueta, T., Meixner, M., & Bobrowsky, M. 2000, ApJ, 528, 861
- Ueta et al. (2007) Ueta, T., Izumiura, H., Yamamura, I., et al. 2007, AIP Conf. Proceedings 948: Unsolved Problems in Stellar Physics: A Conference in Honor of Douglas Gough, eds. R. J. Stancliffe, G. Houdek, R. G. Martin, & C. A. Tout (Cambridge: AIP), 365
- Ueta et al. (2008) Ueta, T., Izumiura, H., Yamamura, I., et al. 2008, PASJ, 60, S407
- Ueta et al. (2014) Ueta, T., Ladjal, D., Exter, K. M., et al. 2014, A&A, 565, A36
- Ueta et al. (2006) Ueta, T., Speck, A. K., Stencel, R. E., et al. 2006, ApJ, 648, L39
- Ueta et al. (2010) Ueta, T., Stencel, R. E., Yamamura, I., et al. 2010, A&A, 514, A16
- Ueta et al. (2017) Ueta, T., Tomasino, R. L., Takita, S., et al. 2017, PASJ, 69, 11
- van der Veen & Habing (1988) van der Veen, W. E. C. J., & Habing, H. J. 1988, A&A, 194, 125
- Verdugo et al. (2007) Verdugo, E., Yamamura, I., & Pearson, C. 2007, AKARI FIS Data User Manual, ver. 1.3 (Sagamihara: ISAS)
- Waters et al. (1994) Waters, L. B. F. M., Loup, C., Kester, D. J. M., Bontekoe, T. R., & de Jong, T. 1994, A&A, 281, L1
- Weidemann (1990) Weidemann, V. 1990, ARA&A, 28, 103
- Werner et al. (2004) Werner, M. W., Roellig, T. L., Low, F. J., et al. 2004, ApJS, 154, 1
- Willems & de Jong (1988) Willems, F. J., & de Jong, T. 1988, A&A, 196, 173
- Yamamura et al. (2009) Yamamura, I., et al. 2009, in Astronomical Society of the Pacific Conference Series Vol. 418, AKARI, a Light to Illuminate the Misty Universe, eds. Onaka, T., White, G. J., Nakagawa, T., & Yamamura, I., p. 3
- Yamamura et al. (2016) Yamamura, I., Makiuti, S., & the AKARI team 2016, AKARI-FIR Bright Source Catalogue Public Version 2 Release Note
- Young et al. (1993a) Young, K., Phillips, T. G., & Knapp, G. R. 1993a, ApJS, 86, 517
- Young et al. (1993b) Young, K., Phillips, T. G., & Knapp, G. R. 1993b, ApJ, 409, 725
llllccccccc
Target List and Observation Log
Target Nameaafootnotemark: a
Alt. Name
RA(J2000)
DEC(J2000)
Typebbfootnotemark: b
Var.ccfootnotemark: c
Sp. Type
Obs. Date
Obs. Time
OBSID
AOTPARAMddfootnotemark: d
\endfirstheadTarget Nameaafootnotemark: a
Alt. Name
RA(J2000)
DEC(J2000)
Typebbfootnotemark: b
Var.ccfootnotemark: c
Sp. Type
Obs. Date
Obs. Time
OBSID
AOTPARAMddfootnotemark: d
\endhead\endfoot
a: IRAS catalog names, unless not observed by IRAS.
The leading “R” before the coordinate designation indicates that the entry is taken from the IRAS Point Source Reject Catalog (Beichman et al., 1989), while “F” indicates RAS Faint Source Catalog (Moshir et al., 1990).
b: Simbad Object Type:
AB (AGB star),
C (carbon star),
LP (long period variable),
Mi (Mira),
No (nova),
OH (OH/IR star),
pA (post-AGB star),
PN (planetary nebula),
RC (R CrB star),
S (S star),
sr (supergiant star),
Sy (symbiotic star),
and
SNI (type I supernova).
“?” indicates that the type identification is tentative (i.e., a candidate).
c: Variability Type:
“:” indicates that the type identification is tentative (i.e., a candidate).
d: Parameters for the FIS01 AOT (Kawada et al., 2007): (reset interval [s]);(scan speed [arcsec s-1]);(shift size [arcsec]).
\endlastfootIRAS 000424248 KU And 00:06:52.752 43:05:02.25 Mi M M10 7/14/07 19:41:45 1711042-001 1.0;15;70
IRAS 001027214 NGC 40 00:13:01.01014 72:31:19.0944 PN [WC8] 8/15/07 17:39:45 1711293-001 1.0;15;70
IRAS 001283219 S Scl 00:15:22.26580 32:02:42.9899 Mi M M7/8IIIe 6/10/07 18:50:25 1711091-001 1.0;15;70
IRAS 002450652 UY Cet 00:27:06.4494 06:36:16.871 AB SRB M7 6/25/07 21:42:22 1711023-001 1.0;15;70
IRAS 002483518 AQ And 00:27:31.68373 35:35:14.5034 C SR C 7/14/07 21:23:34 1711226-001 1.0;15;70
IRAS 002543317 Scl 00:27:55.69870 33:00:25.7977 LP LB M2/3III 6/12/07 13:56:21 1711122-001 2.0;8;70
IRAS 010371219 IRC 10011 01:06:25.984 12:35:53.05 OH M M8 7/12/07 14:47:50 1711040-001 0.5;15;70
IRAS 011446658 RAFGL 190 01:17:51.378 67:13:53.34 C M 8/15/07 21:00:53 1711305-001 1.0;15;70
IRAS 012463248 R Scl 01:26:58.09492 32:32:35.4374 C SRB C6,4 6/27/07 21:54:36 1711031-001 1.0;15;70
IRAS 015564511 V370 And 01:58:44.32868 45:26:06.8989 AB LB: M8 2/3/07 15:12:20 1710035-001 1.0;15;70
IRAS 021434404 W And 02:17:32.96107 44:18:17.7691 S M S7-8/1e-M7Se 8/11/07 1:02:08 1711106-001 1.0;15;70
IRAS 021680312 Cet 02:19:20.79210 02:58:39.4956 Mi M M5-9IIIe+DA 1/21/07 14:09:46 1710026-001 0.5;15;70
IRAS 023024525 UX And 02:33:28.803 45:39:15.78 LP SRB M6IIIv 8/14/07 18:35:21 1711078-001 1.0;15;70
IRAS 024275430 W Hor 02:44:14.7520 54:18:04.108 LP SRB M5/7 12/25/06 8:16:41 1710055-001 1.0;15;70
IRAS 024645915 X Hor 02:47:44.947 59:03:04.22 Mi SRA M6/8 6/16/07 15:52:50 1711168-001 2.0;8;70
IRAS 025225005 R Hor 02:53:52.77206 49:53:22.7408 Mi M M5-7e 1/2/07 4:55:25 1710130-001 1.0;15;70
IRAS 030193838 Per 03:05:10.59385 38:50:24.9943 LP SRB M4+IIIa 8/18/07 13:50:37 1711602-001 1.0;15;70
IRAS 030626107 IC 289 03:10:19.30 61:19:01.0 PN 2/23/07 13:40:20 1710142-001 1.0;15;70
IRAS 031125730 TW Hor 03:12:33.15984 57:19:17.5790 C SRB C7,2 6/28/07 21:15:25 1711084-001 1.0;15;70
IRAS 031722156 Eri 03:19:31.00224 21:45:28.3049 LP LB M3III-IIIaCa-1 8/2/07 20:00:29 1711002-001 2.0;8;70
GK Per Nova Per 1901 03:31:12.012 43:54:15.48
No Be+K2sdI 8/24/07 17:26:27 1711603-001 1.0;15;240
IRAS 033746229 U Cam 03:41:48.17393 62:38:54.3906 C SRB C5,4_MS4 2/27/07 23:37:53 1710123-001 1.0;15;70
IRAS 034630710 BR Eri 03:48:47.52714 07:00:53.9463 LP SRB M5V 8/15/07 23:02:13 1711012-001 1.0;15;70
IRAS 040201551 V Eri 04:04:18.79987 15:43:30.5145 AB SRC M7+II: 8/18/07 2:29:36 1711010-001 1.0;15;70
IRAS 043306307 R Ret 04:33:32.83035 63:01:45.0103 Mi M M6.5e 6/30/07 23:02:14 1711173-001 2.0;8;70
IRAS 043616210 P Dor 04:36:45.59127 62:04:37.7974 AB SRB M8III:e 1/4/07 4:49:35 1710014-001 0.5;15;70
IRAS 043873819 R Cae 04:40:30.08596 38:14:06.9557 Mi M M6e 2/16/07 10:41:18 1710063-001 1.0;15;70
IRAS 044596804 ST Cam 04:51:13.34776 68:10:07.6182 C SRB C5,4_MS2 3/11/07 18:46:44 1710307-001 1.0;15;70
IRAS 045731452 R Lep 04:59:36.34904 14:48:22.5309 C M C7,6e 3/2/07 7:33:40 1710031-001 1.0;15;70
IRAS 050716327 WZ Dor 05:07:34.02861 63:23:58.8365 LP SRB M3III 7/14/07 23:34:21 1711136-001 2.0;8;70
IRAS 050964834 S Pic 05:10:57.24760 48:30:25.4481 Mi M M7e 2/22/07 9:00:37 1710064-001 1.0;15;70
IRAS 052511244 IC 418 05:27:28.2037 12:41:50.265 PN NL: O7fp 3/10/07 9:17:22 1710310-001 0.5;15;70
IRAS 054118625 R Oct 05:26:06.19562 86:23:17.7741 Mi M M5.5e 3/22/07 23:58:43 1710315-001 1.0;15;70
IRAS 054184628 W Pic 05:43:13.8307 46:27:13.828 C LB C-J5_C2_6_j7_MS3 9/13/06 19:22:48 1710005-001 2.0;15;70
IRAS 055240723 Ori 05:55:10.30536 07:24:25.4304 sr SRC M1-M2Ia-Iab 9/21/06 22:09:50 1710038-001 0.5;15;70
IRAS 055282010 U Ori 05:55:49.16994 20:10:30.6872 Mi M M6-9.5e 3/19/07 10:21:32 1710317-001 1.0;15;70
IRAS 061761036 HD 44179 06:19:58.21855 10:38:14.7061 pA OH/IR/R: B9Ib/II 9/28/06 21:11:37 1710044-001 0.5;15;70
IRAS 070595818 AC Car 07:06:47.96915 58:22:51.4909 LP SRB M6+III: 5/13/07 13:26:40 1711159-001 1.0;15;70
IRAS 072454605 Y Lyn 07:28:11.61802 45:59:26.2366 S SRC M6S 4/6/07 10:43:09 1710314-001 1.0;15;70
IRAS 083495945 KK Car 08:36:01.288 59:56:26.77 Mi M M3pev 12/18/06 18:53:23 1710025-001 1.0;15;70
IRAS 092005805 NGC 2867 09:21:25.38 58:18:40.9 PN [WO2] 6/25/07 0:38:34 1711304-001 1.0;15;70
IRAS 094292148 IW Hya 09:45:15.24 22:01:45.3 OH OH/IR/M: M8/9 5/28/07 9:53:22 1711045-001 1.0;15;70
IRAS 094521330 IRC 10216 09:47:57.406 13:16:43.56 C M C9,5e 5/15/07 15:30:42 1711241-001 0.5;15;70
Y Hya CGCS 2641 09:51:03.7179 23:01:02.351 C SRB C5,4 12/1/06 23:03:05 1710196-001 1.0;15;70
IRAS 102231823 NGC 3242 10:24:46.107 18:38:32.64 PN 12/7/06 19:37:50 1710069-001 1.0;15;70
IRAS 103234611 CGCS 6386 10:34:30.98 46:27:29.1 C OH/IR/B 12/26/06 18:43:15 1710042-001 1.0;15;70
IRAS 103293918 U Ant 10:35:12.85153 39:33:45.3180 C LB C5,3 12/21/06 16:15:12 1710002-001 1.0;15;70
IRAS 103501307 U Hya 10:37:33.27295 13:23:04.3529 C SRB C6,3_MS2 6/7/07 10:13:48 1711504-001 1.0;15;70
IRAS 104166740 VY UMa 10:45:04.03151 67:24:40.9887 C LB C6,3 10/31/06 7:30:20 1710003-001 1.0;15;70
IRAS 105801803 R Crt 11:00:33.85289 18:19:29.5802 AB SRB M7/8III 6/15/07 10:27:44 1711080-001 1.0;15;70
IRAS 111195517 NGC 3587 11:14:47.701 55:01:08.72 PN 5/13/07 7:23:14 1711114-001 1.0;15;70
IRAS 111257524 CS Dra 11:15:55.9033 75:08:34.564 LP LB M5 10/24/06 8:27:49 1710045-001 1.0;15;70
IRAS 112514527 ST UMa 11:27:50.37920 45:11:06.7628 LP SRB M4III 5/22/07 16:41:13 1711144-001 1.0;15;70
IRAS 113855517 HD 101584 11:40:58.8052 55:34:25.814 pA B8/9I/IIe 7/19/07 9:53:16 1711275-001 0.5;15;70
IRAS 114613542 V919 Cen 11:48:39.22340 35:59:12.9055 AB SRB: M7III 7/6/07 2:00:27 1711366-001 1.0;15;70
IRAS 115385808 Z UMa 11:56:30.22478 57:52:17.6495 LP SRB M5IIIv 5/17/07 10:49:21 1711073-001 1.0;15;70
IRAS 123805607 Y UMa 12:40:21.27880 55:50:47.6091 AB SRB M7II-III: 11/28/06 10:17:27 1710013-001 1.0;15;70
IRAS 124274542 Y CVn 12:45:07.82766 45:26:24.9249 C SRB C5,4J 12/9/06 11:00:21 1710015-001 1.0;15;70
IRAS 125264728 TU CVn 12:54:56.52122 47:11:48.2021 LP SRB M5-III-IIIa 6/9/07 10:36:06 1711147-001 2.0;8;70
IRAS 125446615 RY Dra 12:56:25.91249 65:59:39.8086 C SRB: C4,5J_MS5 11/17/06 9:36:18 1710017-001 1.0;15;70
IRAS 130010527 RT Vir 13:02:37.98140 05:11:08.3825 AB SRB M8III 7/4/07 15:24:06 1711025-001 1.0;15;70
IRAS 131724547 V CVn 13:19:27.76567 45:31:37.6651 Mi SRA M4-M6e 6/15/07 15:45:43 1711165-001 2.0;8;70
IRAS F133703123 Z Cen 13:39:55.90 31:38:31 SNI 7/5/07 16:51:14 1711285-001 1.0;15;70
IRAS 134622807 W Hya 13:49:01.99810 28:22:03.4881 Mi SRA M7.5-9e 7/28/07 16:13:25 1711236-001 0.5;15;70
IRAS 134683947 R CVn 13:48:57.04306 39:32:33.1687 Mi M M6.5-9e 6/27/07 14:29:21 1711178-001 2.0;8;70
IRAS 140037633 Aps 14:05:19.87784 76:47:48.3204 LP SRB M6.5III: 2/28/07 18:44:45 1710010-001 1.0;15;70
IRAS 141626701 U UMi 14:17:19.90173 66:47:39.2153 Mi M M6-8e 5/23/07 19:20:26 1711188-001 1.0;15;70
IRAS 142192555 RX Boo 14:24:11.62662 25:42:13.4091 AB SRB M7.5-M8 1/14/07 12:25:29 1710009-001 1.0;15;70
IRAS 142773904 V Boo 14:29:45.26599 38:51:40.6600 LP SRA M5+-6.5e 7/9/07 3:19:56 1711167-001 2.0;8;70
IRAS 145676607 RR UMi 14:57:35.00729 65:55:56.8569 LP SRB M4.5III 5/30/07 12:05:08 1711070-001 1.0;15;70
IRAS 145914438 CGCS 6570 15:02:32.189 44:50:07.96 OH OH/IR/B 2/15/07 19:21:24 1710043-001 1.0;15;70
IRAS 150946953 X TrA 15:14:19.17535 70:04:46.1052 C LB C5,5 2/28/07 20:21:49 1710004-001 1.0;15;70
IRAS 152551944 WX Ser 15:27:47.043 19:33:51.71 Mi M M8.5 8/6/07 11:03:34 1711041-001 1.0;15;70
IRAS 153963842 RR CrB 15:41:26.22899 38:33:26.5958 LP SRB M3 7/30/07 11:39:59 1711151-001 2.0;8;70
IRAS 154652818 R CrB 15:48:34.4147 28:09:24.295 RC RCB G0Iep 2/4/07 14:50:59 1710033-001 1.0;15;70
IRAS 154773943 V CrB 15:49:31.3120 39:34:17.890 C M C6,2e_MS3 8/1/07 0:09:12 1711107-001 2.0;8;70
IRAS 154924837 ST Her 15:50:46.62569 48:28:58.8508 S SRB M6S-M7SIII: 1/20/07 20:33:24 1710008-001 1.0;15;70
IRAS 160114722 X Her 16:02:39.17325 47:14:25.2806 AB SRB M6III 1/26/07 15:35:09 1710007-001 1.0;15;70
IRAS 161645952 AT Dra 16:17:15.34668 59:45:18.0832 LP LB M4III 7/7/07 21:37:00 1711003-001 2.0;8;70
IRAS 162552801 Abell 39 16:27:33.71 27:54:33.5 PN PN DAO.70 8/20/07 15:05:25 1711221-001 2.0;8;70
IRAS 163067223 R UMi 16:29:57.89762 72:16:49.1681 LP SRB M7III:e 11/4/06 7:17:31 1710053-001 1.0;15;70
IRAS 164185459 S Dra 16:42:55.87831 54:54:13.6149 AB SRB M6III 1/30/07 22:09:43 1710011-001 1.0;15;70
IRAS 164574219 V636 Her 16:47:19.74712 42:14:20.0990 LP LB M4.5III 8/20/07 11:50:30 1711126-001 2.0;8;70
IRAS 164735753 AH Dra 16:48:16.63223 57:48:49.3534 LP SRB M5 7/28/07 11:40:56 1711161-001 2.0;8;70
IRAS 170281004 M 2-9 17:05:37.952 10:08:34.58 PN Be 9/9/06 10:10:21 1710070-001 0.5;15;70
IRAS 170816422 TV Dra 17:08:24.50463 64:19:08.7446 AB LB MS 7/1/07 23:05:28 1711063-001 1.0;15;70
IRAS 171190859 IRC 10322 17:14:19.393 08:56:02.60 AB OH/IR/SR: M9-10 3/7/07 19:12:58 1710041-001 1.0;15;70
IRAS 173895742 V Pav 17:43:18.94034 57:43:26.2886 C SRB C6,4 3/18/07 20:27:22 1710312-001 1.0;15;70
IRAS 175846638A NGC 6543 17:58:33.423 66:37:59.52 PN [WC] 10/2/06 5:37:25 1710066-001 0.5;15;70
IRAS 182166419 DS Dra 18:21:57.2365 64:20:36.226 PN PG1159 5/8/07 16:36:24 1711215-001 1.0;15;70
IRAS 185173257 NGC 6720 18:53:35.079 33:01:45.03 PN DA(O?) 4/9/07 20:20:18 1710319-001 1.0;15;70
IRAS 185273650 Lyr 18:54:30.28335 36:53:55.0133 LP SRC: M4II 4/12/07 17:53:06 1710318-001 1.0;15;70
IRAS 185374352 13 Lyr 18:55:20.10223 43:56:45.9315 LP SRB M5III 4/14/07 17:53:13 1710344-001 1.0;15;70
IRAS 191435032 V Tel 19:18:14.609 50:26:48.37 LP SRB M6/8 10/7/06 7:24:45 1710051-001 1.0;15;70
IRAS 192337627 UX Dra 19:21:35.51795 76:33:34.5443 C SRA: C7,3 2/22/07 16:19:06 1710016-001 1.0;15;70
IRAS 193141629 AQ Sgr 19:34:18.99465 16:22:27.0363 C SRB C7,4 10/16/06 6:29:15 1710018-001 1.0;15;70
IRAS 193545005 R Cyg 19:36:49.381 50:11:59.46 S M S4-8/6e 11/10/06 10:20:17 1710030-001 1.0;15;70
IRAS 193903229 TT Cyg 19:40:57.0158 32:37:05.757 C SRB C4,4 4/26/07 19:49:26 1710322-001 1.0;15;70
IRAS 194095520 V Cyg 19:42:04.1472 55:27:47.599 LP LB M5III 5/20/07 10:19:28 1711128-001 1.0;15;70
IRAS 194345024 NGC 6826 19:44:48.1501 50:31:30.264 PN E/SD: O6fp 11/13/06 17:43:16 1710143-001 0.5;15;70
IRAS 195105919 S Pav 19:55:13.96727 59:11:44.3384 Mi SRA M8III 10/11/06 7:15:16 1710059-001 1.0;15;70
IRAS 195742234 NGC 6853 19:59:36.379 22:43:15.75 PN DAO.6 4/28/07 18:15:22 1710327-001 1.0;15;240
IRAS 195755930 NU Pav 20:01:44.74540 59:22:33.2177 LP SRB M6III 10/12/06 6:23:52 1710049-001 1.0;15;70
IRAS 200382722 V Sgr 20:06:55.24418 27:13:29.7616 AB LB M7/8III 10/21/06 10:26:12 1710046-001 1.0;15;70
IRAS 200756005 X Pav 20:11:45.86402 59:56:12.8172 AB SRB M8III 10/13/06 7:11:35 1710056-001 1.0;15;70
IRAS 200884618 NGC 6884 20:10:23.66 46:27:39.8 PN 5/17/07 2:50:26 1711329-001 1.0;15;70
IRAS 201204433 RZ Sgr 20:15:28.4049 44:24:37.480 S SRB S4,4ep 10/19/06 8:45:19 1710057-001 1.0;15;70
IRAS 201412128 RT Cap 20:17:06.52984 21:19:04.4818 C SRB C6,4 4/21/07 19:09:03 1710320-001 1.0;15;70
IRAS 202482825 T Mic 20:27:55.18840 28:15:39.8035 AB SRB M7/8III 4/22/07 20:01:54 1710316-001 1.0;15;70
IRAS 203964757 V Cyg 20:41:18.2687 48:08:28.822 C M C7,4e 11/29/06 14:06:52 1710102-001 0.5;15;70
IRAS R210033629 Egg Nebula 21:02:18.27 36:41:37.0 pA SNI F5Iae 7/28/07 14:32:54 1711232-001 1.0;15;70
NGC 7027 NGC 7027 21:07:01.8 42:14:10: PN 12/1/06 10:44:33 1710207-001 0.5;15;70
IRAS 211976956 Y Pav 21:24:16.75016 69:44:01.9759 C SRB C7,3 10/18/06 6:10:40 1710019-001 1.0;15;70
IRAS 212825050 PNG 093.9-00.1 21:29:58.470 51:04:00.30 PN O7(f)/[WC11] 6/16/07 10:19:18 1711328-001 1.0;15;70
IRAS 213587823 S Cep 21:35:12.82976 78:37:28.1892 C M C7,3e 2/17/07 13:46:35 1710032-001 1.0;15;70
IRAS 214123747 RCyg 21:43:16.32871 38:01:02.9725 C SRB C6,4_MS5 12/7/06 8:58:33 1710020-001 1.0;15;70
IRAS 214195832 Cep 21:43:30.46106 58:46:48.1602 sr SRC M2-Ia 12/30/06 14:37:16 1710037-001 0.5;15;70
IRAS 214390226 EP Aqr 21:46:31.84756 02:12:45.9306 AB SRB M7-III: 5/19/07 18:02:45 1711024-001 1.0;15;70
IRAS 214407324 PQ Cep 21:44:28.7910 73:38:04.901 C M C6-,3e 2/3/07 18:41:52 1710036-001 1.0;15;70
IRAS 220172806 TW Peg 22:03:59.51379 28:20:54.2474 AB SRB M6-7III 12/7/06 12:14:09 1710054-001 1.0;15;70
IRAS 220353506 SV Peg 22:05:42.08385 35:20:54.5280 AB SRB M7 12/11/06 7:15:09 1710012-001 1.0;15;70
IRAS 221458041 Oct 22:20:01.67970 80:26:23.0947 LP SRB M5III 10/12/06 4:38:15 1710048-001 1.0;15;70
IRAS 221964612 Gru 22:22:44.20571 45:56:52.6115 S SRB S5,7: 11/11/06 7:21:58 1710001-001 0.5;15;70
IRAS 222304841 S Gru 22:26:05.47415 48:26:18.7561 Mi M M8(III)e 11/10/06 8:12:04 1710134-001 1.0;15;70
IRAS 222333013 RV Peg 22:25:36.81 30:28:21.3 Mi M M6e 6/12/07 15:16:31 1711186-001 1.0;15;70
IRAS 222725435 HD 235858 22:29:10.3746 54:51:06.343 pA LB G5Ia 1/3/07 6:17:21 1710157-001 0.5;15;70
IRAS 223152418 SS Peg 22:33:58.33174 24:33:53.9758 Mi M M6.5e: 6/11/07 16:06:05 1711199-001 1.0;15;70
IRAS 223964708 Gru 22:42:40.05027 46:53:04.4752 LP? LC: M4.5III 11/14/06 8:07:31 1710039-001 0.5;15;70
IRAS 225211640 HR Peg 22:54:35.62717 16:56:30.5959 S SRB S4+/1+ 6/12/07 20:18:59 1711163-001 2.0;8;70
IRAS 225252952 V PsA 22:55:19.690 29:36:44.82 AB SRB M7/8III 5/24/07 14:10:32 1711082-001 1.0;15;70
IRAS 230132748 Peg 23:03:46.45746 28:04:58.0336 LP LB M2.5II-III 6/20/07 20:31:38 1711001-001 1.0;15;70
IRAS 230133735 CF And 23:03:43.8122 37:51:13.648 LP LB M7 6/26/07 19:01:50 1711005-001 1.0;15;70
IRAS 230411016 R Peg 23:06:39.16689 10:32:36.0892 Mi M M6-8.5e 6/13/07 19:33:02 1711196-001 1.0;15;70
IRAS 230700824 57 Peg 23:09:31.45738 08:40:37.7636 S SRA M4S 6/12/07 22:00:55 1711166-001 2.0;8;70
IRAS 231661655 RAFGL 3068 23:19:12.607 17:11:33.13 C M C 6/18/07 23:49:47 1711044-001 0.5;15;70
IRAS 231732600 W Peg 23:19:50.50149 26:16:43.6587 Mi M M6.5-7.5e 12/24/06 7:52:50 1710027-001 1.0;15;70
IRAS F232344215 NGC 7662 23:25:53.6 42:32:06: PN 11/26/06 16:35:08 1710034-001 0.5;15;70
IRAS 233204316 LP And 23:34:27.53 43:33:01.2 C M: C8,3.5eJ 7/8/07 11:09:45 1711261-001 0.5;15;70
IRAS 234121533 R Aqr 23:43:49.46201 15:17:04.1385 Sy M M6.5-8.5e 6/11/07 17:57:30 1711095-001 1.0;15;70
IRAS 234166130 PZ Cas 23:44:03.28104 61:47:22.1823 sr SRC M3Ia 1/24/07 0:25:05 1710147-001 0.5;15;70
IRAS 234380312 19 Psc 23:46:23.51708 03:29:12.5244 C LB C7,2 6/19/07 18:07:52 1711064-001 1.0;15;70
IRAS 235284821 RS And 23:55:21.7415 48:38:17.737 Mi SRA 1/14/07 5:21:07 1710022-001 1.0;15;70
IRAS 235585106 R Cas 23:58:24.87336 51:23:19.7011 Mi M M6.5-9e 1/16/07 10:19:13 1710028-001 0.5;15;70
IRAS 235645651 S Phe 23:59:04.56942 56:34:32.2980 LP SRB M5e 11/20/06 7:57:05 1710050-001 1.0;15;70
Parameters and Characteristics of FIS Surface Brightness Correction Power-Law Fit Parameters Correction Accuracy Flux Range Band n c (%) (Jy) N60 0.8970.009 1.230.03 9711 0.14 – 320 WIDE-S 0.8750.009 1.300.02 10311 0.23 – 360 WIDE-L 0.9490.009 1.160.02 9416 0.36 – 270 N160 0.9770.010 0.4620.012 9721 1.7 – 250 {tabnote} Note: The derived parameters are valid only when the surface brightness units of the input AKARI slow-scan maps are given in MJy sr-1.
*5l
Measured far-IR flux densities of the MLHES targets
N65
WIDE-S
WIDE-L
N160
Target Name
(Jy)
(Jy)
(Jy)
(Jy)
\endfirstheadTarget Name
N65
WIDE-S
WIDE-L
N160
\endhead\endfoot
Note –
∗: the source boundary adopted from a shorter waveband;
†: the source boundary is manually adjusted to remove unwanted regions.
\endlastfootIRAS 000424248 3.77 0.03 2.96 0.03 5.95 0.06 4.14 0.07
IRAS 001027214 5.32 0.03 4.72 0.04 1.08 0.01 1.15 0.01
IRAS 001283219 3.25 0.04 2.59 0.04 3.24 0.11
IRAS 002450652 5.84 0.04 4.88 0.03 1.23 0.02 1.57 0.14
IRAS 002483518 3.25 0.04 3.68 0.06 1.65 0.04 1.23 0.08
IRAS 002543317 7.03 0.15 4.96 0.11 2.70 1.56
IRAS 010371219 1.62 0.01 1.30 0.02 2.35 0.01 2.13 0.01
IRAS 011446658 5.96 0.05 4.00 0.05 3.13 0.07 1.79 0.08
IRAS 012463248 3.61 0.02 3.09 0.03 6.52 0.04 3.37 0.05
IRAS 015564511 2.71 0.02 2.16 0.02 5.40 0.06 2.15 0.05
IRAS 021434404 7.16 0.05 5.46 0.04 6.16 0.14 9.83 1.36
IRAS 021680312 1.88 0.01 1.51 0.02 2.85 0.01 2.43 0.01
IRAS 023024525 7.47 0.05 5.95 0.04 1.37 0.02 6.37 0.30
IRAS 024275430 4.35 0.04 3.67 0.03 3.78 0.16
IRAS 024645915 2.57 0.06 1.68 0.02 1.54 0.10
IRAS 025225005 4.29 0.03 3.54 0.03 6.76 0.06 5.47 0.11
IRAS 030193838 6.74 0.06 4.77 0.05 3.16 0.18
IRAS 030626107 1.03 0.01 1.01 0.02 5.83 0.54 1.03 0.09
IRAS 031125730 3.63 0.05 2.96 0.04 1.96 0.13
IRAS 031722156 2.71 0.04 1.91 0.04 1.45 0.10 1.03 0.12
GK Per
IRAS 033746229 1.00 0.01 7.40 0.14 1.43 0.32
IRAS 034630710 2.50 0.02 3.57 0.02 1.20 0.03 1.40 0.05
IRAS 040201551 1.24 0.01 9.96 0.08 1.71 0.02 3.81 0.22
IRAS 043306307 1.08 0.02 9.32 0.10 4.11 0.46
IRAS 043616210 2.45 0.02 1.84 0.02 2.99 0.01 2.13 0.02
IRAS 043873819 5.31 0.04 3.92 0.03 4.07 0.15
IRAS 044596804 5.24 0.05 4.69 0.05 4.69 0.29
IRAS 045731452 1.54 0.01 1.22 0.01 2.50 0.05 6.26 0.38
IRAS 050716327 6.05 0.19 3.45 0.13
IRAS 050964834 6.89 0.05 5.44 0.04 1.01 0.02 1.75 0.18
IRAS 054118625 4.42 0.05 2.89 0.03 5.50 0.29
IRAS 052511244 7.81 0.05 5.77 0.06 7.91 0.08 6.20 0.10
IRAS 054184628 3.36 0.04 4.09 0.03 1.20 0.03
IRAS 055240723 3.88 0.02 2.81 0.02 3.18 0.03 1.86 0.02
IRAS 055282010 3.41 0.04 2.49 0.05 3.48 0.21 1.81 0.17
IRAS 061761036 1.43 0.01 1.05 0.02 1.55 0.02 9.69 0.16
IRAS 070595818 3.47 0.16 1.66 0.12
IRAS 072454605 6.77 0.10 6.67 0.11 7.23 0.38 7.33 1.14
IRAS 083495945 5.70 0.07 1.20 0.02 2.92 0.03 3.14 0.45
IRAS 092005805 8.82 0.09 7.89 0.14 6.28 0.70 5.70 0.84
IRAS 094292148 4.44 0.04 3.25 0.04 4.38 0.04 2.03 0.04
IRAS 094521330 2.43 0.01 2.34 0.02 4.61 0.01 4.75 0.01
Y Hya 5.11 0.07 5.23 0.09 9.27 0.44 8.85 0.57
IRAS 102231823 4.16 0.02 4.86 0.04 5.83 0.04 3.61 0.09
IRAS 103234611 2.99 0.03 2.25 0.03 1.84 0.06 9.91 0.48
IRAS 103293918 3.13 0.01 3.21 0.01 1.26 0.01 4.97 0.07
IRAS 103501307 3.44 0.02 3.63 0.02 1.47 0.01 9.94 0.12
IRAS 104166740 4.14 0.04 4.58 0.04 1.52 0.03 1.08 0.16
IRAS 105801803 3.77 0.03 3.37 0.03 9.55 0.08 7.52 0.13
IRAS 111195517 1.21 0.03 7.41 0.05 9.43 0.24 1.30 0.07
IRAS 111257524 3.94 0.04 3.00 0.03 3.81 0.21
IRAS 112514527 1.47 0.02 1.00 0.01
IRAS 113855517 1.92 0.02 1.70 0.03 3.98 0.03 3.80 0.04
IRAS 114613542 2.03 0.02 1.89 0.02 5.48 0.13 1.98 0.08
IRAS 115385808 1.64 0.02 1.07 0.02 1.59 0.37
IRAS 123805607 1.06 0.01 9.17 0.06 2.48 0.04 1.75 0.10
IRAS 124274542 1.50 0.01 1.59 0.01 3.56 0.05 1.45 0.13
IRAS 125264728 9.13 0.17 6.71 0.13 1.56 0.14
IRAS 125446615 5.06 0.05 5.90 0.04 1.99 0.03
IRAS 130010527 2.65 0.02 2.20 0.02 4.99 0.04 1.79 0.04
IRAS 131724547 1.92 0.02 1.43 0.02 1.50 0.09 1.69 0.17
IRAS F133703123 2.62 0.02 3.34 0.03 1.58 0.01 1.54 0.01
IRAS 134683947 2.78 0.03 1.79 0.02 1.86 0.11
IRAS 134622807 1.99 0.01 1.71 0.02 3.98 0.02 2.80 0.02
IRAS 140037633 3.78 0.02 3.04 0.03 5.44 0.08 4.35 0.10
IRAS 141626701 1.33 0.02 8.94 0.08
IRAS 142192555 5.28 0.03 4.22 0.04 7.74 0.04 4.39 0.06
IRAS 142773904 1.07 0.03 4.96 0.15
IRAS 145676607 2.79 0.04 1.66 0.02 1.39 0.11
IRAS 145914438 1.16 0.01 8.37 0.13 1.13 0.06 6.62 0.62
IRAS 150946953 1.34 0.01 1.31 0.01 5.03 0.08 4.35 0.16
IRAS 152551944 5.55 0.06 4.16 0.06 7.98 0.37
IRAS 153963842 5.50 0.11 4.77 0.09 1.01 0.30
IRAS 154652818 2.16 0.04 3.80 0.07 2.80 0.08 7.25 0.54
IRAS 154773943 2.54 0.02 1.82 0.02 2.34 0.09
IRAS 154924837 1.03 0.01 8.47 0.06 9.32 0.24
IRAS 160114722 2.59 0.02 2.24 0.02 3.81 0.03 2.47 0.06
IRAS 161645952 9.23 0.15 5.41 0.07
IRAS 162552801 6.73 0.17 1.05 0.02 5.27 0.34
IRAS 163067223 4.43 0.05 3.14 0.04 6.75 0.29
IRAS 164185459 6.62 0.06 6.42 0.05 9.60 0.20
IRAS 164574219 5.11 0.10 3.57 0.08
IRAS 164735753 1.71 0.02 1.30 0.01 1.21 0.10 6.56 1.29
IRAS 170281004 1.23 0.01 1.14 0.01 3.12 0.04 2.49 0.04
IRAS 170816422 2.36 0.04 1.92 0.03 2.92 0.16 2.66 0.23
IRAS 171190859 2.00 0.02 1.37 0.01 1.27 0.03 4.99 0.32
IRAS 173895742 7.27 0.06 6.90 0.10 7.33 0.32
IRAS 175846638A 1.14 0.01 1.01 0.01 1.76 0.01 1.32 0.02
IRAS 182166419 1.39 0.02 1.38 0.02 3.84 0.16 4.43 0.52
IRAS 185173257 4.82 0.02 7.56 0.05 2.90 0.01 2.94 0.02
IRAS 185273650 4.40 0.03 6.74 0.03 1.98 0.03 8.74 1.00
IRAS 185374352 1.75 0.01 1.87 0.01 3.90 0.04 2.64 0.10
IRAS 191435032 6.28 0.07 5.40 0.07 6.82 0.29 4.19 0.54
IRAS 192337627 3.96 0.09 4.29 0.02 1.76 0.03
IRAS 193141629 4.54 0.06 5.81 0.11 2.92 0.06 1.75 0.09
IRAS 193545005 9.13 0.07 7.64 0.08 1.34 0.04 1.63 0.08
IRAS 193903229 2.39 0.05 2.15 0.09 9.01 1.56 cln
IRAS 194095520 6.15 0.15 3.17 0.11
IRAS 194345024 2.93 0.01 3.12 0.03 4.03 0.06 2.09 0.07
IRAS 195105919 1.90 0.01 1.67 0.01 3.11 0.04 7.30 0.32
IRAS 195742234 1.10 0.00 2.26 0.01 8.13 0.08 1.57 0.01
IRAS 195755930 5.36 0.07 3.60 0.06 4.27 0.21
IRAS 200382722 2.21 0.02 1.89 0.02 5.30 0.09 4.15 0.10
IRAS 200884618 6.17 0.08 5.29 0.14 6.00 2.12 cln
IRAS 200756005 3.63 0.02 2.99 0.02 9.94 0.06 3.92 0.09
IRAS 201204433 9.67 0.08 1.89 0.01 3.07 0.01 2.62 0.02
IRAS 201412128 3.99 0.09 4.54 0.11 1.05 0.05 9.52 0.67
IRAS 202482825 2.41 0.02 1.97 0.02 3.51 0.06 2.89 0.12
IRAS 203964757 4.06 0.03 2.58 0.03 5.69 0.41 1.59 0.16
AFGL 2688 1.92 0.01 1.88 0.02 4.56 0.02 4.01 0.02
NGC 7027 6.01 0.04 5.54 0.08 8.57 0.06 8.21 0.09
IRAS 211976956 3.95 0.06 3.47 0.05 5.83 0.24
IRAS 212825050 2.20 0.02 1.52 0.03 2.30 0.59 1.05 0.36
IRAS 213587823 1.61 0.01 1.41 0.01 2.94 0.04 1.79 0.05
IRAS 214123747 1.08 0.01 1.41 0.01 5.71 0.13 4.66 0.17
IRAS 214195832 1.66 0.01 1.14 0.01 2.32 0.12 2.80 0.14
IRAS 214407324 5.17 0.04 4.32 0.03 3.62 0.13 9.27 0.53
IRAS 214390226 3.15 0.02 2.62 0.02 4.51 0.03 3.42 0.06
IRAS 220172806 1.42 0.01 1.26 0.01 2.75 0.04 1.06 0.03
IRAS 220353506 1.62 0.01 1.41 0.01 2.72 0.05 2.74 0.11
IRAS 221458041 2.90 0.04 1.88 0.04 2.34 0.31
IRAS 221964612 5.41 0.03 4.21 0.04 5.69 0.05 3.17 0.07
IRAS 222333013 5.55 0.04 4.09 0.03 3.81 0.13 4.77 0.22
IRAS 222304841 3.48 0.04 2.47 0.03 3.90 0.14
IRAS 222725435 1.45 0.01 2.51 0.02 2.90 0.02 5.35 0.03
IRAS 223152418 2.17 0.03 1.89 0.03 3.81 0.16
IRAS 223964708 2.27 0.02 1.74 0.02 2.98 0.03 2.77 0.09
IRAS 225211640 5.76 0.16 4.03 0.16
IRAS 225252952 1.07 0.01 8.37 0.08 1.11 0.02 2.44 0.20
IRAS 230133735 3.85 0.03 2.76 0.02 1.36 0.05 2.21 0.08
IRAS 230132748 8.03 0.07 5.84 0.06 1.40 0.05 6.50 0.30
IRAS 230411016 4.76 0.04 3.57 0.03 5.05 0.15 1.06 0.11
IRAS 230700824 1.46 0.03 1.02 0.02 5.60 0.76
IRAS 231661655 2.62 0.02 2.04 0.03 2.60 0.01 2.22 0.01
IRAS 231732600 6.17 0.07 5.86 0.10 6.63 0.33
IRAS F232344215 2.11 0.01 2.07 0.02 2.01 0.04 1.25 0.06
IRAS 233204316 1.14 0.01 7.92 0.10 9.98 0.07 8.05 0.11
IRAS 234121533 2.52 0.02 1.83 0.02 2.85 0.02 2.90 0.06
IRAS 234166130 8.44 0.06 7.31 0.28 3.89 0.05 4.39 0.08
IRAS 234380312 9.63 0.05 8.28 0.05 2.53 0.03 2.07 0.07
IRAS 235284821 5.25 0.04 6.22 0.03 1.04 0.02
IRAS 235585106 1.05 0.01 8.86 0.08 3.28 0.03 3.08 0.03
IRAS 235645651 2.52 0.03 2.03 0.02 2.59 0.13
lllllll
The far-IR sky surface brightnesses at the position of the MLHES targets in the Galactic coordinates
Gal. Coord.
N65
WIDE-S
WIDE-L
N160
Target Nameaafootnotemark: a
(J2000)
(J2000)
(MJy sr-1)
(MJy sr-1)
(MJy sr-1)
(MJy sr-1)
\endfirstheadTarget Name
(J2000)
(J2000)
N65
WIDE-S
WIDE-L
N160
\endhead\endfoot
Note –
∗: the source boundary adopted from a shorter waveband.
\endlastfootIRAS 170281004 10.8987 18.0567 4.790.68 1.350.06 3.740.47 5.900.95
IRAS 200382722 14.7707 27.6822 2.760.42 4.210.40 7.081.57 1.090.48
IRAS 202482825 15.1857 32.4288 2.270.39 3.400.26 4.881.28 7.073.63
IRAS 225252952 20.4814 64.4047 1.290.31 1.580.18 1.440.69 3.442.31
IRAS 201412128 21.941 27.9385 3.040.33 4.300.33 7.421.11 1.200.40
IRAS 193141629 22.7377 16.7008 3.420.34 5.720.36 1.110.20 1.710.46
IRAS 152551944 29.515 53.4767 1.680.26 2.720.27 5.361.30 9.122.26
IRAS 171190859 29.9424 25.6156 2.110.31 4.170.30 9.891.31 1.630.34
IRAS 142192555 34.2773 69.2128 1.160.29 1.420.20 2.490.60 5.501.81
IRAS 154652818 45.0496 50.9782 9.521.97 1.590.13 3.450.64 6.021.64
IRAS 162552801 47.0517 42.4826 1.610.27 2.660.30 5.211.21 9.322.77
IRAS 214390226 54.1999 39.2604 1.800.26 2.160.19 3.610.90 5.412.62
IRAS 195742234 60.836 3.6961 9.210.65 2.860.25 7.250.79 1.120.14
IRAS 153963842 61.8484 52.8757 1.320.36 1.380.32 1.970.75 4.971.59
IRAS 185173257 63.1701 13.9781 1.810.29 3.310.31 6.951.09 1.320.35
IRAS 154773943 63.2731 51.2253 1.240.43 1.460.34 2.160.72 5.412.43
IRAS 234121533 66.5168 70.3255 1.490.26 1.560.15 1.560.84 2.391.77
IRAS 164574219 66.7042 40.2520 1.090.31 1.390.22 1.990.49 5.051.91
IRAS 185273650 66.9257 15.3223 1.470.27 2.950.22 6.900.97 1.310.41
IRAS 193903229 67.2727 4.8820 7.720.45 1.870.08 3.440.63 5.491.23
IRAS 142773904 68.9559 66.3926 1.580.42 1.430.35 1.830.60 3.591.91
IRAS 185374352 73.8151 17.7912 1.750.23 3.260.36 6.221.31 1.220.26
IRAS 160114722 74.464 47.7854 8.172.65 1.070.11 2.750.61 6.261.50
IRAS 154924837 76.9789 49.4432 9.362.36 1.210.17 2.610.75 5.511.61
AFGL 2688 80.1677 6.5032 5.431.11 1.350.16 2.690.52 4.570.71
IRAS 200884618 82.1356 7.0936 1.990.27 4.350.49 8.801.16 1.430.16
IRAS 134683947 82.6559 72.7697 1.970.65 1.850.55 2.110.71 4.811.98
IRAS 193545005 82.6756 13.7829 1.910.27 3.630.31 7.871.68 1.370.29
IRAS 164185459 83.3407 40.1805 7.852.61 1.020.16 2.300.66 5.542.19
IRAS 194345024 83.5618 12.7922 1.880.35 4.790.29 9.531.55 1.920.37
IRAS 220172806 83.7849 21.5198 2.820.49 5.030.44 6.931.25 1.290.32
IRAS 230700824 84.7733 46.5059 1.970.14 2.310.18 3.091.04 5.123.18
NGC 7027 84.9298 3.4961 1.630.15 4.500.37 1.070.11 1.750.26
IRAS 230411016 85.4073 44.5601 1.660.26 2.340.22 4.121.18 7.112.23
IRAS 203964757 86.5362 3.7667 2.140.20 6.180.42 1.600.19 2.470.22
IRAS 225211640 86.8259 37.6054 2.190.19 3.480.19 6.011.47 1.040.38
IRAS 164735753 86.8912 38.9458 2.480.63 2.430.45 2.770.84 6.032.73
IRAS 214123747 86.9105 11.3599 5.330.66 1.110.07 1.980.33 3.331.15
IRAS 223152418 87.1501 28.5927 1.130.17 1.780.14 3.740.96 7.081.96
IRAS 194095520 87.925 15.3704 2.600.39 4.880.24 9.801.78 1.970.69
IRAS 220353506 88.7152 16.2856 2.560.28 5.500.27 1.120.21 2.000.49
IRAS 222333013 89.2141 22.6878 1.500.22 2.560.11 5.331.23 9.493.11
IRAS 161645952 90.7378 42.3190 3.800.85 3.190.56 3.140.77 7.382.41
IRAS 234380312 93.2841 55.5955 2.220.37 2.590.18 3.831.22 6.793.04
IRAS 231661655 93.5267 40.3539 1.130.47 1.810.27 2.850.87 5.402.33
IRAS 212825050 93.9871 0.1178 2.080.16 6.030.34 1.650.17 2.610.20
IRAS 182166419 94.0257 27.4283 1.370.33 2.050.27 4.060.85 7.803.14
IRAS 170816422 94.3434 35.3483 3.800.49 3.620.30 3.480.86 7.203.09
IRAS 230132748 95.7486 29.0449 1.830.28 3.080.36 6.681.51 1.290.35
IRAS 175846638A 96.4682 29.9545 1.050.44 1.870.22 4.100.76 8.232.73
IRAS 231732600 98.5749 32.2244 1.640.23 2.910.26 5.940.97 1.010.29
IRAS 230133735 100.5232 20.2866 2.320.24 5.690.31 1.270.19 2.390.56
IRAS 214195832 100.5953 4.3149 2.130.32 5.981.19 1.080.11 1.610.22
IRAS 222725435 103.349 2.5181 1.340.15 3.520.34 7.521.10 1.180.21
IRAS 145676607 104.8714 46.5260 3.290.71 3.100.44 3.110.82 7.652.38
IRAS 163067223 105.0108 36.2380 1.400.36 2.490.19 4.261.03 8.032.34
IRAS 002450652 106.105 68.6779 2.060.26 2.320.22 2.800.94 3.582.96
IRAS F232344215 106.5598 17.6011 1.680.36 3.810.35 9.451.67 1.590.46
IRAS 131724547 107.8914 70.7739 2.350.78 2.520.57 3.320.91 7.103.10
IRAS 192337627 108.2509 24.6048 1.270.23 2.350.20 7.321.10 1.370.32
IRAS 233204316 108.455 17.1467 1.900.45 3.970.29 9.571.81 1.780.52
IRAS 141626701 110.4345 48.1966 2.480.41 2.550.29 3.080.89 6.652.78
IRAS 214407324 110.6427 15.4053 2.900.44 7.860.56 2.620.33 4.790.93
IRAS 235284821 113.4682 13.2004 1.960.30 3.940.35 9.101.61 1.710.46
IRAS 213587823 113.8444 19.3897 1.480.29 3.610.34 1.150.16 2.170.50
IRAS 000424248 114.3475 19.0445 1.420.23 2.660.20 5.921.09 1.140.31
IRAS 235585106 114.5609 10.6191 2.390.46 5.590.34 1.600.26 2.600.48
IRAS 234166130 115.0582 0.0478 1.390.11 3.870.19 9.780.93 1.690.27
IRAS 002483518 117.4764 27.0310 1.420.32 2.530.17 5.081.13 9.193.47
IRAS 001027214 120.0162 9.8681 2.900.34 7.000.38 2.020.31 3.310.99
IRAS 125264728 121.198 69.9197 2.310.70 2.050.50 1.730.83 3.862.12
IRAS 125446615 122.1227 51.1260 9.182.51 1.170.19 2.840.64 6.472.25
IRAS 011446658 125.4913 4.4917 5.740.54 1.790.07 6.070.35 1.060.20
IRAS 123805607 126.1625 61.2121 8.682.74 9.481.71 2.150.62 5.911.60
IRAS 124274542 126.4474 71.6449 1.100.28 1.450.19 2.820.74 8.293.56
IRAS 010371219 128.6417 50.1074 1.800.42 2.750.36 4.051.08 5.472.86
IRAS 111257524 130.7762 40.4972 9.562.75 1.540.12 3.711.02 8.392.55
IRAS 015564511 135.1203 15.8378 1.960.28 3.440.39 7.211.58 1.340.41
IRAS 115385808 136.6269 57.7722 1.940.38 2.120.35 2.260.66 4.302.32
IRAS 021434404 138.7779 15.9012 1.830.22 3.080.22 6.571.49 1.200.40
IRAS 030626107 138.8168 2.8045 1.020.06 2.750.15 6.960.90 1.190.16
IRAS 104166740 139.5893 45.4140 7.221.73 9.041.34 2.330.45 7.062.48
IRAS 023024525 140.9753 13.6121 1.780.23 3.510.27 7.351.24 1.300.44
IRAS 033746229 141.1499 5.9679 5.910.67 1.700.15 4.940.63 8.922.20
IRAS 044596804 142.3897 14.9236 1.960.29 4.800.29 1.180.20 2.200.43
IRAS 111195517 148.4895 57.0500 1.280.56 1.160.36 1.550.80 3.491.65
IRAS 030193838 149.5981 17.0090 2.330.30 4.280.53 9.531.85 1.840.50
GK Per 150.9553 10.1042 3.520.32 8.280.54 2.080.18 3.390.53
IRAS 112514527 160.1436 65.4334 2.110.61 1.740.44 1.970.92 5.122.40
IRAS 021680312 167.7551 57.9827 7.883.67 1.290.25 2.180.66 4.252.20
IRAS 072454605 172.2522 25.2582 1.990.36 3.140.32 5.281.12 1.050.42
IRAS 055282010 188.7152 2.4920 6.390.38 1.560.10 4.100.47 6.491.58
IRAS 034630710 195.7116 43.4296 1.930.23 3.310.26 6.841.42 1.270.37
IRAS 055240723 199.7872 8.9586 7.172.46 1.530.16 3.010.41 4.870.74
IRAS 040201551 208.8489 43.9775 1.180.22 1.560.24 2.800.82 5.982.35
IRAS 031722156 212.0889 55.9956 1.300.17 1.530.15 2.120.86 5.181.99
IRAS 045731452 214.3244 31.3271 1.510.22 2.970.24 7.291.35 1.290.42
IRAS 052511244 215.212 24.2837 2.870.37 7.440.84 1.880.26 3.080.54
IRAS 061761036 218.9681 11.7647 3.090.53 9.490.75 2.910.46 4.940.81
IRAS 094521330 221.4465 45.0603 2.880.85 2.980.76 4.371.10 6.772.68
IRAS 043873819 241.3235 41.3164 7.262.66 9.841.45 2.070.45 6.002.30
IRAS 012463248 250.1814 80.5886 1.320.34 1.650.24 2.480.80 5.031.82
IRAS 054184628 252.9465 30.6841 1.270.15 2.130.14 5.121.09 1.000.31
IRAS 050964834 254.8403 36.2899 6.712.11 9.371.39 1.980.58 4.712.43
IRAS 094292148 255.7954 23.3526 1.540.24 2.490.18 4.320.97 8.473.07
Y Hya 257.5954 23.5763 1.320.26 2.170.19 4.000.79 7.692.20
IRAS 103501307 259.9664 38.0741 1.700.38 2.540.27 4.180.92 7.861.67
IRAS 102231823 261.0509 32.0499 2.880.43 4.350.42 5.621.68 1.150.33
IRAS 025225005 265.4512 57.3755 9.093.21 1.360.19 2.830.85 6.712.63
IRAS 070595818 268.876 20.9187 1.610.27 3.720.20 8.701.88 1.610.34
IRAS 105801803 269.2695 37.1958 1.840.35 2.420.28 3.591.00 6.091.98
IRAS 043616210 272.6714 39.3424 1.830.63 2.070.33 3.680.97 9.083.00
IRAS 050716327 273.2537 35.6061 1.290.25 1.480.14 2.800.73 6.602.60
IRAS 031125730 273.2962 50.9036 1.080.40 1.260.28 2.400.74 5.262.28
IRAS 024275430 273.4748 55.8918 1.160.33 1.880.19 3.871.10 7.882.98
IRAS 043306307 273.9899 39.4094 1.600.40 1.900.27 3.490.89 8.502.82
IRAS 083495945 275.626 11.4322 2.980.29 7.630.46 1.860.26 3.120.59
IRAS 103293918 276.2243 16.1420 1.710.29 2.950.22 6.791.29 1.260.24
IRAS 092005805 278.1592 5.9364 6.250.48 1.520.11 3.300.49 5.651.02
IRAS 024645915 278.8165 52.2858 1.470.41 1.890.44 2.970.83 6.482.81
IRAS 103234611 279.7474 10.1583 2.590.35 7.180.44 1.630.23 2.740.79
IRAS 114613542 288.9348 25.1725 2.270.29 4.350.39 8.351.33 1.470.34
IRAS 113855517 293.0277 5.9372 7.990.88 2.000.17 3.660.36 5.601.31
IRAS 054118625 299.1074 28.3902 1.970.35 3.860.26 9.241.30 1.820.31
IRAS 140037633 307.2199 14.5442 2.870.38 6.840.54 1.610.23 2.510.58
IRAS 221458041 310.0353 34.4970 1.340.27 3.040.14 8.591.75 1.710.45
IRAS 130010527 310.3571 67.8959 2.010.30 2.330.19 2.651.15 4.472.56
IRAS 150946953 314.6046 10.5162 2.750.28 5.810.30 1.160.16 1.870.63
IRAS F133703123 314.86 30.1061 2.380.33 3.230.30 4.731.04 8.692.99
IRAS 235645651 316.9919 59.1004 7.743.09 8.421.30 1.560.62 4.222.20
IRAS 134622807 318.0224 32.8108 2.810.61 4.390.64 6.701.41 1.020.34
IRAS 211976956 323.1957 38.2022 1.110.34 1.520.19 3.430.77 8.642.22
IRAS 145914438 326.0467 12.0707 4.090.36 8.871.02 1.700.32 2.650.78
IRAS 173895742 334.7225 14.2607 2.440.30 5.650.25 1.050.16 1.910.46
IRAS 200756005 337.1507 33.2112 1.450.40 2.010.26 3.991.12 6.872.36
IRAS 195755930 337.848 31.9574 1.300.38 1.980.15 4.101.05 8.612.71
IRAS 195105919 338.0451 31.1239 1.650.52 2.720.18 4.751.18 1.010.23
IRAS 002543317 342.3607 82.2294 1.170.19 1.120.15 1.270.58 2.861.65
IRAS 222304841 345.8847 54.7672 7.942.67 1.100.15 1.330.57 2.871.97
IRAS 223964708 346.2669 57.9541 6.323.58 9.172.07 1.830.75 4.682.45
IRAS 191435032 347.0453 24.6903 1.790.51 3.110.25 5.671.18 1.070.30
IRAS 221964612 350.2821 55.1638 7.723.02 1.170.24 2.060.67 4.822.05
IRAS 201204433 355.7398 33.1629 1.860.50 2.420.26 3.711.17 6.611.98
IRAS 001283219 358.6701 80.7505 9.432.33 1.150.12 1.310.58 2.632.48
lllllllll
Newly Resolved Far-IR Sources Found Near the MLHES Targets
N65
WIDE-S
WIDE-L
N160
Associated
No.
RA(J2000)
DEC(J2000)
(MJy sr-1)
(MJy sr-1)
(MJy sr-1)
(MJy sr-1)
MLHES Source
Identity
\endfirstheadNo.
RA(J2000)
DEC(J2000)
N65
WIDE-S
WIDE-L
N160
Assoc. MLHES Source
Identity
\endhead\endfoot\endlastfoot1 1.702569 43.028147 1.110.63 6.961.24 2.451.60 IRAS 000424248 Unknown
2 6.816878 6.597084 9.992.11 1.340.14 1.690.08 1.320.19 IRAS 002450652 Unknown
3 48.265166 57.354368 8.170.52 1.210.03 2.010.03 2.180.07 IRAS 031125730 ESO 116-12
4 61.051764 15.751063 1.990.03 3.350.02 1.740.03 4.250.31 IRAS 040201551 Unknown
5 70.165871 38.176343 2.701.27 3.590.78 3.650.70 9.581.84 IRAS 043873819 Unknown
6 77.743444 48.539302 7.322.36 7.461.51 6.060.66 8.092.02 IRAS 050964834 Unknown
7 80.416615 86.415403 1.600.28 1.450.19 2.050.29 2.410.50 IRAS 054118625 IRAS 053678627
8 85.772116 46.429199 6.151.07 1.040.07 10.01.06 6.472.83 IRAS 054184628 LEDA 515123
9 112.027330 45.903738 4.530.58 4.970.36 2.080.27 4.180.41 IRAS 072454605 NVSS J072806455415
10 112.151760 46.023933 7.042.31 5.621.61 2.401.30 IRAS 072454605 Unknown
11 156.235920 18.680481 3.461.59 3.961.43 4.120.19 1.620.30 IRAS 102231823 2MASX J102456561840511
12 156.172150 18.702896 1.271.10 1.600.14 8.712.24 IRAS 102231823 2MASX J102441081842161
13 158.598138 46.557139 3.411.60 4.301.18 4.980.49 1.960.53 IRAS 103234611 Unknown
14 168.742160 54.963817 1.990.20 1.180.22 6.651.16 1.660.35 IRAS 111195517 MCG0919014
15 199.790730 45.494444 2.281.12 6.340.84 6.860.67 1.310.19 IRAS 131724547 2MASX J131909674529332
16 207.266370 39.497685 1.340.26 2.780.17 3.050.14 7.220.37 IRAS 134683947 UGC 8736
17 216.096160 25.787907 1.651.34 1.560.16 1.900.27 IRAS 142192555 2MASX J142423072547173
18 224.445830 65.905068 2.400.27 2.810.15 5.120.18 9.280.46 IRAS 145676607 Unknown
19 224.219270 65.933355 2.400.27 2.810.15 5.120.18 9.280.46 IRAS 145676607 MCG1118017
20 240.707950 47.225917 2.470.03 2.290.02 3.680.03 5.750.32 IRAS 160114722 UGC 10156
21 283.326860 33.067801 2.401.65 5.072.39 6.130.52 9.140.72 IRAS 185173257 IC 1296
22 283.582100 36.785821 1.620.19 1.760.13 8.751.11 2.171.12 IRAS 185273650 IRAS 185253643
23 321.103680 69.709140 1.210.03 2.050.04 1.120.03 8.380.57 IRAS 211976956 Unknown
24 326.270180 73.668948 1.300.28 2.310.19 3.670.32 4.870.44 IRAS 214407324 Unknown
25 335.373800 80.447149 3.860.30 6.250.21 5.350.41 5.000.45 IRAS 221458041 6dFGS gJ222128.0802653
26 336.475330 48.500234 7.591.85 6.681.15 5.830.86 1.780.25 IRAS 222304841 LEDA 486758
27 345.933400 28.154108 1.740.33 2.130.29 2.800.18 1.740.24 IRAS 230132748 Unknown
28 350.013690 26.216799 5.650.47 8.390.33 6.440.28 5.940.42 IRAS 231732600 Mrk 322