R Coronae Borealis: Radial-velocity and other observations, 1950–2007
Abstract
Radial-velocity observations made on more than a thousand nights are presented for the type star of the R Coronae Borealis (RCB) class. There are four principal sources: the Lick Observatory (1950–1953), the original Cambridge radial-velocity spectrometer (1968–1991), and the Haute-Provence and Cambridge Coravels (1986–1998 and 1997–2007, respectively). In the case of the last set the size (equivalent width) and width (expressed as if sin ) of the Coravel cross-correlation (‘dip’) profiles are also given, and the variation and complexity of those profiles are discussed. Although there is often evidence of cyclical behaviour in radial velocity, no coherent periodicity is found in any of the series. From time to time, and especially over 100 days before the great decline of 2007, the atmosphere was highly disturbed, with evidence of high-velocity components. We suggest that those are associated with large turbulent elements and result in mass ejection to sufficient distances for the formation of soot and other solids and thus the initiation of RCB-type declines. We associate the changes in light and radial velocity near maximum light primarily with the combined effect of such turbulent elements, and not with coherent pulsation. There is some evidence for a variation in the mean radial velocity on a time scale of about ten thousand days.
keywords:
stars: peculiar, stars: variables: general, stars: mass-loss, techniques: radial velocities, stars: carbon, stars: individual: R CrB.1 Introduction
R Coronae Borealis is the type star of a small group of variables (the RCB stars) which, despite work over a considerable number of years, remain something of a puzzle. There are two main, related, aspects to this puzzle – first, their physical nature and behaviour, and secondly, their place in stellar evolution. The group has been reviewed on a number of occasions (e.g. Clayton 1996, Feast 1996).
The stars are carbon-rich and hydrogen-poor and have a range of anomalies in other elements (see for instance the review of Rao & Lambert 1994). They also have infrared excesses due to radiation from a circumstellar shell with a temperature of order 1000 K. At random intervals they undergo dramatic declines in light (up to 8 mag in ) (RCB events), which are believed to be due to the formation of carbon, or carbonaceous, particles (‘soot’). Those particles cannot be in the form of a uniform shell around the star, since the increase in infrared flux that would then be expected is not observed (Forrest et al. 1971). The events are attributed (Wdowiak 1975) to puffs of dust that form in material ejected from the star in the line of sight. Such puffs, ejected from time to time in random directions, feed the dust shell seen in the infrared. Infrared studies of the RCB star RY Sgr, which pulsates with a considerable amplitude, show that overall the star itself is not significantly affected during an event (Feast 1979). That indicates that any surface disturbance related to an RCB event must be confined to a small area. Other evidence which requires, or is consistent with, the puff model is summarized in Feast (1986). More recently, direct support for such a model for RCB stars has come from high-resolution direct imaging, interferometry, and, in the case of UW Cen, changes in the illumination of a circumstellar reflection nebula (Jeffers et al. 2012, Bright et al. 2011, Clayton et al. 1999).
In the case of R CrB itself there is also a large ( pc) cool shell which is possibly the debris from the ejection of the star’s hydrogen-rich envelope a few times years ago (Gillett et al. 1986); see also Montiel et al. (2015).
RY Sgr is unusual in showing clear coherent pulsations with a period of about 38 days. Most other RCB stars show smaller-scale variations in light and radial velocity on a time scale of the order of a month. In the case of R CrB these are 0.2 mag and 10 km s-1. It has often been suggested that all the RCB stars are radially pulsating variables and that the formation of the dust puffs is associated in some way with their pulsation, though that view has been questioned (e.g. Feast 1996).
Once dust is formed it will be blown away from the star by radiation pressure, dragging gas with it, and outward velocities of 200 km s-1 or more are observed at that stage (see reviews cited above). It is not clear, however, how low-amplitude pulsations can raise gas to regions cool enough for dust to form, and that has remained a concern.
There are two competing basic models for the RCB stars: either they are ‘born again’ AGB stars (i.e. post-AGB stars undergoing a final helium shell flash, e.g. Fujimoto 1977, Renzini 1979) or else the result of mergers of CO white dwarfs with helium ones (Webbink 1984).
The purpose of the present paper is to present several long-term radial-velocity and other studies of R CrB itself and to make a preliminary analysis of those data. In particular, we investigate the nature of small-scale velocity and other variations of the star and their possible relationship to dust ejection, as well as phenomena occurring at the onset of major declines in light.
2 Observations
2.1 The Herbig (Lick) Series

R CrB was observed with the 3-prism Mills spectrograph attached to the Lick 36-inch refractor at almost every opportunity during the observing seasons of 1950, 1951 and 1953. At those times, the star was near normal brightness (see section 3.4.1), and 73 acceptable spectrograms (dispersion 11 Å mm-1 at 4500 Å) were obtained, with one further observation in 1956. The spectra were measured in the 1950s with a Hartmann spectrocomparator (Hartmann 1906, Moore 1935) against a standard plate of a reference star, but the results were not published. They were re-measured in the 1980s by an automated procedure that is equivalent to the Hartmann method and also to a radial-velocity spectrometer. A transmission scan of an R CrB spectrogram was digitized at 2.5-m intervals by the computer-controlled Lick/Gaertner two co-ordinate microphotometer and was then cross-correlated with a reference scan of a standard R CrB plate.
The differential velocities thus obtained were reduced to the Lick or IAU velocity system by measuring in the same way, against the same R CrB standard, a number of Mills plates of standard stars (Pearce 1957) taken during the R CrB programme. The stars measured, together with the adopted velocity and the number of plates measured, were: Cyg ( km s-1, 7), Per (, 7), and Aqr (+6.7, 5). The scatter of the measured velocities of those standards about the adopted values, after application of the same overall zero-point correction to the R CrB reference as was applied to the velocities of R CrB itself, correspond to a standard deviation (for an individual Mills velocity) of 0.3 km s-1, which is probably optimistic. The internal agreement of the individual sections of each plate (the spectrograms were measured in 20-Å sections) yields a probably more realistic value of 0.6 km s-1. The (heliocentric) radial velocities (km s-1 ) of R CrB so obtained are given in the Appendix Table A1 together with the Modified Julian Date (MJD). The radial velocities are plotted against MJD in Fig. 1.
2.2 Radial velocities from spectrometers
About 50 years ago one of the present authors developed the method of cross-correlation, now in universal use, for measuring radial velocities. The prototype instrument (Griffin 1967) operated at the coudé focus of the Cambridge 36-inch reflector from 1966 till 1991, and 370 of the R CrB measurements listed in Table A2 were made with it. It focussed the stellar spectrum upon a physical diaphragm or mask, that looked like a high-contrast photographic negative of a typical late-type spectrum, although it was actually made artificially and was based upon the spectrum of Arcturus (K2 III) as portrayed in the Arcturus Atlas (Griffin 1968). The mask was scanned quite slowly in velocity space (about 1.4 km s-1 per second) along the direction of dispersion, and at a certain position, determined by the stellar radial velocity, its transparent apertures were systematically aligned with the absorption lines in the star spectrum. At that point there was a significant diminution in the total light that the mask transmitted, which was gathered by a field lens (Fabry lens: Redman 1945) and measured by a photomultiplier. The output from the latter was drawn in real time by a strip-chart recorder running at one inch per minute. Passage through the light-transmission minimum (‘dip’) took about half a minute, after which the observer reversed the direction of scan by operating a switch, and could thus make several passes backwards and forwards through the dip. A typical observation consisted of 6–10 passes. During the scanning fiducial marks were incorporated in the chart-recorder trace at certain velocities. The reduction procedure consisted of bisecting the dips by eye with a line drawn on a small piece of perspex, noting their mean position with respect to the fiducial marks and doing some arithmetic on a slide-rule. On occasions the dips given by R CrB were somewhat asymmetrical but, since the bisection procedure was subjective anyway, an asymmetry did not constitute any particular problem, and the measurer was never conscious of there being any serious ambiguities as to the positions of the effective centroids of the dips111The dip profile can be regarded as the averaged profile, in the spectrum of the object observed, of the hundreds of absorption lines that are transmitted by the mask in the spectrometer – mostly lines of neutral metals. Of course it is not as informative as an actual spectrum – a feature in the dip may be attributable only to a sub-set of the transmitted lines, for example just those arising from high excitation levels, and in that case the observed feature must in fact be correspondingly more marked in that set of lines from which it originates..


Subsequent radial-velocity spectrometers that operated with physical masks were computer-controlled, the first being the one that was constructed by Griffin & Gunn (1974) to operate at the coudé focus of the Palomar Observatory’s 200-inch telescope; it contributed just 4 measurements of R CrB to Table A2. In such instruments the scanning is performed relatively quickly – the whole scan is repeated at a frequency of a few Hz rather than taking half a minute or more as in the prototype instrument. The photon counts are accumulated in a computer memory in a succession of ‘bins’ at addresses that are advanced in synchronism with the scan, so there is only one picture of the dip but it builds up progressively as more and more of the quick scans are overlaid; the observation is terminated by the observer at will, the final array of bin counts is stored, and the bisection of the dip is performed automatically by the controlling computer and/or subsequently by more-sophisticated software.
RFG was fortunate to have many opportunities to use the Geneva Observatory’s Coravel spectrometer (Baranne et al. 1979) on the 1-m telescope at Haute-Provence (OHP), and a few on the similar instrument on the Danish 1.54-m telescope at the European Southern Observatory (ESO); those instruments contributed 108 and 4 measurements, respectively, of R CrB. He also made 15 observations of the star as a guest observer with the spectrometer at the Dominion Astrophysical Observatory’s 1.22-m coudé (DAO) (Fletcher et al. 1982). All those measurements have been included, suitably flagged, in Table A2. The largest contribution (541) to the set of radial-velocity measurements discussed here, however, has come from the Coravel installed at the Cambridge 36-inch coudé focus in succession to the original spectrometer. It operated for a time in 1997, and then from the end of 1999 until (as far as R CrB is concerned) 2007, when the star fell out of sight in a unprecedentedly deep and protracted photometric minimum. The 28 measurements made in the early months of 1997 have been included in Table A2, while the main bulk of the Cambridge Coravel data (513 nights) appear in Table A3.
In all the spectrometers operated by computers, the centroid of the observed dip is determined by cross-correlation with a standard profile. In the Geneva Observatory’s instruments that profile is a Gaussian, but in the Palomar and Cambridge ones it starts as the profile that is given by the instrument concerned for the many stars that prove to give dips of the minimum width. It is matched to the wider dips given by other stars by broadening into a rotational profile by summing the contributions of a lot of elementary areas into which the stellar disc is conceptually divided, to each of which is assigned the velocity corresponding to its distance from an axis about which rotation is deemed to occur and a brightness found from the conventional limb-darkening model. The observed dip is modelled in position, depth and rotational velocity by adjusting those parameters computationally to minimize the sum of the squares of the discrepancies of the whole set of ‘bin’ counts that represents the dip from the corresponding elements of the model. Of course the method is really designed to work with symmetrical dips, since the model ones are necessarily symmetrical; but it gives a sensible-looking result, much the same as a human measurer with his line ruled on a piece of perspex would obtain, when it is called upon to adjudicate on a skew dip. Except as noted in specific cases below, the dips given by R CrB are not normally skew enough for there to be ambiguity at a level at all comparable with the typical range of variation of the star’s radial velocity.
Table A3 presents not only the measured radial velocities but also, for each observation, parameters related to the strength and width of the dip. The strength is given as an equivalent width, defined exactly as for line-strengths in stellar spectra except (since the abscissae of a plotted dip are velocities rather than wavelengths) the unit is the km s-1 rather than the Å. The dip width is also expressed as a velocity, in terms of the sin value of the best-matching rotationally broadened model dip. In R CrB that value is normally between 15 and 25 km s-1. Although it is useful to have a numerical quantification of the dip width, there is no suggestion here that rotation is the principal cause of the dip width in R CrB. We visualise the star as presenting to view a hemisphere containing a rather small number of individually huge convective elements, and the dip width is compounded of the turbulent velocities within each individual element and the considerable differences among the several elements in their mean motions in the line of sight. Because we assess dip widths by means of a rotational model, for convenience we refer to sin values below, but only as a shorthand way of quantifying the dip width and without implying that the numbers truly refer to rotation of the star. Data for the times covered by Tables A2 and A3 are plotted in Figs 2 and 3 and are discussed in detail later.


3 Variations at Maximum Light
3.1 Previous Observations
Before discussing our radial-velocity observations near maximum light, it is useful to summarize previous work on the small-scale variations in both light and radial velocity.
Since the discovery of its variability by Pigott (1797) there have been extensive visual observations of R CrB. Many of them have been assembled by the American Association of Variable Star Observers (AAVSO). They are of importance in studying the major declines but are rarely of sufficient accuracy to delineate the small-scale variations clearly.222The more recent AAVSO data contain a limited number of photoelectric and CCD observations by their members. Several authors have obtained multi-colour photometry, and those giving information on the small-scale variations are listed below together with a brief summary of their conclusions. Analogous comments are made on previous radial-velocity observations.
Fernie et al. (1972). UBVR observations in 1971 (27 observations over 113 days) yield a period of days.
Tempesti & De Santis (1975). Their data over 175 days can be fitted by a combination of days and days (see Fernie 1989).
Fernie (1982). UBVRI photometry in 1971 and 1978–80 yield a quasi-period of about 46 days.
Fernie et al. (1986). UBV observations in 1985 indicate a period of days just prior to an RCB event.
Fernie (1989). Five photometric maxima in 1985–87 fit a period of days.
Fernie (1990a). UBV on 99 nights in 1988 showed the usual 0.2-mag amplitude in but no single period. Periods of 59, 31 and possibly 23 days are present.
Fernie (1990b). UBV on 98 nights in 1989 as the star emerged from a decline gave a period of days.
Fernie (1991). UBV observations on 71 nights in 1990 indicated a period of days.
Lawson (1991) re-analysed photometry from the literature. He found that the 1986–89 data were best represented by a coherent periodicity of 51.8 days, but in 1985 and 1990 there was a 44-day periodicity, of which there was no evidence in 1986–89.
Gorynya et al. (1992) made 43 radial-velocity observations over 134 days in 1990 and 43 over 138 days in 1991. Attempts at period-fitting to the entire sample were unsuccessful. The 1990 measurements could be fitted with a period of 42.97 days and an amplitude of 10 km s-1, but that did not fit the 1991 observations, which gave a much less convincing periodicity of 33.97 days.
Fernie & Lawson (1993) discussed UBV photometry and radial velocities in 1990 and 1991. The 1990 data were possibly consistent with a 43-day period, which was not seen in the 1991 photometry but might be present in the radial velocities.
Fernie & Seager (1994). UBV observations of three maxima in 1992 and three in 1993, taken together, fitted a period of days within 3 days over a time interval of 12 cycles. An RCB event in 1993 seems to start near a minimum. But the decline in 1985 (Fernie et al. 1986) seemed to start near a maximum333Here, and throughout, maximum or minimum refer to the cyclical variations near RCB maximum either in light or radial velocity..
Rao & Lambert (1997) deduced from spectra that the star was 500K cooler at minimum than at maximum in a quasi-period cycle. They also found that the radial velocity, at least on one occasion near maximum light, depended upon the excitation potential of the lines measured. Such behaviour had long since been noticed, e.g. Grenfell & Wallerstein (1969), in Cepheid variables, in which a shock wave periodically rises through the atmosphere, affecting the spectral lines formed at progressively decreasing depths.
Yudin et al. (2002). UBV observations from 1985 to 1990 showed no stable periodicity.
3.2 Summary of photometric behaviour
Before turning more specifically to a discussion of the radial-velocity behaviour of R CrB we attempt to summarize the evidence about its photometric behaviour. As reviewed in part above, there is a large amount of published photoelectric photometry in and other bands. It tends to be limited to a few months at a time and generally shows variations of about 0.2 mag in . Frequently the light-curves show cycles with intervals of 40 days or so between maxima, though sometimes longer or shorter cycles are present. The light-curve shapes do not repeat. Most of the observations are limited to an observing season of about 100 days.
The general conclusion from the observations is that both light and radial velocity tend to show low-amplitude variations on time scales of the order of 40 days in any given season, but the ‘period’ is quite variable. In view of the different cycle lengths it is not surprising that no evidence has been given that the variations keep phase from one season to another over long time scales, or that any coherent periodicity can be traced over a significant length of time. It is of course, not possible to rule out the hypothesis that the star is undergoing regular coherent pulsations at a level too small to be detected in the available data.
3.3 Search for periodicity in the radial velocities
3.3.1 Periodograms
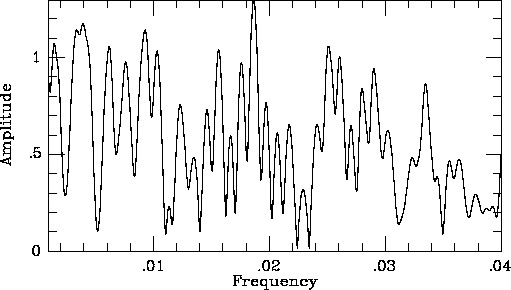
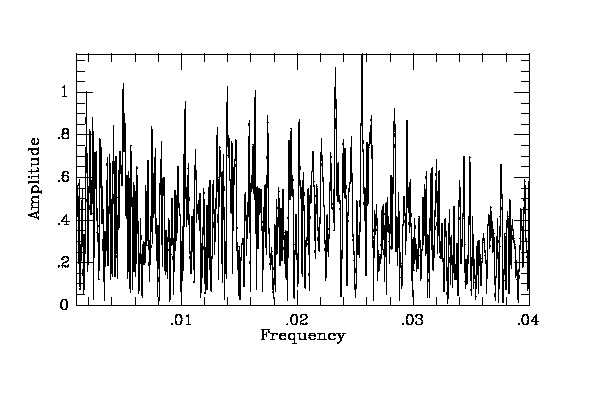
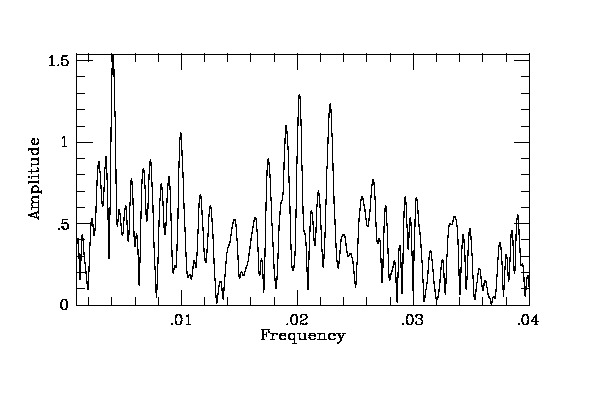
Figures 4 to 6 are periodograms of the data over different time intervals, Fig. 4 is for the Herbig data (except for the isolated 1956 observation). Fig. 5 is for the 1968-1992 Cambridge data together with other data from the literature around that time. Observations during RCB dips have been omitted.
Note that where there is overlap in time between the Cambridge observations and others (e.g. the Gorynya et al. (1992) observations), there is no evidence of zero-point differences. Fig. 6 is for the Coravel velocities, again with data during RCB dips omitted. In the last two cases plots including the RCB-dip phases are not significantly different. There are no outstanding peaks in any of these plots which would indicate a significant coherent periodicity. All the peaks are small and in any case differ from series to series, e.g. 53.7 days in the Herbig plot, 39.0 and 43.0 days in Fig. 5 (which includes the Gorynya et al. data), and 49.4, 44.2 and 52.6 days in the Coravel series. Some evidence for a low-frequency component ( days) in the Coravel series can be traced in the plots of the data against time, but its significance is not clear.
3.3.2 Wavelet analysis
The variability of R CrB is obviously not strictly periodic and we therefore decided to apply a wavelet analysis to look for coherent behaviour that is only transient. To do this we used the WinWWZ package444 WinWWZ was produced by G. Klingenberg and L. Henkel; it can be downloaded from http://www.aavso.org/winwwz. available through the AAVSO. This makes use of the weighted wavelet Z-transform (WWZ) as described by Foster (1996). The wavelet employed is a simple sinusoid plus constant term, applied by sliding a window of predetermined width across the data. Points close to the centre of the window have the highest weight, whereas those near the edges have less weight. The results are output as 3D plots of frequency/time/power. This is particularly useful to reveal periodicities that are only present for a single season.
Note that the temporal coverage is uneven, times of intense ( nightly) observations being interspersed by more sparse observing. Some epochs of sparse coverage are inadequate to search for short periods ( days), and aliasing is potentially a problem.
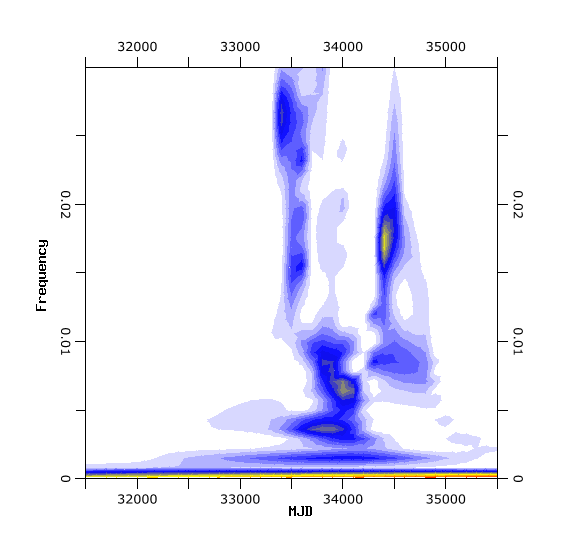
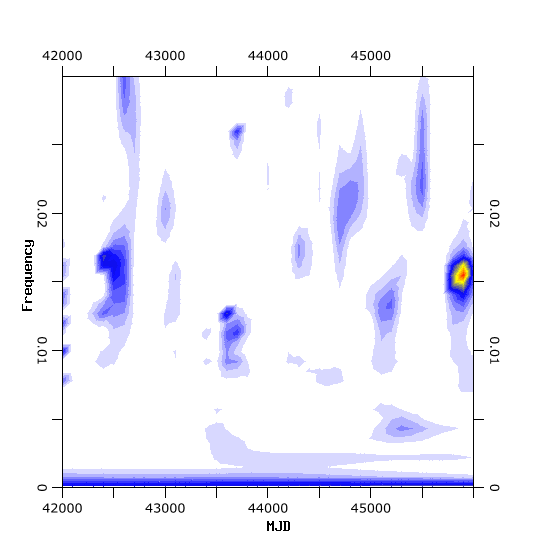
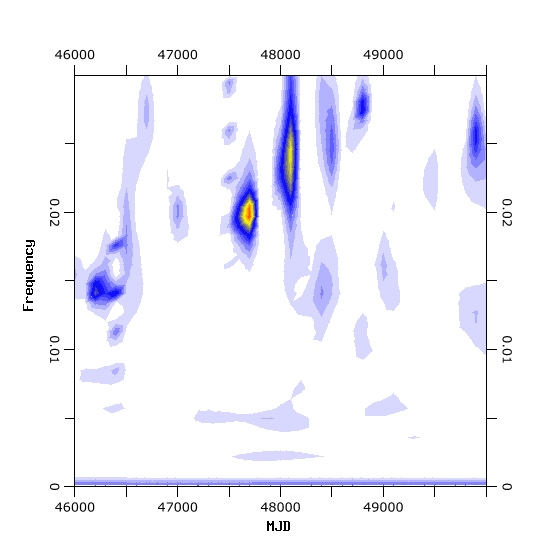
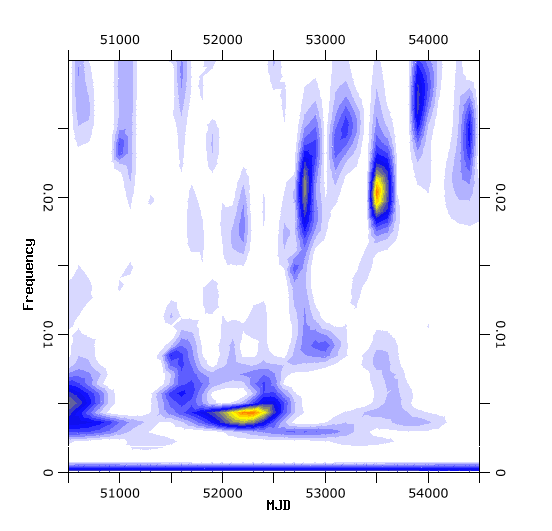
Fig. 7a,b,c,d show the WWZ transform over four time periods. The diagram is blank when there are no data or there is no periodicity in the data.
It is clear that no single period persists through several seasons. In the early data a period of 50 to 60 days (0.016 to 0.019 ) is present around MJD 34400 (Fig. 7a). At MJD 47700 and 48100 periods of 50 days (0.02 ) and 40-45 days (0.024 ), respectively, are prominent. There is an indication that the period changes gradually over four seasons from about 50 days at MJD47700 to about 36 days at 48800 i.e. from 0.02 to 0.028
At MJD 50400 and 52400 (Fig. 7c) periods of 200 and 232 days dominate, but may be artifacts of the gaps in the data.
After 52700 the dominant cycle time seems to take various values between 36 and 50 days (0.028 and 0.02 ) over the last four seasons, as illustrated in Fig. 7d.
3.3.3 A re-examination of earlier data
Rao et al. (1999) carried out a periodogram analysis of their own radial velocities and ones collected from the literature and suggested a period of 42.7 days. Professor Rao has very kindly sent us a list of the velocities used in their analysis. Besides his own, they are primarily from the papers mentioned in section 3.1 (Gorynya et al. 1992, Fernie & Lawson 1993, Rao & Lambert 1997), with a small number of observations from Keenan & Greenstein (1963), Fernie et al. (1972) and Rao (1974). A periodogram of these data shows a peak near 42.7 days but this is by no means outstanding. Most of the series used in the analysis consist of rather few observations; the data are in fact dominated by the observations in 1990/91, particularly the Gorynya et al. series which is among those noted above. Fig. 8 shows the data used by Rao et al. plotted on a 42.7-day period and with the various observations distinguished. It is evident that the Gorynya data dominate the diagram and figs 1 and 2 of their paper show, as already mentioned, that while there is clear cyclic variations with a “period” of 42.97 days in 1990, this is not present in 1991 which gives an uncertain “period” of 33.97. It is clear that the observations in 1990 are sufficiently numerous to commandeer the periodogram. There is little if any sign of such a period in the other data. Evidently whilst cycle lengths of about 40 days have been seen from time to time (as summarized in section 3.1), the data analysed by Rao et al. do not demonstrate that that is a coherent periodicity.

Crause et al. (2007) have suggested that the RCB-type declines of R CrB occur as multiples of a very precise period ( days) which they take as a pulsation period. The above results and those discussed in earlier sections show no significant coherent, long-term, signal at that period. The question is further discussed in section 6 in connection with the nature of RCB-type declines.
3.3.4 Conclusion
The conclusion from all the sets of data is that there appears to be no true periodicity in the radial-velocity measurements, any more than there is in the photometric ones, although R CrB does often show light and velocity variations having a characteristic time-scale of the order of 40 days.
3.4 Further discussion of radial-velocity variability
Although, as just discussed, the radial-velocity data give no indication of a
sustained coherent periodicity, it will be evident from Figs 1 to 3 that at some
epochs there is evidence for cyclical variations,
as is also clear from the wavelet analysis (Figs 7). The following are further brief
notes on those variations as seen in the three series of data. They are in
chronological order in each series.
3.4.1 The 1950–1953 series
A plot (Fig. 1) of the Herbig series shows a velocity range of 19 to 28 . The star was in a major decline from about MJD 34300 to about 34450. The figure gives the impression that the velocity was slightly lower in the first set of observations (roughly 33322–33550) than in the next set (roughly 33650–33900), i.e. before and after the decline.
Clearly that could be affected by the distribution of the points.
The WWZ transform (Fig. 7a) indicates periodicity around 50 to 60 days (about 0.017 ) in the data after the decline (MJD 34400), but nothing else really stands out during this time (MJD 33300 to 34600).
3.4.2 The 1968-1998 series
This is primarily the older Griffin data with other observations, including those of Gorynya et al. 1992, mentioned in section 3.3.3.
1. MJD 42500–42710 (see Fig. 2). The star was fading at the time of the last two points. The observer estimated visual magnitudes of 7.5 and 8 on days 42703 and 42708 and the velocity was evidently declining at that time. At the time of the next observation, day 42801, the star was estimated at 8.6 mag and on the rise. Before the decline, the star shows a cyclical variation between 18 and 27 km s-1. The variation is obviously not regular, but a cycle length of about 60 days is indicated. It would be difficult to fit the observations with a cycle length near 40 days.
2. MJD 44800–44900. As in the last paragraph there is evident irregular cyclical variation (19 to 26 km s-1). The time scale here is roughly 40 to 45 days.
3. MJD 45140–45240. From 45140 to 45160 (section a) the star was near normal brightness, but between about 45214 and 45300 (section b) it went through a very shallow RCB-type decline, being faintest (6.8 mag) on days 45226–45231 as estimated by RFG. The velocities in section a show little sign of regular variability. In section b some rudimentary regularity is seen. A cycle with a period of about 40 days might be present. The most noticeable effect, however, is that the star’s mean velocity in section b is higher than in section a. Alternatively, if section a covered a velocity minimum and such was missed in section b, then the velocity amplitude is unusually high (10 km s-1) in the latter section.
4. MJD 45368-45567. These observations which ended at the start of a decline show two clear velocity minima separated by days and the WWZ transform shows a weak peak from 0.021 to , which must be the same feature (Fig. 7b).
5. The WWZ transform shows a periodicity around MJD45900 of about 65 days (0.016 ) (Fig. 7b).
6. MJD 46400–46800. At the start of this period the star was undergoing a shallow RCB event (days 46456/46489/46496: 6.7/7.5/7.8 mag (RFG)) and the velocity is unusually low. According to the AAVSO light-curve the star was back close to maximum by MJD 46560. Between MJD 46540 and 46720 there is some evidence of cycles but with no definite period.
7. MJD 47200–47900. An RCB event began about MJD 47360. The velocities on the initial drop (days 47361/47369: 6.6/7.5 mag (RFG)) are not low (compare item 6 above). By MJD 47568 the star was on the rise (47569/47603: 8.5/7.3 mag (RFG)). R CrB came out of a deep decline and was restored to normal brightness 47620, but only about 100 days later (MJD 47743) began a decline to a short moderate dip, reaching 8.5 mag 47775. The velocities during that period are covered in Fig. 2. The star is likely to have been slightly below normal light between the two dips.
The WWZ transform shows a period of around 50 days (0.02 ) between these two fading episodes, centred around MJD 47700 (Fig. 7c) During the earlier part of this period Fernie (1990b) has UBV observations. His data cover two successive maxima and he derived a ‘period’ of days, “not significantly different from the customary 43.8 days”. The radial velocity data shown in Fig. 2 might be fitted to a period near 41 days between MJD 47640 and MJD 47730, though with varying mean velocity. However, the earlier and later points (just after and just before declines) would not fit this period and the whole range is consistent with the WWZ result.
8. MJD 47900–48500. This region contains other observations besides the Cambridge one, in particular those of Gorynya et al. The period of 42.97 days (Gorynya et al.) is based on the observations from MJD 47970 to 48104. The WWZ transform shows a strong peak around 48100 extending from 0.022 to 0.026 .

9. MJD 50400–50700. The data are shown in Fig. 9. The observations are from Yudin et al. (2002). At the start of this interval R CrB was slowly completing its recovery from a deep decline, returning to normal brightness about day 50500. The photometric data show cyclical behaviour, with three maxima and three minima and a ‘period’ of roughly 40 days superposed on a general rise. The radial velocities can be regarded as showing a cyclical variation of a similar length with, however, the mean velocity decreasing with time. The periodicity is seen in the WWZ transformation (Fig. 7d) which also shows power at a much longer “period” due to the long-term variation. As in the interval just discussed, light maximum occurs after velocity maximum and about the time when the atmospheric material begins moving away from the star.
3.4.3 The 1999–2007 series
All the observations discussed in this section were obtained with the Coravel instrument. The Coravel data yield measures of radial velocity, equivalent width (EW) and a measure of line width that is expressed as sin as explained at the end of §2.2 above. These are plotted in Fig. 3. In this section we briefly summarize some aspects of these plots which are of relevance for the question of cyclical behaviour. Other aspects will be considered in later sections.
1. MJD 51500–51900 (Fig. 3). At the start of this period the star was on the rise from an RCB-type decline. From about 51590 to 51860 it was near maximum, though about 0.2 mag below its usual maximum brightness. It began dropping again at the end of this interval. Between 51640 and 51710 the star showed large variations in all three quantities, though with no clear periodicity. Radial velocity and sin have their maximum values at closely the same time.
The large variations in EW just before a drop to minimum in 2007 will be discussed below. The variations in the interval under discussion are somewhat smaller, but still well above the average. In view of the 2007 discussion this can be taken as an indication that the type of behaviour discussed in §4.2 is not necessarily followed closely by a decline.
At the end of this interval EW falls as the star goes into a decline. This effect is seen at other declines and is probably due to the filling-in of the lines by the emission spectrum which dominates when the star falls further in light.
2. MJD 52400–52500. During this interval, when the star was well away from declines, there is an apparent cyclical behaviour in RV (three maxima, two minima) of about 41-day length superposed on a marked longer-term decrease in mean velocity.The periodicity is weakly seen in the WWZ transformation (Fig. 7d) where most of the power is in the longer-term variation. Any periodicity immediately before or after this interval must, if present, be of much smaller amplitude. The varying mean velocity is hardly compatible with a simple radial-pulsation model.
3. MJD 52680–52700. Typical decrease in EW as the star goes into a decline.
4. MJD 52740–52960. At the start of this period the star was brightening from an RCB decline. It was back near normal brightness at 52760. Two cycles of large RV range with a cycle length around 45 days are clearly seen and show in the WWZ transform at 0.021 . At the same epoch, sin shows similar variation with maxima following RV maximum by a few days.
5. MJD 53000–53500. Variations in RV on a time scale of the order of 40 days are clear during at least parts of this period. They are shown in the WWZ transform (0.025 ) centred at 53200 (Fig. 7d).
6. MJD 53500–53700. There is clear evidence of cyclical behaviour of RV (3 cycles). The interval between the two clearly defined minima (53521, 53621) is 502 days and shows very strongly in the WWZ transform at 53500 with 0.02 as already noted above. However, the shape and amplitude of the velocity curve clearly changed from cycle to cycle. As before, sin has maxima slightly later than RV.
Further discussion of these data is given in §4.
3.5 Summary of variability at maximum light
The results discussed above may be summarized as follows:
1. There are times when cyclical behaviour on a time scale of 40 days is evident in the radial velocities and sometimes also in . The amplitudes and velocity-curve shapes can, however, differ markedly from cycle to cycle. Earlier work cited in §3.1 is consistent with those findings.
2. Periodograms of long stretches of velocity data as well as a wavelet analysis show no dominant periodicity.
These results seem to rule out a coherent-pulsation model for the observed variations in R CrB. We discuss a physical model for these results below, after first reviewing the Coravel results in more detail.
4 Line shapes in the coravel series
The Coravel series is particularly valuable because it gives the quantities analogous to equivalent width (EW) and broadening ( sin ) of the profile (the ‘dip’). The variation of these quantities has been discussed above (§3.4.3). In addition the profiles of the dip were recorded. These are particularly relevant to our understanding of the RCB phenomenon and in the following sub-sections we concentrate on variations in the line profiles and their implications for phenomena in the stellar atmosphere and the formation and ejection of carbonaceous particles.
We first discuss examples of typical profiles before passing to a detailed account of the great decline of 2007 and its interpretation. We then discuss further examples of profile changes and their interpretation.
4.1 Typical profile behaviour
The next two sections summarize “typical, normal” behaviour at maximum and in decline. In later sections the line shapes at particular epochs and their interpretation are discussed. At other times during the Coravel series the line shapes are within the range discussed in §4.1.1 and are not noticeably asymmetric.
4.1.1 Typical profiles at maximum
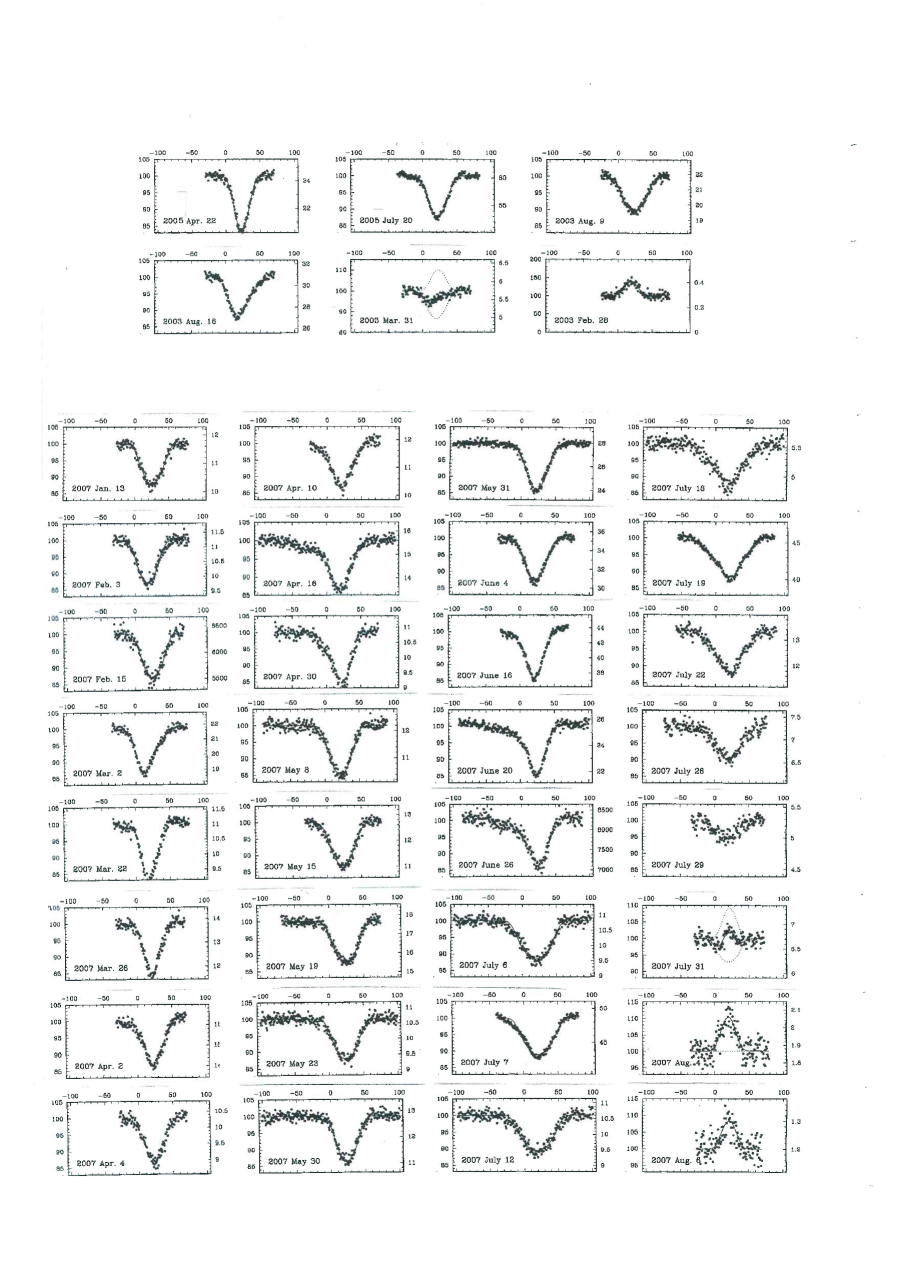
Fig. 10, (1A), (1B) and (1C) illustrates the normal range of Coravel profiles near maximum light.
1B is a typical profile whilst 1A and 1C
show the extremes of width normally encountered.
These profiles are all symmetrical:
(a) Fig. 10 (1B) MJD 53572 (20/7/05) EW = 4.0 : sin = 20.5,
(b) Fig. 10 (1A) MJD 53483 (22/4/05) EW = 4.2 : sin =15,
(c) Fig. 10 (1C) MJD 52861 (09/8/03) EW = 4.0 : sin =25.5
Changes in the profile around maximum are discussed in section 4.4.
4.1.2 Profiles during an RCB-type decline.
(a) Fig. 10 (2C) (28/2/03) MJD 52700. The star was 12 mag (RFG) and nearing the faintest point of an RCB decline, having dropped from maximum by 6 mags (visual) in 20 days. The spectrum is obviously dominated by emission lines (which have been frequently reported during early declines of R CrB and other stars of this class (e.g. Herbig 1949)). The emission spectrum is believed (e.g. Payne-Gaposchkin 1963) to be a permanent feature arising in the outer atmosphere (sometimes referred to as the chromosphere) and seen only when the main body is eclipsed. Its variation at an eclipse by an expanding puff of soot was discussed by Alexander et al. (1972) and Feast (1979) in the case of the RCB star RY Sgr.
(b) Fig. 10 (2B) MJD 52731 (31/3/03). This profile was observed 31 days after the previous one. The star was then on the rise towards maximum with an estimated magnitude of 9.5 (3.5 mag below maximum). The line can be fitted, as shown by the dotted lines, by the combination of emission and absorption lines and with the absorption being displaced to the blue. During the declining phases of the 1948–49 and 1960 RCB events, Herbig (1949) and Payne-Gaposchkin 1963) found evidence for a shift in the opposite sense.
4.2 The Great Decline in 2007: MJD 54163–54319
4.2.1 Observations
In 2007 July, MJD 54291, R CrB went into a rapid decline from which it did not fully recover until long after the interval considered here.
In this section we report and discuss the Coravel data for the 130 days leading up to the decline and the first 20 days of the decline itself.
A striking feature shown in Fig. 3 is the variation of sin and EW as well as the line shapes at that epoch. Fortunately there is some, limited, high-dispersion spectroscopy (Rao & Lambert 2010, = RL10) which is valuable in aiding the interpretation of the Coravel data. The Coravel line profiles show that complex changes were taking place on a time-scale of a few days.
The following is a brief summary of changes taking place during this time together with results from RL10.
Fig. 10 (6A) (2/3/07) MJD 54161. The line profile is not symmetrical. The profile would be
reproduced by a symmetrical line fitted to the lower part of the line555Here and
throughout, blue/red refer to the low/high velocity sides of the profile.,
together with a shallow component on the red side the profile centred at
40 km s-1 (25 km s-1 from the mean).
MJD 54163. RL10 write “Star appears disturbed with emission in some lines
suggesting a component with an inverse P Cygni profile.”
This description, particularly the suggestion of additional red-wing
absorption, would be consistent with the Coravel profile just discussed
(MJD 54161).
Fig. 10 (7A) (22/3/07) MJD 54181. The profile is still asymmetrical near the centre as on MJD 54161
but otherwise more symmetrical; except for the suggestion of a depression
in the blue wing centred at 15 km s-1.
Fig. 10 (4B) (16/4/07) MJD 54206. There is now a very clear extra dip on the blue side. The plot can be fitted assuming two blended profiles. These have the following characteristics:
RV/EW/ sin : Compt. 1, 19.4/4.76/23.5; Compt 2 23.3/1.0/28.0
This profile thus suggests material moving outwards from the star at
43 km s-1.
Fig. 10 (5B) (30/4/07) MJD 54220.
The profile is again asymmetrical but shows distinct differences from the profile
14 days earlier.
MJD 54224. RL10 write “Spectrum similar to typical maximum”.
Fig. 10 (6B) (8/5/07) MJD 54228.
The profile is now symmetrical or nearly so, in contrast with the results on
MJD 54220 and MJD 54206, but in agreement with the spectrum in
RL10 for MJD 54224.
Fig. 10 (8B) (19/5/07) MJD 54239. Profile wide and reasonably symmetrical.
Fig. 10 (9B) (23/5/07) MJD54243. Profile wide and reasonably symmetrical.
MJD 54243. RL10 write “Lines much broader than on JD4224 but no change in EW”. This is
entirely consistent with the trends of sin and EW illustrated in Fig. 10 and
the various profiles discussed above. The text of RL10 seems to imply some line doubling around this time, though details are not given.
Fig. 10 (10B) (30/5/07) MJD 54250.
The profile is symmetrical though there is possibly a small dip at –35 km s-1 on the blue wing.
Fig. 10 (6C) (20/6/07) MJD 54272. The profile is now very asymmetrical, with major additional
absorption to the blue, possibly extending out to almost –100 km s-1 from
the central dip.
Fig. 10 (7C) (26/6/07) MJD 54278. Profile still shows extra absorption to the blue though not now
so prominent.
MJD 54288. RL10 write, “Line doubling. Neutral lines with blue shifted components
and ionized lines with red shifted.” The shift is 28 km s-1.
This was just prior to the start of the decline MJD 54291.
In the following some approximate visual magnitudes are entered
as estimated from the AAVSO light curve.
Fig. 10 (10C) (12/7/07) MJD54294. The profile is symmetrical but now extremely wide
(AAVSO mag).
Fig. 10 (3D) (18/7/70) MJD 54300. The profile is still extremely wide, but more V-shaped
than the fitted profile. That might be due to an additional narrow component
affecting the core. AAVSO mag.
Fig. 10 (4D) (19/7/07) MJD 54301. The next night, with better integration. The profile is
still very wide and shows ‘wavy’ structure about the fitted profile.
Fig. 10 (5D) (22/7/07) MJD 54304. The profile is still very wide and with structure.
AAVSO mag.
Fig. 10 (9D) (4/8/07) MJD 54317. The profile has now gone into emission.
AAVSO mag.
Fig.10 (10D) (6/8/07) MJD 54319.The profile as MJD54317. AAVSO = mag.
4.2.2 Preliminary discussion
The above results show that a major ‘disturbance’ was present in the atmosphere of R CrB for at least 130 days prior to the 2007 RCB-type decline. During most of that interval the AAVSO light-curve shows that there were no large variations in the visual brightness of the star. It is clear that though the nucleation of soot or other particles in the outflow from the star is of considerable interest, it is a by-product of phenomena in the stellar atmosphere which developed over a significant period.
The Coravel data cover periods immediately prior to two other RCB-type declines. Those declines began about MJD 51870 and MJD 52680 and were relatively minor events, the star returning to maximum after approximately 100 days. At the time of writing (September 2015) the 2007 decline has continued for over 3000 days. It was also deeper than the two other events. As can be seen from Fig. 3, no variations in EW or sin of sizes comparable to those observed in the period MJD 54160 to MJD 54300 were seen during those earlier declines. This may suggest that the extent of a decline is related to the level of prior activity in the stellar atmosphere.
The Coravel profiles are averages from hundreds of lines and depend on the fit of the stellar spectrum to the standard that is represented by the cross-correlating mask. Whilst caution is necessary in interpreting the profiles, it is encouraging to see that where high-resolution spectra are available they generally support a straightforward interpretation. Thus a high sin is seen when RL see widened spectral lines, and when profile asymmetries and displaced components are seen, the spectra show high/low- velocity components. It seems safe therefore to attribute the widenings, asymmetries and additional components in the profiles primarily to velocity effects in the stellar atmosphere, as already noted. It has been suggested that the puffs of soot which cause the RCB-type declines ultimately derive from large convective elements in the stellar atmosphere for which a rough estimate suggested a time-scale of about 40 days (Feast 1996). If that is so, the variations in the line profile can be attributed to the combined effects of large turbulent convective elements. Some of them are seen individually as displaced velocity components, whilst other contribute to the general broadening of the profile (as in normal macro-turbulence). Whilst we cannot rule out the possibility that some of the displaced components might be the result of ejection or infall of complete shells, the rapid changes in profile, on a time scale of a few days, may be easier to understand as due to turbulent elements.
Since the velocity of escape from the star is roughly 50 km s-1, the velocities of the displaced components indicate that matter is being raised to considerable distances above the main stellar atmosphere.
During the period just prior to the 2007 minimum and whilst the star was still near maximum light, the Coravel radial velocities show clear evidence of a variation with a ‘period’ of 40 to 45 days (see §3.4.3), but it is of smaller amplitude than variations on the same time-scale elsewhere in the series. The mean velocity at this epoch seems to be slightly negative (by a few km s-1) in comparison with the mean over a much longer interval (see §5). That shows that, although there is evidence of quite high velocities outwards from the star at that time, the velocity integrated over the visible hemisphere is showing only a mild general outward motion.
4.3 Star at maximum in 2006
Coravel observations were obtained on a nearly nightly basis for a long interval in 2006 when the star was away from any major decline. In the present section we discuss the observations from MJD 53909 to 53960. The general trends of radial velocity, EW and sin at that time can be seen from Fig. 3.
The radial velocity goes through a rather smooth
cycle of days with an amplitude of about . sin shows a
comparatively large variation (compared to much of the total record) and
seems to be in phase with the radial velocities. The EW has a rather small
variation which may also be in phase with the radial velocities.
The following is a brief description
of representative Coravel profiles.
MJD 53909. Symmetrical, wide.
MJD 53914. Going asymmetrical.
MJD 53915. Asymmetry very obvious.
MJD 53917. ditto
MJD 53920. Very asymmetrical. It seems possible that the line might be fitted
with two components, the main one having a minimum to the blue of
the fit shown and the other in the red wing at 40 km s-1.
MJD 53926. Less asymmetrical.
MJD 53928. Component in red wing?
MJD 53931. Nearly symmetrical.
MJD 53937. Possibly an extra component in the blue wing.
MJD 53945. Similar structure to MJD 53920.
MJD 53954. Quite asymmetrical.
MJD 53955. Very asymmetrical.
MJD 53957. Possible component in blue wing and also in red wing.
MJD 53957. Wider scan, same night. Clear component
40 km s-1 to blue of main dip.
MJD 53961. Component in red wing at +25 km s-1.
The above series shows that, at maximum light, changes in the profile shape, including asymmetries and the appearance of additional components, can take place on a time scale of a few days.
High-resolution spectroscopy on an almost daily basis is necessary to understand these changes in detail. However, in view of the previous discussion, the simplest hypothesis is to assume that we are seeing the effects of changes due to large turbulent convective cells rising and falling in the atmosphere of the star. Whilst this activity is not as extreme as that seen immediately before the major decline of 2007, it is of the same general nature.
4.4 A further example of profile changes
Fig. 3 shows that from about MJD 52800 to 52900 the radial-velocity amplitude was large and showed a ‘periodicity’ of about 40 days. sin shows large variations which are in phase with the radial velocities. The EWs show only a small change. They may be in anti-phase with the velocities. Fig. 10 (1C) (9/8/03) shows the profile on MJD 52861. Though symmetrical, the width is at the maximum value seen until the 2007 data discussed above. Only seven days later (MJD 52868) the profile is quite asymmetrical (Fig. 10 (2A) (16/8/03) MJD 52868 EW = 4.0: sin = 23).
This is the maximum degree of asymmetry seen in traces other than that observed in the lead-up to the great decline of 2007. Skewness in this sense (‘blended to red’, i.e. line more extended to the red) is seen more often than in the reverse sense, and in normal (full-brightness) times ‘blending to blue’ is never as conspicuous as this.

5 Long-Term Radial-Velocity Behaviour
In Fig. 11 the radial velocities used in the wavelet analysis have been grouped into 100-day bins and plotted against MJD. There is an indication of a variation on a time scale of about ten thousand days. This might suggest that R CrB is a member of a spectroscopic binary. If so, the two components would be well separated and would not interact unless the orbit were highly eccentric.
Most RCB stars show irregular variations in the flux from the surrounding dust shell on a time-scale of several thousand days (Feast et al. 1997). The causes of such variations are not known, but are presumed to be associated with changes in the dust-production mechanism. Magnetic activity has been suggested by analogy with the solar cycle (Clayton et al. 1993). If the primary cause of mass ejection is turbulent eddies, as discussed below, that may be a plausible mechanism, though it clearly needs confirmation.
Unlike all other well-studied RCB stars, in which the long-term dust flux variations are clearly irregular, there is some evidence for semi-regular variations in the case of R CrB with a period of about 1260 days (Feast et al. 1997, fig. 19). Plots of the 100-day means phased on that period show no evidence for a similar variation in the radial velocities.
6 Small scale variability and RCB type declines
The observations reported here show that the radial velocity of R CrB frequently has variations of the order of 10 km s-1 on a time-scale of around 40 days. However, the long time span covered by the observations shows clearly that there is no coherent periodic variation in the data. The shape and amplitude of the velocity curve is very variable. That is consistent with the data in the much shorter previous runs of radial-velocity observations and also of photometry.
This time-scale in the light and velocity variations of R CrB has often been claimed as evidence of radial pulsation, which has been regarded as providing the basic mechanism for the mass ejection associated with RCB events. The observations presented here, however, show that if any strict periodicity exists in the radial velocities it must be of a much lower amplitude than the variations that have been documented. Furthermore the velocities involved are too low to eject material to cool regions where dust could form.
The data from the Coravel series show the complex atmospheric effects which can occur prior to RCB-type declines as well as between declines. These observations are consistent with the presence of large-scale turbulent elements in the stellar atmosphere, in some of which matter attains an outward velocity high enough to carry it sufficiently far from the star to allow the formation of the dust puffs that obscure the star in its characteristic declines. A rough estimate (Feast 1996) indicates that a time-scale of the order of a month, consistent with that of the observed variability, would be associated with those turbulent elements.
It is not known whether the 40–50-day cycles in light and velocity, when they occur, are global or not. However, the hypothesis that the light and velocity variations are related to the integrated effects of a small number of giant turbulent convective cells over the visible side of the star, rather than a global pulsation, is consistent with the view that the ejection of dust puffs is related to turbulent elements.
It has been suggested (Crause et al. 2007) that the deep minima of R CrB repeat regularly as multiples of days, and that has been claimed as evidence for a relationship between a pulsation of that period and the RCB events. The analysis of Crause et al. is based on AAVSO visual observations of 18 declines over 9493 days. The period derived by Gorynya et al. (1992) was adopted from the range of periods in the literature as the one best fitting the observations. The very small uncertainty in the adopted period is required if the declines are to be kept in even approximate phase. The Gorynya et al. period is from 1990 only (it was not seen by them in 1991, see above) and must have a far greater uncertainty than that (see also the discussion in §3.3.3).
The Crause et al. data are relatively sparse. About half the observations refer to multiple declines, when the star undergoes further dimming before it has recovered from an earlier decline or where two declines are close together. In such cases we might expect (as in the light curve at maximum) that some approximate ‘keeping of phase’ would occur if the effect is due to a single convective element or several working together. The scatter is also significant, the range in differences from the predicted decline is from to days and appears to rule out any precise correspondence of declines with the adopted period.
We showed in section 3.3 that there is no sign of a coherent period with the Crause et al. value. Table 4 shows this in a somewhat different way. It lists dates of well-defined radial-velocity minima in the Coravel series (see Fig. 3).
Table 4 also lists the nearest date given by the ephemeris of Crause et al. Since that does not necessarily refer to minimum velocity one might expect a constant offset, if the star varied with the adopted period. Instead one sees from the table that all possible offsets are found, further evidence that the observations give no support to that period. Alternatively one can compare the first well-defined velocity minimum in the older Griffin series (MJD 42584) with a particularly well defined minimum towards the end of the Coravel series (MJD 53178), an interval of 10594 days. With a period of 42.97 days those minima are exactly out of phase (). Changing the period to bring these two minima into phase would destroy even a very approximate correspondence with RCB-type declines.
It seems possible that the effect reported by Crause et al. is a chance phenomenon connected with the small number of independent declines and the fact that the “period” was chosen from the many in the literature as the one fitting the decline data best.
| Observed | Predicted | |
|---|---|---|
| 51594: | 51615 | –21 |
| 51977 | 51958 | +19 |
| 52435 | 52431 | +4 |
| 52477 | 52474 | +3 |
| 52825 | 52818 | +7 |
| 52871 | 52861 | +10 |
| 53178 | 53161 | +17 |
| 53254 | 53247 | +7 |
| 53521 | 53505 | +16 |
| 53622 | 53634 | –12 |
| 53926 | 53935 | –9 |
| 54215: | 54236 | –21 |
It is interesting to compare R CrB with RY Sgr which is also a member of the RCB class. RY Sgr has considerably larger variations in light and radial velocity (0.5 mag, 25 km s-1) than R CrB. Infrared data when the star is in a deep obscuration phase strongly suggest that the variations are global and are due to radial pulsations with a period of about 38.6 days666In principle it would be possible to carry out a similar test in the case of R CrB.. The light and radial-velocity variations do not repeat exactly, indicating some irregular variations superposed on the pulsations (see Alexander et al. 1972, their figs. 3 to 8). Although RY Sgr shows much clearer and larger-amplitude pulsations than any other known RCB star it does not stand out as a dust producer. That has long been seen as a problem in attributing dust production to pulsational ejection of matter. In view of the discussion above it seems reasonable to postulate that, as in R CrB, the primary ejection mechanism is associated with large atmospheric turbulent elements, though certain phases in the pulsation cycle of RY Sgr might be favoured777In the case of RY Sgr, at least, a different problem occurs in the phasing of the light declines. Evidently if decline occurs between pulsation maximum and minimum it will tend to appear to start near maximum. If it starts between minimum and maximum it will appear to start nearer maximum than was actually the case, owing to the increase in light from the pulsation. Any statistics of phasing of declines would need to take this into account..
Clearly it is not possible to rule out the hypothesis that R CrB is undergoing some regular pulsations of very low amplitude, but the current data do not require that hypothesis and such a low amplitude could not provide the velocities necessary to eject matter from the star.
7 Final Conclusions
The observations reported in this paper are not consistent with a coherent pulsational model for R CrB. At certain times and especially before the great decline of 2007, there is evidence that the atmosphere is disturbed, with high-velocity components in the line profiles. We suggest that they are connected with large turbulent elements in the stellar atmosphere and result in mass ejection to sufficient distance from the star that solid particles can be formed leading to an RCB-type decline. Once solids are formed, radiation pressure will drive the dust and entrained gas from the star at velocities of 200 km s-1 or more, as is observed. A few large turbulent, convective cells with a characteristic turn-over time of 40 days, appear to provide a suitable explanation of the light and radial-velocity variations seen in R CrB outside RCB-type declines.
Acknowledgments
MWF and PAW gratefully acknowledge the receipt of research grants from the National Research Foundation (NRF) of South Africa. MWF thanks Dr L Balona for some help with the data for the early years.
References
- [] Alexander J.B., Andrews P.J., Catchpole R.M., Feast M.W., Lloyd Evans T., Menzies J.W., Wisse P.N.J., Wisse M., 1972, MNRAS, 158, 305
- [] Baranne M., Mayor M., Poncet L.-L., 1979, Vistas Astr., 23, 279
- [] Bright S. N., Chesneau O., Clayton G. C., De Marco O., Leão I. C., Nordhaus J., Gallagher J. S., 2011, MNRAS, 414, 1195
- [] Clayton G. C., 1996, PASP, 108, 225
- [] Clayton G. C., Kerber F., Gordon K. D., Lawson W. A., Wolff M. J., Pollacco D. L., Furlan E., 1999, ApJ, 517, L143
- [] Clayton G. C., Whitney B. A., Mattei J. A., 1993, PASP, 105, 832
- [] Crause L. A., Lawson W. A., Henden A., 2007, MNRAS, 375, 301
- [] Feast M.W., 1979, in: Changing trends in variable star research, IAU Coll. 46, (ed.) F.M. Bateson, University of Waikato, New Zealand, p. 246
- [] Feast M.W., 1986, in: Hydrogen deficient stars and related objects, (ed.) K. Hunger, D. Shönberner, N. K. Rao, Reidel, Dordrecht p. 151
- [] Feast M.W. 1996, in: Hydrogen deficient stars, (ed.) C. S. Jeffery, U. Heber, Ast. Soc. Pacif. Conf. Ser. 96, p. 3
- [] Feast M. W., Carter B. S., Roberts G., Marang F., Catchpole R. M. 1997, MNRAS, 285, 317
- [] Fernie J. D., Sherwood V., DuPuy D. L., 1972, ApJ, 172, 383
- [] Fernie J. D., 1982, PASP, 94, 172
- [] Fernie J. D., Percy J. R., Richer G., 1986, PASP, 98, 605
- [] Fernie J. D., 1989, PASP, 101, 166
- [] Fernie J. D., 1990a, PASP, 102, 162
- [] Fernie J. D., 1990b, PASP, 102, 1146
- [] Fernie J. D., 1991, PASP, 103, 1091
- [] Fernie J. D., Lawson W. A., 1993, MNRAS, 265, 899
- [] Fernie J. D., Seager S., 1994, PASP, 106, 1138
- [] Fletcher J. M., Harris H. C., McClure R. D., Scarfe C.D., 1982, PASP, 94, 1017
- [] Forrest W. J., Gillett F. C., Stein W. A., 1971, ApJ, 170, 29
- [] Foster, G., 1996, AJ, 112, 1709
- [] Fujimoto M. Y., 1977, PASJ, 29, 331
- [] Gillett F. C., Backman D. E., Beichman C., Neugebauer G., 1986, ApJ, 310, 842
- [] Gorynya N. A., Rastorguev A. S., Samus N. N., 1992, Sov. Astron. Lett. 18(2), 142
- [] Grenfell T. C., Wallerstein G., 1969, PASP, 81, 732
- [] Griffin R. F., 1967, ApJ, 148, 465
- [] Griffin R. F., 1968, A Photometric Atlas of the Spectrum of Arcturus, Cambridge Philosophical Society, Cambridge
- [] Griffin R. F., Gunn J. E., 1974, ApJ, 191, 545
- [] Hartmann J., 1906, ApJ, 24, 285
- [] Herbig G. H., 1949, ApJ, 110, 143
- [] Jeffers S. V., Min M., Waters L. B. F. M., Canovas H., Rodenhuis M., deJuan Ovelar M., Chies-Santos A. L., Keller C. U., 2012, A&A, 539, A56
- [] Keenan P. C., Greenstein J. L., 1963, Contrib. Perkins Obs. Ser II, No.13
- [] Lawson W. A., 1991, MNRAS, 253, 625
- [] Montiel E. J, Clayton G. C., Marcello D. C., Lockman F. J., 2015, AJ, 150, 14
- [] Moore J. H., 1935, in R.G.Aitken, The Binary Stars, 2nd edition, McGraw-Hill, New York, p.147
- [] Payne-Gaposchkin C., 1963, ApJ, 138, 320
- [] Pearce J. A., 1957, Trans IAU, 9, 441
- [] Pigott E., 1795, Phil.Trans.Roy.Soc., 87, 133
- [] Rao N. K., 1974, PhD Thesis, Univ. Calif. Santa Cruz
- [] Rao N. K, Lambert D. L., 1994, J. Astrophys.Astr., 15,47
- [] Rao N. K., Lambert D. L., 1997, MNRAS, 284, 489
- [] Rao N. K et al., 1999, MNRAS, 310, 717
- [] Rao N. K., Lambert D. L., 2010, in: Proc. Recent advances in spectroscopy, astrophysics and space science, Springer-Verlag, Berlin177 (ArXiv 1002.3433)
- [] Redman R .O., 1945, MNRAS, 105, 212
- [] Renzini A., 1979 in: Stars and Stellar Systems, (ed.) B. E. Westerlund, Reidel, Dordrecht, p.155
- [] Tempesti P., De Santis R., 1975, Mem.Soc.Ast.Ital., 46, 443
- [] Webbink R. F., 1984, ApJ, 277, 355
- [] Wdowiak T .J., 1975, ApJL, 198, 139
- [] Yudin B. F., Fernie J. D., Ikhsanov N. R., Shenavrin V. I., Weigelt G., 2002, A&A, 394, 617
Appendix A Tables of R CrB radial velocities
A.1 Table A1
The (heliocentric) radial velocities, Vel (km s-1 ), of R CrB discussed in section 2.1, with the MJD on which they were obtained; note: “0.5” indicates an underexposed spectrogram.
| MJD | Vel | note |
|---|---|---|
| 33321.53 | 23.0 | |
| 33383.40 | 27.9 | |
| 33390.44 | 24.6 | |
| 33397.33 | 23.2 | |
| 33413.23 | 25.2 | |
| 33424.23 | 27.2 | |
| 33433.21 | 21.3 | |
| 33446.24 | 22.5 | |
| 33451.21 | 24.2 | |
| 33452.19 | 24.3 | |
| 33458.31 | 25.3 | |
| 33467.27 | 24.8 | |
| 33476.20 | 24.0 | |
| 33483.21 | 25.2 | |
| 33496.20 | 24.6 | 0.5 |
| 33506.19 | 19.7 | |
| 33513.18 | 18.9 | |
| 33517.17 | 20.7 | |
| 33525.16 | 24.2 | |
| 33535.16 | 27.1 | |
| 33536.14 | 27.5 | 0.5 |
| 33546.14 | 22.7 | |
| 33553.14 | 23.2 | |
| 33653.56 | 25.6 | |
| 33671.51 | 24.7 | |
| 33678.51 | 24.3 | |
| 33716.43 | 21.4 | |
| 33720.43 | 21.5 | |
| 33729.35 | 24.5 | |
| 33775.31 | 25.4 | |
| 33776.41 | 25.8 | 0.5 |
| 33786.47 | 20.7 | |
| 33805.21 | 25.7 | |
| 33808.36 | 25.2 | |
| 33814.28 | 23.2 | |
| 33818.31 | 21.6 | |
| 33822.31 | 23.3 | |
| 33825.26 | 22.6 | |
| 33830.27 | 23.9 | 0.5 |
| 33832.25 | 24.4 | 0.5 |
| 33836.24 | 23.6 | |
| 33839.25 | 23.5 | |
| 33845.19 | 23.6 | |
| 33850.18 | 24.9 | |
| 33854.21 | 26.0 | |
| 33858.19 | 28.2 | |
| 33862.30 | 27.1 | |
| 33865.19 | 26.6 | |
| 33874.17 | 28.4 | |
| 33878.17 | 27.0 | |
| 33882.22 | 25.9 | |
| 33885.17 | 25.0 | 0.5 |
| 33892.17 | 26.7 | |
| 33895.16 | 27.5 | |
| 33900.16 | 27.5 | |
| 33916.16 | 28.5 | |
| 34433.48 | 26.6 | |
| 34450.41 | 28.0 | |
| 34466.50 | 23.9 | |
| 34467.45 | 23.1 | |
| 34470.50 | 22.4 | |
| 34478.50 | 22.5 | |
| 34482.51 | 23.6 | |
| 34488.46 | 24.5 | |
| 34492.44 | 26.5 | |
| 34502.35 | 25.9 | |
| 34509.41 | 24.3 | |
| 34525.29 | 25.4 | 0.5 |
| 34542.31 | 26.0 | |
| 34551.29 | 26.6 | |
| 34559.25 | 25.7 | |
| 34573.35 | 25.5 | |
| 34584.27 | 23.1 |
A.2 Table A2
MJD and radial velocities, Vel (km s-1), of R CrB by R. Griffin using various telescopes coded as follows: 218 Palomar, 303 OHP, 123 ESO, 219 DAO, 202 Original Cambridge, 302 Cambridge Coravel, Uncoded Cambridge Coravel. An o in the note column indicates that the observation was made during a faint phase.
| MJD | note | Vel | code |
|---|---|---|---|
| 39970.04 | 26.4 | 202 | |
| 40328.12 | 26.0 | 202 | |
| 40671.17 | 29.7 | 202 | |
| 40676.17 | 24.8 | 202 | |
| 40787.89 | 24.2 | 202 | |
| 40797.90 | 25.9 | 202 | |
| 40996.17 | 19.8 | 202 | |
| 41150.89 | 26.9 | 202 | |
| 41514.93 | 25.3 | 202 | |
| 41798.11 | 25.2 | 202 | |
| 42152.09 | o | 27.7 | 202 |
| 42200.43 | o | 23.6 | 218 |
| 42249.95 | 26.6 | 202 | |
| 42280.86 | 19.4 | 202 | |
| 42312.79 | 28.7 | 202 | |
| 42510.07 | 22.5 | 202 | |
| 42512.12 | 23.4 | 202 | |
| 42522.08 | 21.6 | 202 | |
| 42532.01 | 22.6 | 202 | |
| 42535.06 | 24.3 | 202 | |
| 42536.99 | 23.6 | 202 | |
| 42554.49 | 26.9 | 218 | |
| 42563.02 | 24.8 | 202 | |
| 42568.01 | 25.3 | 202 | |
| 42568.96 | 22.3 | 202 | |
| 42569.94 | 25.2 | 202 | |
| 42570.98 | 23.2 | 202 | |
| 42571.90 | 23.2 | 202 | |
| 42572.90 | 21.2 | 202 | |
| 42574.90 | 21.4 | 202 | |
| 42575.96 | 21.6 | 202 | |
| 42579.04 | 21.8 | 202 | |
| 42580.98 | 19.8 | 202 | |
| 42583.97 | 18.5 | 202 | |
| 42584.94 | 20.0 | 202 | |
| 42585.89 | 19.0 | 202 | |
| 42586.89 | 20.2 | 202 | |
| 42588.01 | 21.4 | 202 | |
| 42588.90 | 20.9 | 202 | |
| 42592.02 | 20.8 | 202 | |
| 42592.90 | 22.7 | 202 | |
| 42595.89 | 25.0 | 202 | |
| 42626.89 | 27.4 | 202 | |
| 42630.86 | 24.8 | 202 | |
| 42637.85 | 22.4 | 202 | |
| 42648.87 | 19.0 | 202 | |
| 42649.86 | 21.5 | 202 | |
| 42650.85 | 20.5 | 202 | |
| 42652.84 | 21.8 | 202 | |
| 42660.84 | 23.1 | 202 | |
| 42670.82 | 25.6 | 202 | |
| 42675.85 | 21.4 | 202 | |
| 42676.78 | 23.4 | 202 | |
| 42685.84 | 19.8 | 202 | |
| 42703.75 | o | 16.8 | 202 |
| 42708.74 | o | 16.3 | 202 |
| 42801.25 | o | 26.6 | 202 |
| 42838.16 | o | 27.6 | 202 |
| 42872.07 | 21.6 | 202 | |
| 42887.94 | 25.6 | 202 | |
| 42891.05 | 22.7 | 202 | |
| 42902.06 | 22.2 | 202 | |
| 42934.93 | 21.2 | 202 | |
| 42935.97 | 23.6 | 202 | |
| 42941.98 | 26.4 | 202 | |
| 42980.90 | 21.9 | 202 | |
| 42985.90 | 22.7 | 202 | |
| 42987.88 | 24.4 | 202 | |
| 42990.87 | 23.9 | 202 | |
| 43005.84 | 21.4 | 202 | |
| 43006.85 | 20.8 | 202 | |
| 43009.84 | 21.0 | 202 | |
| 43039.82 | 26.6 | 202 | |
| 43047.78 | 24.5 | 202 | |
| 43055.78 | 23.3 | 202 | |
| 43178.21 | 25.4 | 202 | |
| 43180.18 | 23.7 | 202 | |
| 43593.09 | 28.0 | 202 | |
| 43598.10 | 28.1 | 202 | |
| 43679.97 | 26.7 | 202 | |
| 43736.84 | 17.8 | 202 | |
| 43739.84 | 20.6 | 202 | |
| 43886.24 | 21.8 | 202 | |
| 43929.21 | 25.4 | 202 | |
| 43944.14 | 25.9 | 202 | |
| 43988.07 | 26.1 | 202 | |
| 43996.04 | 22.2 | 202 | |
| 44007.02 | 21.9 | 202 | |
| 44017.00 | 23.8 | 202 | |
| 44113.83 | 19.9 | 202 | |
| 44137.79 | 19.8 | 202 | |
| 44232.30 | 23.4 | 202 | |
| 44238.23 | 22.1 | 202 | |
| 44240.31 | 21.2 | 202 | |
| 44292.19 | 23.2 | 202 | |
| 44363.00 | 23.4 | 202 | |
| 44365.03 | 23.4 | 202 | |
| 44368.05 | 23.9 | 202 | |
| 44369.98 | 25.8 | 202 | |
| 44372.02 | 23.2 | 202 | |
| 44374.03 | 23.9 | 202 | |
| 44376.04 | 25.9 | 202 | |
| 44378.02 | 27.7 | 202 | |
| 44389.00 | 28.4 | 202 | |
| 44398.03 | 25.7 | 202 | |
| 44417.40 | 21.5 | 218 | |
| 44434.90 | 25.5 | 202 | |
| 44441.91 | 23.4 | 202 | |
| 44444.89 | 22.7 | 202 | |
| 44447.94 | 26.9 | 202 | |
| 44471.87 | 22.2 | 202 | |
| 44477.83 | 25.0 | 202 | |
| 44482.82 | 22.8 | 202 | |
| 44488.84 | 27.9 | 202 | |
| 44503.80 | 30.2 | 202 | |
| 44506.80 | 30.1 | 202 | |
| 44516.78 | 26.5 | 202 | |
| 44521.77 | 25.6 | 202 | |
| 44526.80 | 27.3 | 202 | |
| 44545.73 | 28.8 | 202 | |
| 44559.71 | 26.0 | 202 | |
| 44561.71 | 24.7 | 202 | |
| 44580.27 | 22.8 | 202 | |
| 44621.29 | 22.6 | 202 | |
| 44676.15 | 20.1 | 202 | |
| 44712.08 | 20.8 | 202 | |
| 44727.02 | 17.6 | 202 | |
| 44729.06 | 16.9 | 202 | |
| 44743.43 | 29.4 | 218 | |
| 44748.91 | 28.9 | 202 | |
| 44753.97 | 28.8 | 202 | |
| 44776.90 | 21.6 | 202 | |
| 44783.96 | 20.7 | 202 | |
| 44789.94 | 22.3 | 202 | |
| 44801.92 | 24.4 | 202 | |
| 44803.95 | 24.0 | 202 | |
| 44811.87 | 23.4 | 202 | |
| 44814.87 | 19.6 | 202 | |
| 44818.87 | 20.3 | 202 | |
| 44826.85 | 19.3 | 202 | |
| 44832.86 | 22.3 | 202 | |
| 44842.84 | 26.2 | 202 | |
| 44859.80 | 22.2 | 202 | |
| 44860.82 | 18.7 | 202 | |
| 44865.84 | 20.5 | 202 | |
| 44868.83 | 23.2 | 202 | |
| 44872.83 | 21.7 | 202 | |
| 44879.79 | 24.5 | 202 | |
| 44889.79 | 25.7 | 202 | |
| 44893.76 | 24.1 | 202 | |
| 44979.29 | 24.4 | 202 | |
| 44990.27 | 26.2 | 202 | |
| 45032.18 | 24.4 | 202 | |
| 45044.14 | 27.1 | 202 | |
| 45074.05 | 22.4 | 202 | |
| 45093.04 | 23.9 | 202 | |
| 45096.05 | 23.6 | 202 | |
| 45100.95 | 23.6 | 202 | |
| 45112.99 | 23.9 | 202 | |
| 45115.02 | 25.4 | 202 | |
| 45118.97 | 25.6 | 202 | |
| 45143.02 | 21.1 | 202 | |
| 45145.99 | 23.4 | 202 | |
| 45148.96 | 22.7 | 202 | |
| 45149.96 | 21.9 | 202 | |
| 45153.95 | 20.5 | 202 | |
| 45157.91 | 18.9 | 202 | |
| 45159.95 | 19.7 | 202 | |
| 45165.99 | 21.7 | 202 | |
| 45169.88 | 19.1 | 202 | |
| 45176.88 | 20.2 | 202 | |
| 45192.90 | 25.3 | 202 | |
| 45212.84 | 24.0 | 202 | |
| 45214.83 | o | 26.6 | 202 |
| 45225.84 | o | 29.0 | 202 |
| 45230.84 | o | 29.7 | 202 |
| 45233.79 | o | 27.4 | 202 |
| 45235.85 | o | 26.0 | 202 |
| 45269.73 | 27.4 | 202 | |
| 45368.58 | 18.9 | 219 | |
| 45369.60 | 18.4 | 219 | |
| 45383.50 | 22.1 | 219 | |
| 45388.18 | 23.2 | 202 | |
| 45404.16 | 22.0 | 202 | |
| 45408.15 | 19.8 | 202 | |
| 45440.07 | 25.5 | 202 | |
| 45446.00 | 27.2 | 202 | |
| 45448.08 | 25.9 | 202 | |
| 45457.95 | 22.6 | 202 | |
| 45464.05 | 21.6 | 202 | |
| 45470.01 | 22.6 | 202 | |
| 45471.04 | 23.7 | 202 | |
| 45479.01 | 27.6 | 202 | |
| 45491.97 | 29.3 | 202 | |
| 45493.98 | 27.4 | 202 | |
| 45497.96 | 23.1 | 202 | |
| 45499.99 | 22.7 | 202 | |
| 45506.90 | 20.3 | 202 | |
| 45515.94 | 23.5 | 202 | |
| 45517.95 | 24.4 | 202 | |
| 45519.94 | 27.6 | 202 | |
| 45527.90 | 30.3 | 202 | |
| 45536.88 | 25.1 | 202 | |
| 45544.88 | 22.6 | 202 | |
| 45548.88 | 23.1 | 202 | |
| 45549.89 | 23.5 | 202 | |
| 45557.87 | 27.4 | 202 | |
| 45564.95 | 22.9 | 202 | |
| 45566.92 | 22.8 | 202 | |
| 45804.11 | o | 27.2 | 202 |
| 45807.10 | o | 23.9 | 202 |
| 45814.06 | o | 29.5 | 202 |
| 45816.07 | o | 27.7 | 202 |
| 45818.09 | o | 26.6 | 202 |
| 45829.06 | o | 21.8 | 202 |
| 45833.03 | o | 24.9 | 202 |
| 45859.95 | o | 25.3 | 202 |
| 45892.94 | o | 17.0 | 202 |
| 45909.88 | 19.0 | 202 | |
| 45932.85 | 21.1 | 202 | |
| 45942.84 | 27.7 | 202 | |
| 45944.87 | 28.7 | 202 | |
| 45947.83 | 28.5 | 202 | |
| 45965.80 | 24.4 | 202 | |
| 45972.77 | 20.6 | 202 | |
| 46055.30 | 22.0 | 202 | |
| 46077.29 | 24.9 | 202 | |
| 46089.24 | 23.9 | 202 | |
| 46113.56 | 18.9 | 219 | |
| 46120.18 | 18.2 | 202 | |
| 46135.19 | 23.8 | 202 | |
| 46216.00 | 25.1 | 202 | |
| 46217.97 | 24.5 | 202 | |
| 46248.95 | 18.4 | 202 | |
| 46249.93 | 16.8 | 202 | |
| 46252.93 | 18.6 | 202 | |
| 46263.04 | 19.7 | 202 | |
| 46266.97 | 20.8 | 202 | |
| 46314.86 | o | 22.7 | 202 |
| 46323.87 | o | 24.3 | 202 |
| 46455.24 | o | 21.8 | 202 |
| 46488.20 | o | 14.6 | 202 |
| 46495.14 | o | 12.9 | 202 |
| 46525.11 | o | 24.5 | 303 |
| 46530.16 | o | 21.3 | 303 |
| 46556.05 | 23.3 | 202 | |
| 46563.05 | 25.0 | 202 | |
| 46564.04 | 25.9 | 202 | |
| 46566.03 | 25.9 | 202 | |
| 46567.01 | 25.8 | 202 | |
| 46569.03 | 26.5 | 202 | |
| 46576.01 | 25.2 | 202 | |
| 46577.01 | 23.4 | 202 | |
| 46579.00 | 24.9 | 202 | |
| 46580.92 | 23.5 | 202 | |
| 46584.97 | 24.8 | 202 | |
| 46591.97 | 18.2 | 202 | |
| 46592.96 | 20.7 | 202 | |
| 46593.92 | 19.0 | 202 | |
| 46595.96 | 19.3 | 202 | |
| 46610.95 | 22.9 | 202 | |
| 46614.97 | 24.7 | 202 | |
| 46634.89 | 25.8 | 202 | |
| 46648.89 | 26.5 | 202 | |
| 46658.95 | 25.3 | 202 | |
| 46664.83 | 24.2 | 303 | |
| 46665.87 | 22.8 | 303 | |
| 46666.87 | 23.6 | 303 | |
| 46667.85 | 24.2 | 303 | |
| 46670.87 | 22.8 | 303 | |
| 46689.82 | 28.4 | 202 | |
| 46691.81 | 29.2 | 202 | |
| 46698.79 | 26.7 | 202 | |
| 46701.85 | 27.5 | 202 | |
| 46707.77 | 21.7 | 202 | |
| 46714.76 | 22.1 | 202 | |
| 46740.73 | 21.8 | 202 | |
| 46742.72 | 20.8 | 202 | |
| 46746.72 | 21.5 | 202 | |
| 46749.71 | 20.5 | 202 | |
| 46776.29 | 24.3 | 202 | |
| 46826.24 | 20.7 | 202 | |
| 46845.23 | 21.9 | 202 | |
| 46847.21 | 23.1 | 202 | |
| 46850.24 | 25.5 | 202 | |
| 46855.21 | 22.4 | 303 | |
| 46857.23 | 22.4 | 303 | |
| 46859.15 | 21.8 | 303 | |
| 46874.11 | 24.1 | 202 | |
| 46876.17 | 23.2 | 202 | |
| 46880.13 | 23.8 | 202 | |
| 46912.99 | 19.1 | 202 | |
| 46917.06 | 20.2 | 202 | |
| 46920.03 | 22.7 | 202 | |
| 46923.05 | 25.8 | 202 | |
| 46924.02 | 25.9 | 202 | |
| 46931.02 | 24.1 | 202 | |
| 46934.98 | 22.9 | 202 | |
| 46947.00 | 19.2 | 202 | |
| 46949.98 | 20.0 | 202 | |
| 46968.95 | 23.2 | 202 | |
| 46970.94 | 23.8 | 202 | |
| 46979.95 | 28.3 | 202 | |
| 46981.97 | 29.0 | 202 | |
| 47052.84 | 18.9 | 202 | |
| 47062.84 | 19.8 | 202 | |
| 47074.78 | 24.8 | 202 | |
| 47080.74 | 25.8 | 303 | |
| 47085.73 | 23.7 | 303 | |
| 47089.74 | 22.7 | 202 | |
| 47090.75 | 23.6 | 202 | |
| 47092.74 | 22.4 | 202 | |
| 47096.74 | 20.3 | 202 | |
| 47137.27 | 24.8 | 202 | |
| 47139.29 | 23.5 | 202 | |
| 47151.29 | 22.3 | 202 | |
| 47168.24 | 23.6 | 202 | |
| 47183.61 | 29.6 | 219 | |
| 47190.57 | 29.9 | 219 | |
| 47192.62 | 30.2 | 219 | |
| 47231.22 | 19.8 | 303 | |
| 47232.14 | 18.9 | 303 | |
| 47234.17 | 19.4 | 303 | |
| 47242.18 | 22.9 | 202 | |
| 47260.95 | 22.3 | 202 | |
| 47264.09 | 23.2 | 202 | |
| 47277.08 | 20.1 | 202 | |
| 47287.95 | 19.9 | 202 | |
| 47300.98 | 21.4 | 202 | |
| 47302.97 | 23.6 | 202 | |
| 47307.96 | 22.6 | 202 | |
| 47309.91 | 21.5 | 202 | |
| 47314.99 | 21.2 | 202 | |
| 47318.96 | 21.3 | 202 | |
| 47324.96 | 19.3 | 202 | |
| 47334.93 | 22.8 | 202 | |
| 47349.05 | 26.0 | 202 | |
| 47353.93 | 27.1 | 202 | |
| 47357.92 | 26.0 | 202 | |
| 47360.88 | o | 24.0 | 202 |
| 47368.89 | o | 30.4 | 202 |
| 47467.75 | o | 29.9 | 303 |
| 47470.74 | o | 31.5 | 303 |
| 47568.23 | o | 32.4 | 202 |
| 47580.42 | o | 22.2 | 123 |
| 47582.41 | o | 22.5 | 123 |
| 47603.10 | o | 28.7 | 202 |
| 47612.15 | o | 24.1 | 303 |
| 47614.16 | o | 23.5 | 303 |
| 47644.10 | 18.3 | 303 | |
| 47646.13 | 18.7 | 303 | |
| 47649.09 | 20.0 | 303 | |
| 47665.92 | 25.9 | 202 | |
| 47673.00 | 23.2 | 202 | |
| 47676.99 | 18.7 | 202 | |
| 47679.00 | 16.8 | 202 | |
| 47681.96 | 15.3 | 202 | |
| 47689.93 | 16.0 | 202 | |
| 47695.95 | 18.0 | 202 | |
| 47700.94 | 22.4 | 202 | |
| 47702.94 | 22.0 | 202 | |
| 47710.00 | 27.1 | 202 | |
| 47711.94 | 27.1 | 202 | |
| 47718.94 | 24.7 | 202 | |
| 47731.91 | o | 21.3 | 202 |
| 47741.91 | o | 24.1 | 202 |
| 47743.87 | o | 23.3 | 202 |
| 47750.90 | o | 32.0 | 202 |
| 47765.84 | o | 30.5 | 202 |
| 47775.87 | o | 27.0 | 202 |
| 47816.75 | o | 23.8 | 202 |
| 47826.75 | o | 27.8 | 303 |
| 47828.76 | o | 29.3 | 303 |
| 47830.72 | o | 29.2 | 303 |
| 47831.72 | o | 28.2 | 303 |
| 47834.73 | o | 26.2 | 202 |
| 47841.73 | 24.1 | 202 | |
| 47846.71 | 20.2 | 202 | |
| 47918.25 | 26.6 | 303 | |
| 47922.21 | 23.4 | 303 | |
| 47934.41 | 25.4 | 123 | |
| 47936.41 | 26.1 | 123 | |
| 47963.47 | 21.4 | 219 | |
| 47977.09 | 28.8 | 202 | |
| 47979.11 | 28.1 | 202 | |
| 47986.08 | 25.2 | 202 | |
| 47999.06 | 20.2 | 202 | |
| 48010.08 | 22.2 | 202 | |
| 48012.03 | 22.5 | 202 | |
| 48014.97 | 25.5 | 202 | |
| 48028.06 | 26.0 | 202 | |
| 48035.93 | 19.7 | 202 | |
| 48038.00 | 18.1 | 202 | |
| 48061.96 | 28.1 | 202 | |
| 48074.99 | 22.6 | 202 | |
| 48077.91 | 19.8 | 202 | |
| 48080.90 | 19.8 | 202 | |
| 48083.96 | 17.8 | 202 | |
| 48085.94 | 18.2 | 202 | |
| 48090.92 | 21.2 | 202 | |
| 48096.95 | 24.1 | 202 | |
| 48170.83 | 25.2 | 202 | |
| 48189.73 | 21.7 | 202 | |
| 48229.28 | 20.6 | 202 | |
| 48282.19 | 22.8 | 303 | |
| 48283.20 | 23.0 | 303 | |
| 48284.22 | 22.6 | 303 | |
| 48285.21 | 22.9 | 303 | |
| 48286.21 | 23.1 | 303 | |
| 48290.21 | 23.8 | 303 | |
| 48292.23 | 22.4 | 303 | |
| 48349.05 | 24.4 | 202 | |
| 48385.04 | 19.9 | 202 | |
| 48399.04 | 25.6 | 202 | |
| 48401.01 | 23.1 | 202 | |
| 48418.00 | 24.5 | 202 | |
| 48420.99 | 23.9 | 202 | |
| 48452.90 | 22.7 | 202 | |
| 48455.92 | 21.5 | 202 | |
| 48460.97 | 20.0 | 202 | |
| 48465.88 | 20.8 | 202 | |
| 48557.73 | 23.9 | 303 | |
| 48561.72 | 24.1 | 303 | |
| 48607.25 | 27.5 | 303 | |
| 48609.25 | 26.1 | 303 | |
| 48636.25 | 24.4 | 303 | |
| 48639.26 | 24.2 | 303 | |
| 48641.26 | 24.5 | 303 | |
| 48678.56 | 25.1 | 219 | |
| 48680.53 | 24.3 | 219 | |
| 48734.11 | 26.5 | 303 | |
| 48736.11 | 24.0 | 303 | |
| 48738.11 | 21.6 | 303 | |
| 48739.12 | 21.1 | 303 | |
| 48741.12 | 19.7 | 303 | |
| 48743.12 | 19.4 | 303 | |
| 48793.05 | 26.1 | 303 | |
| 48797.99 | 29.0 | 303 | |
| 48800.02 | 28.2 | 303 | |
| 48846.90 | 21.1 | 303 | |
| 48850.92 | 21.4 | 303 | |
| 48974.26 | 22.4 | 303 | |
| 48975.26 | 24.1 | 303 | |
| 48976.26 | 23.7 | 303 | |
| 49029.24 | 20.7 | 303 | |
| 49032.23 | 20.7 | 303 | |
| 49034.11 | 19.5 | 303 | |
| 49065.18 | 15.2 | 303 | |
| 49066.20 | 15.5 | 303 | |
| 49069.20 | 15.3 | 303 | |
| 49071.19 | 16.2 | 303 | |
| 49173.95 | 19.0 | 303 | |
| 49175.99 | 18.7 | 303 | |
| 49178.97 | 22.4 | 303 | |
| 49348.26 | o | 20.8 | 303 |
| 49351.25 | o | 21.9 | 303 |
| 49360.26 | o | 20.2 | 303 |
| 49401.17 | o | 17.6 | 303 |
| 49472.09 | 23.2 | 303 | |
| 49563.83 | 22.8 | 303 | |
| 49567.91 | 24.0 | 303 | |
| 49570.87 | 25.9 | 303 | |
| 49697.25 | 26.6 | 303 | |
| 49714.25 | 22.2 | 303 | |
| 49720.26 | 20.2 | 303 | |
| 49727.25 | 23.3 | 303 | |
| 49873.05 | 20.9 | 303 | |
| 50433.25 | 17.8 | 303 | |
| 50442.25 | 17.9 | 303 | |
| 50487.22 | 24.6 | ||
| 50508.16 | 25.5 | ||
| 50513.21 | 26.7 | ||
| 50536.15 | 25.9 | ||
| 50538.13 | 26.2 | ||
| 50539.14 | 25.9 | ||
| 50546.10 | 25.7 | ||
| 50548.12 | 27.1 | ||
| 50549.13 | 27.1 | ||
| 50554.11 | 29.0 | ||
| 50563.17 | 27.8 | 303 | |
| 50564.12 | 28.1 | 303 | |
| 50566.16 | 27.1 | 303 | |
| 50569.11 | 27.8 | ||
| 50571.08 | 27.8 | ||
| 50571.96 | 27.1 | ||
| 50573.09 | 26.0 | ||
| 50575.05 | 24.2 | ||
| 50578.05 | 22.5 | ||
| 50579.06 | 22.0 | ||
| 50580.04 | 22.4 | ||
| 50581.08 | 23.0 | ||
| 50609.03 | 21.8 | ||
| 50611.97 | 20.3 | ||
| 50616.04 | 19.1 | ||
| 50617.01 | 20.4 | ||
| 50619.06 | 21.0 | ||
| 50620.03 | 21.0 | ||
| 50630.91 | 22.8 | ||
| 50635.95 | 23.7 | ||
| 50646.98 | 23.6 | 303 | |
| 50647.93 | 22.5 | 303 | |
| 50649.96 | 20.8 | 303 | |
| 50651.86 | 21.9 | 303 | |
| 50652.90 | 21.7 | 303 | |
| 50653.88 | 22.1 | 303 | |
| 50654.93 | 20.2 | 303 | |
| 50655.89 | 21.3 | 303 | |
| 50656.89 | 22.4 | 303 | |
| 50657.85 | 21.5 | 303 | |
| 50699.78 | 21.1 | 303 | |
| 50701.82 | 22.1 | 303 | |
| 50703.77 | 23.3 | 303 | |
| 50705.77 | 23.6 | 303 | |
| 50804.26 | 21.8 | 303 | |
| 50932.09 | 19.4 | 303 | |
| 50937.10 | 21.1 | 303 | |
| 51002.00 | 21.9 | 303 | |
| 51003.99 | 21.3 | 303 | |
| 51008.95 | 18.4 | 303 | |
| 51016.91 | 19.0 | 303 | |
| 51019.94 | 20.9 | 303 | |
| 51021.91 | 21.6 | 303 | |
| 51024.88 | 22.0 | 303 | |
| 51270.47 | 22.7 | 219 | |
| 51281.49 | 22.2 | 219 | |
| 51366.33 | 20.8 | 219 | |
| 51369.32 | 22.7 | 219 | |
| 51373.30 | 23.2 | 219 |
A.3 Table A3
This details R CrB Cambridge Coravel data with recorded profiles; o indicates an observation during a faint phase, while x indicates an observation during the 2006 period, when the profiles were abnormal.
| MJD | Vel | EW | note | |
|---|---|---|---|---|
| 51541.28 | 24.9 | 4.5 | 21.5 | o |
| 51552.29 | 24.5 | 4.0 | 23. | o |
| 51553.29 | 23.2 | 3.9 | 24.5 | o |
| 51585.25 | 23.6 | 4.5 | 22. | o |
| 51588.24 | 21.0 | 4.1 | 20.5 | o |
| 51590.21 | 19.4 | 4.0 | 19. | o |
| 51594.25 | 19.1 | 4.0 | 18.5 | o |
| 51596.10 | 19.2 | 3.9 | 17.5 | o |
| 51605.11 | 22.6 | 4.4 | 17.5 | |
| 51607.21 | 24.4 | 4.2 | 18. | |
| 51610.10 | 26.3 | 4.0 | 16. | |
| 51640.13 | 23.0 | 5.2 | 18.5 | |
| 51641.14 | 23.8 | 5.0 | 18.5 | |
| 51642.06 | 25.2 | 5.0 | 19. | |
| 51644.14 | 26.9 | 5.2 | 18.5 | |
| 51655.95 | 31.9 | 4.7 | 24.5 | |
| 51658.09 | 30.7 | 4.5 | 24. | |
| 51661.10 | 30.7 | 4.3 | 22. | |
| 51664.06 | 28.5 | 4.1 | 23. | |
| 51672.00 | 29.0 | 4.0 | 19.5 | |
| 51678.02 | 29.4 | 3.6 | 18. | |
| 51684.06 | 27.9 | 3.7 | 18. | |
| 51686.90 | 27.2 | 3.8 | 20.5 | |
| 51695.02 | 25.7 | 3.9 | 19. | |
| 51700.03 | 26.6 | 4.1 | 19. | |
| 51700.90 | 26.7 | 3.4 | 19.5 | |
| 51702.02 | 26.8 | 4.0 | 21. | |
| 51706.94 | 25.7 | 3.7 | 20. | |
| 51708.94 | 25.9 | 3.7 | 18.5 | |
| 51712.94 | 25.0 | 4.0 | 20.5 | |
| 51714.94 | 24.8 | 3.8 | 19.5 | |
| 51740.91 | 21.3 | 4.0 | 20. | |
| 51741.89 | 21.6 | 3.9 | 20.5 | |
| 51742.89 | 21.2 | 3.8 | 18.5 | |
| 51743.89 | 21.6 | 3.7 | 18.5 | |
| 51744.89 | 22.1 | 3.6 | 17. | |
| 51746.89 | 22.2 | 4.1 | 18.5 | |
| 51751.94 | 24.2 | 3.8 | 18. | |
| 51757.87 | 26.3 | 4.0 | 20.5 | |
| 51758.87 | 26.4 | 4.1 | 22.5 | |
| 51760.87 | 25.8 | 4.3 | 23.5 | |
| 51761.86 | 26.2 | 4.0 | 24. | |
| 51762.86 | 25.7 | 4.1 | 23. | |
| 51767.85 | 23.8 | 4.4 | 23. | |
| 51770.84 | 24.6 | 3.9 | 20.5 | |
| 51784.88 | 25.3 | 4.0 | 21.5 | |
| 51785.82 | 24.7 | 3.8 | 19.5 | |
| 51786.82 | 25.2 | 3.8 | 19. | |
| 51790.89 | 26.0 | 3.7 | 20. | |
| 51791.84 | 25.5 | 3.8 | 20.5 | |
| 51807.78 | 25.0 | 4.3 | 21. | |
| 51809.79 | 24.5 | 4.5 | 21.5 | |
| 51810.79 | 25.3 | 4.0 | 21. | |
| 51811.80 | 25.4 | 4.7 | 22. | |
| 51813.80 | 25.7 | 4.1 | 19. | |
| 51815.78 | 26.7 | 4.4 | 19.5 | |
| 51817.81 | 25.1 | 4.5 | 20.5 | |
| 51822.77 | 26.7 | 4.4 | 20.5 | |
| 51830.76 | 29.1 | 4.2 | 20. | |
| 51836.75 | 29.9 | 3.8 | 19. | |
| 51847.73 | 26.2 | 9.9 | 99. | |
| 51849.73 | 26.2 | 4.0 | 22. | |
| 51851.73 | 25.8 | 4.2 | 21. | |
| 51860.72 | 28.1 | 4.3 | 19. | |
| 51861.71 | 28.2 | 4.6 | 20. | |
| 51864.70 | 28.6 | 4.4 | 19.5 | |
| 51868.27 | 28.9 | 4.0 | 21. | o |
| 51870.27 | 30.0 | 3.6 | 19. | o |
| 51880.28 | 28.0 | 3.2 | 19.5 | o |
| 51887.26 | 22.5 | 2.5 | 14.5 | o |
| 51954.19 | 29.5 | 4.1 | 19. | o |
| 51957.22 | 28.5 | 4.0 | 21. | o |
| 51967.14 | 24.8 | 4.4 | 21. | |
| 51970.21 | 24.9 | 4.5 | 21.5 | |
| 51971.21 | 23.3 | 4.0 | 20. | |
| 51973.23 | 23.0 | 4.2 | 21.5 | |
| 51976.10 | 23.3 | 3.8 | 20. | |
| 51977.07 | 22.2 | 4.2 | 21. | |
| 51979.12 | 23.3 | 4.5 | 20. | |
| 51980.21 | 23.1 | 4.1 | 19. | |
| 51982.10 | 24.8 | 4.4 | 20.5 | |
| 52028.08 | 22.1 | 4.2 | 18.5 | |
| 52034.09 | 21.9 | 4.3 | 18.5 | |
| 52037.09 | 20.8 | 4.2 | 19. | |
| 52041.06 | 20.1 | 4.4 | 20. | |
| 52042.08 | 20.6 | 4.2 | 19. | |
| 52058.03 | 24.2 | 3.6 | 19.5 | |
| 52068.02 | 25.1 | 4.1 | 22. | |
| 52069.02 | 24.6 | 4.1 | 23.5 | |
| 52071.00 | 25.1 | 4.3 | 23.5 | |
| 52075.94 | 25.9 | 4.0 | 23.5 | |
| 52078.01 | 23.0 | 4.4 | 23.5 | |
| 52081.05 | 23.9 | 4.0 | 21. | |
| 52082.99 | 24.2 | 3.7 | 21.5 | |
| 52084.95 | 24.3 | 4.2 | 22.5 | |
| 52088.01 | 24.8 | 3.8 | 20. | |
| 52089.05 | 24.5 | 4.1 | 21.5 | |
| 52091.00 | 26.1 | 4.4 | 21.5 | |
| 52093.97 | 26.5 | 4.2 | 22. | |
| 52094.91 | 26.5 | 4.0 | 21.5 | |
| 52097.00 | 25.9 | 3.9 | 21. | |
| 52098.90 | 26.7 | 4.3 | 21. | |
| 52100.89 | 28.1 | 3.8 | 20. | |
| 52105.88 | 28.9 | 4.1 | 21. | |
| 52113.91 | 27.6 | 4.7 | 24.5 | |
| 52116.87 | 27.4 | 4.6 | 23.5 | |
| 52117.94 | 27.5 | 4.3 | 23.5 | |
| 52119.87 | 28.1 | 4.3 | 25. | |
| 52122.87 | 30.5 | 4.0 | 24. | |
| 52126.87 | 29.3 | 9.9 | 22.5 | |
| 52128.86 | 29.4 | 3.7 | 22. | |
| 52131.89 | 26.7 | 3.7 | 22. | |
| 52134.85 | 26.4 | 3.6 | 21.5 | |
| 52135.86 | 26.7 | 4.1 | 22.5 | |
| 52137.85 | 26.2 | 3.7 | 24.5 | |
| 52140.90 | 25.6 | 4.0 | 23.5 | |
| 52141.84 | 24.8 | 3.6 | 22.5 | |
| 52145.92 | 21.2 | 3.8 | 20. | |
| 52174.78 | 26.0 | 3.9 | 18. | |
| 52181.77 | 25.8 | 3.9 | 20. | |
| 52185.76 | 26.3 | 4.2 | 21. | |
| 52188.77 | 25.2 | 3.9 | 19. | |
| 52200.74 | 23.8 | 4.3 | 22. | |
| 52206.75 | 21.8 | 3.8 | 18. | |
| 52207.75 | 21.4 | 3.9 | 18. | |
| 52212.73 | 23.1 | 4.1 | 17.5 | |
| 52213.73 | 23.1 | 4.3 | 19. | |
| 52214.73 | 24.1 | 4.1 | 16.5 | |
| 52226.71 | 26.8 | 3.7 | 18.5 | |
| 52255.23 | 20.7 | 3.8 | 18.5 | |
| 52257.29 | 21.4 | 3.9 | 19. | |
| 52258.29 | 20.6 | 3.9 | 19.5 | |
| 52263.29 | 21.4 | 4.2 | 20.5 | |
| 52265.25 | 21.2 | 4.1 | 19. | |
| 52275.28 | 22.4 | 3.9 | 16.5 | |
| 52278.29 | 22.3 | 3.8 | 18. | |
| 52292.25 | 18.4 | 4.1 | 21. | |
| 52305.13 | 22.1 | 4.4 | 19.5 | |
| 52309.17 | 25.3 | 4.1 | 19.5 | |
| 52319.13 | 24.1 | 4.1 | 23. | |
| 52326.22 | 21.7 | 4.5 | 22.5 | |
| 52328.21 | 22.4 | 4.1 | 23. | |
| 52329.18 | 23.2 | 4.0 | 20. | |
| 52332.19 | 22.3 | 5.1 | 23. | |
| 52334.18 | 23.6 | 4.0 | 19. | |
| 52335.17 | 23.4 | 4.3 | 19.5 | |
| 52360.11 | 26.9 | 4.1 | 20.5 | |
| 52361.15 | 26.9 | 4.4 | 20.5 | |
| 52362.11 | 26.2 | 4.1 | 20. | |
| 52363.15 | 25.6 | 3.9 | 19. | |
| 52368.16 | 26.6 | 4.0 | 19. | |
| 52370.11 | 27.5 | 4.2 | 21. | |
| 52371.11 | 27.3 | 4.2 | 22. | |
| 52374.03 | 25.5 | 4.0 | 24.5 | |
| 52381.02 | 26.7 | 3.8 | 21.5 | |
| 52382.14 | 26.8 | 3.8 | 22. | |
| 52384.10 | 27.3 | 3.9 | 22. | |
| 52388.11 | 28.5 | 3.6 | 19.5 | |
| 52388.99 | 28.5 | 3.7 | 20. | |
| 52391.08 | 28.2 | 3.9 | 18. | |
| 52393.98 | 28.3 | 9.9 | 99. | |
| 52396.08 | 29.3 | 4.1 | 19. | |
| 52398.10 | 29.6 | 4.4 | 19. | |
| 52399.00 | 30.4 | 4.0 | 18.5 | |
| 52401.94 | 30.2 | 4.3 | 20. | |
| 52410.04 | 31.2 | 4.0 | 21.5 | |
| 52411.08 | 30.6 | 9.9 | 99. | |
| 52421.04 | 27.8 | 4.1 | 23. | |
| 52422.04 | 27.5 | 4.1 | 23. | |
| 52423.05 | 27.4 | 3.9 | 23. | |
| 52423.93 | 25.9 | 3.9 | 23.5 | |
| 52425.03 | 24.4 | 4.0 | 25.5 | |
| 52425.99 | 24.8 | 3.9 | 24. | |
| 52427.04 | 23.8 | 4.2 | 24. | |
| 52429.94 | 21.6 | 4.1 | 22.5 | |
| 52434.06 | 20.2 | 4.1 | 21.5 | |
| 52434.93 | 19.9 | 3.9 | 20.5 | |
| 52436.00 | 20.4 | 4.3 | 21.5 | |
| 52440.07 | 21.7 | 4.1 | 21. | |
| 52442.99 | 22.8 | 4.3 | 21. | |
| 52443.96 | 22.6 | 4.2 | 18.5 | |
| 52447.92 | 24.1 | 4.4 | 19.5 | |
| 52448.99 | 24.4 | 4.0 | 19. | |
| 52450.92 | 25.3 | 4.3 | 20.5 | |
| 52451.91 | 25.7 | 4.0 | 18. | |
| 52452.90 | 25.0 | 4.0 | 19.5 | |
| 52458.97 | 24.4 | 3.8 | 20. | |
| 52465.01 | 22.0 | 4.0 | 21. | |
| 52465.90 | 21.1 | 3.8 | 20. | |
| 52468.90 | 19.6 | 3.7 | 19. | |
| 52469.90 | 19.4 | 3.8 | 19. | |
| 52475.98 | 18.2 | 3.9 | 19. | |
| 52481.88 | 19.5 | 4.2 | 19. | |
| 52492.87 | 22.5 | 4.2 | 20. | |
| 52498.85 | 20.8 | 4.1 | 20. | |
| 52500.85 | 20.6 | 4.2 | 20. | |
| 52502.85 | 19.9 | 4.1 | 20. | |
| 52503.86 | 20.0 | 3.8 | 18. | |
| 52513.84 | 22.0 | 4.1 | 19.5 | |
| 52514.83 | 22.2 | 4.3 | 19. | |
| 52515.87 | 22.3 | 4.3 | 19.5 | |
| 52518.84 | 23.8 | 4.2 | 20.5 | |
| 52519.86 | 24.7 | 4.3 | 21. | |
| 52520.83 | 23.9 | 4.4 | 20.5 | |
| 52521.85 | 23.4 | 4.3 | 21. | |
| 52525.89 | 22.8 | 4.3 | 22. | |
| 52527.81 | 21.8 | 4.8 | 21. | |
| 52529.81 | 22.5 | 4.3 | 20. | |
| 52530.81 | 22.7 | 4.8 | 21. | |
| 52539.85 | 25.4 | 4.7 | 21.5 | |
| 52540.79 | 26.1 | 4.8 | 21.5 | |
| 52543.79 | 26.2 | 4.1 | 21. | |
| 52546.81 | 24.8 | 4.3 | 22. | |
| 52550.77 | 24.6 | 4.0 | 20.5 | |
| 52551.80 | 25.3 | 4.1 | 21. | |
| 52553.79 | 25.1 | 3.8 | 19.5 | |
| 52559.79 | 22.4 | 4.1 | 21.5 | |
| 52565.73 | 19.6 | 4.0 | 20.5 | |
| 52582.72 | 24.3 | 4.4 | 20. | |
| 52585.72 | 25.9 | 4.1 | 18. | |
| 52590.72 | 25.6 | 3.8 | 18.5 | |
| 52591.71 | 25.5 | 4.2 | 20. | |
| 52613.27 | 24.9 | 4.1 | 19. | |
| 52617.28 | 24.2 | 3.9 | 16.5 | |
| 52619.22 | 23.3 | 4.2 | 19. | |
| 52645.21 | 24.2 | 4.0 | 17. | |
| 52646.20 | 24.9 | 4.2 | 18.5 | |
| 52650.28 | 25.6 | 4.3 | 18.5 | |
| 52655.26 | 26.5 | 3.8 | 18. | |
| 52666.19 | 26.4 | 4.2 | 19.5 | |
| 52685.27 | 25.9 | 4.0 | 17.5 | o |
| 52688.21 | 25.9 | 3.1 | 18. | o |
| 52689.12 | 23.2 | 2.4 | 17. | o |
| 52691.20 | 23.9 | 9.9 | 99. | o |
| 52745.08 | 22.2 | 4.2 | 19. | o |
| 52748.09 | 24.1 | 4.5 | 19. | o |
| 52751.08 | 24.6 | 4.2 | 19. | o |
| 52753.05 | 24.6 | 4.2 | 19.5 | o |
| 52758.09 | 23.4 | 4.3 | 21.5 | o |
| 52760.10 | 24.3 | 4.3 | 20.5 | o |
| 52765.05 | 23.7 | 4.5 | 22.5 | o |
| 52766.99 | 23.4 | 4.2 | 22. | o |
| 52769.07 | 23.3 | 4.3 | 21.5 | |
| 52771.07 | 23.1 | 4.3 | 21.5 | |
| 52772.07 | 23.6 | 4.3 | 21. | |
| 52774.07 | 23.2 | 4.1 | 19. | |
| 52777.07 | 22.9 | 4.1 | 19. | |
| 52779.08 | 22.8 | 4.3 | 18.5 | |
| 52783.07 | 23.8 | 4.6 | 20. | |
| 52785.08 | 24.2 | 4.3 | 18.5 | |
| 52787.08 | 25.0 | 4.5 | 19. | |
| 52790.99 | 25.9 | 4.1 | 19. | |
| 52795.99 | 28.6 | 4.1 | 19.5 | |
| 52801.05 | 30.5 | 4.0 | 18.5 | |
| 52803.02 | 31.3 | 4.0 | 19.5 | |
| 52805.05 | 31.7 | 3.9 | 20. | |
| 52808.05 | 31.1 | 3.9 | 22. | |
| 52809.04 | 31.4 | 3.6 | 20.5 | |
| 52810.99 | 30.5 | 3.9 | 22.5 | |
| 52814.04 | 27.2 | 3.3 | 23.5 | |
| 52814.97 | 26.8 | 3.8 | 25. | |
| 52818.04 | 20.6 | 3.4 | 21.5 | |
| 52824.93 | 16.9 | 4.0 | 19. | |
| 52827.90 | 16.9 | 3.9 | 17. | |
| 52830.91 | 17.8 | 4.3 | 17.5 | |
| 52832.95 | 17.8 | 4.2 | 17.5 | |
| 52833.94 | 18.1 | 3.9 | 16. | |
| 52834.95 | 18.2 | 4.2 | 17.5 | |
| 52835.94 | 19.0 | 3.9 | 17. | |
| 52840.88 | 21.9 | 4.0 | 16.5 | |
| 52841.95 | 21.7 | 4.0 | 16. | |
| 52847.92 | 25.4 | 4.3 | 19. | |
| 52853.88 | 28.7 | 3.9 | 21.5 | |
| 52854.88 | 28.2 | 3.9 | 23. | |
| 52857.88 | 25.4 | 3.6 | 24.5 | |
| 52859.87 | 24.6 | 3.8 | 25.5 | |
| 52860.87 | 24.2 | 4.0 | 25.5 | |
| 52865.91 | 20.5 | 3.5 | 22.5 | |
| 52867.85 | 20.6 | 4.0 | 23. | |
| 52870.85 | 18.4 | 3.7 | 19.5 | |
| 52871.84 | 18.6 | 4.1 | 19.5 | |
| 52875.83 | 20.6 | 4.1 | 19. | |
| 52880.82 | 23.2 | 3.8 | 17.5 | |
| 52881.83 | 23.6 | 4.0 | 18. | |
| 52892.88 | 27.4 | 4.4 | 19. | |
| 52895.79 | 27.7 | 4.1 | 19. | |
| 52896.79 | 27.9 | 4.5 | 18.5 | |
| 52899.81 | 27.2 | 4.1 | 19. | |
| 52901.80 | 26.9 | 4.0 | 19. | |
| 52905.79 | 27.8 | 3.8 | 20. | |
| 52911.82 | 23.6 | 3.3 | 17.5 | |
| 52915.78 | 23.0 | 3.7 | 20. | |
| 52923.79 | 20.6 | 4.0 | 18.5 | |
| 52926.78 | 22.2 | 4.0 | 19. | |
| 52928.76 | 23.5 | 3.9 | 18. | |
| 52929.75 | 24.4 | 3.8 | 18. | |
| 52930.75 | 24.5 | 3.9 | 18. | |
| 52939.73 | 21.3 | 4.0 | 22. | |
| 52944.73 | 20.2 | 4.0 | 22. | |
| 52946.72 | 19.5 | 3.6 | 19.5 | |
| 52947.72 | 21.0 | 3.7 | 21.5 | |
| 52948.72 | 21.7 | 4.3 | 22.5 | |
| 52950.72 | 22.4 | 4.1 | 22. | |
| 52980.28 | 22.6 | 4.4 | 20. | |
| 52981.28 | 22.4 | 4.3 | 20. | |
| 52988.26 | 24.3 | 4.1 | 18.5 | |
| 53000.27 | 27.7 | 4.4 | 18.5 | |
| 53013.24 | 30.0 | 4.5 | 23.5 | |
| 53019.25 | 28.3 | 4.2 | 24. | |
| 53021.26 | 27.3 | 4.2 | 23.5 | |
| 53034.15 | 27.9 | 4.7 | 20.5 | |
| 53044.20 | 24.0 | 4.1 | 22. | |
| 53061.20 | 25.0 | 4.3 | 19.5 | |
| 53065.21 | 26.2 | 4.4 | 21. | |
| 53081.17 | 28.0 | 3.6 | 19. | |
| 53095.14 | 23.5 | 4.4 | 20.5 | |
| 53098.16 | 24.8 | 3.9 | 18.5 | |
| 53102.08 | 25.8 | 4.4 | 18.5 | |
| 53109.05 | 27.6 | 4.2 | 17. | |
| 53110.11 | 28.9 | 4.3 | 18. | |
| 53115.09 | 29.3 | 4.0 | 16.5 | |
| 53117.13 | 29.0 | 4.0 | 18. | |
| 53119.05 | 28.1 | 4.2 | 20. | |
| 53131.10 | 22.8 | 3.8 | 19. | |
| 53132.07 | 22.6 | 3.7 | 18.5 | |
| 53142.08 | 23.6 | 3.8 | 17.5 | |
| 53144.05 | 23.6 | 3.8 | 17. | |
| 53147.02 | 26.7 | 4.0 | 17.5 | |
| 53149.04 | 26.4 | 3.8 | 17. | |
| 53156.01 | 27.0 | 3.8 | 18.5 | |
| 53161.03 | 25.0 | 3.9 | 23. | |
| 53164.02 | 23.9 | 3.9 | 22. | |
| 53169.01 | 22.3 | 3.7 | 22.5 | |
| 53173.00 | 19.4 | 3.7 | 21. | |
| 53178.00 | 18.3 | 3.7 | 19. | |
| 53181.99 | 19.5 | 3.9 | 18.5 | |
| 53183.90 | 20.3 | 3.9 | 18.5 | |
| 53188.99 | 22.3 | 4.0 | 17.5 | |
| 53191.97 | 23.7 | 4.1 | 18.5 | |
| 53195.97 | 24.5 | 4.0 | 18. | |
| 53202.89 | 23.3 | 4.1 | 19. | |
| 53212.89 | 20.2 | 3.8 | 20.5 | |
| 53216.87 | 20.8 | 3.7 | 17. | |
| 53224.86 | 25.2 | 3.9 | 18. | |
| 53227.97 | 25.1 | 3.7 | 18.5 | |
| 53236.91 | 25.1 | 3.8 | 21.5 | |
| 53246.82 | 22.9 | 4.0 | 21. | |
| 53248.93 | 21.5 | 3.9 | 21.5 | |
| 53249.85 | 20.9 | 3.7 | 21. | |
| 53253.86 | 19.3 | 3.7 | 19.5 | |
| 53255.81 | 19.8 | 3.8 | 19.5 | |
| 53261.80 | 21.4 | 4.0 | 17.5 | |
| 53263.79 | 22.2 | 4.1 | 17. | |
| 53266.80 | 24.0 | 4.1 | 18. | |
| 53283.77 | 21.3 | 3.2 | 20. | |
| 53303.73 | 23.1 | 4.0 | 19.5 | |
| 53313.71 | 26.9 | 3.7 | 20. | |
| 53322.70 | 23.9 | 3.8 | 24. | |
| 53323.70 | 22.5 | 4.0 | 26. | |
| 53328.70 | 21.6 | 4.4 | 25. | |
| 53357.24 | 28.7 | 4.4 | 21.5 | |
| 53365.29 | 26.1 | 4.6 | 21.5 | |
| 53379.28 | 28.4 | 4.4 | 22. | |
| 53383.26 | 26.2 | 4.1 | 23. | |
| 53392.27 | 23.1 | 3.8 | 20. | |
| 53441.20 | 26.8 | 3.8 | 17. | |
| 53452.19 | 28.2 | 4.0 | 21. | |
| 53479.11 | 22.1 | 4.0 | 16. | |
| 53482.07 | 23.9 | 4.0 | 15. | |
| 53495.05 | 28.8 | 4.4 | 18. | |
| 53498.05 | 29.4 | 3.9 | 18.5 | |
| 53501.08 | 29.4 | 3.9 | 20. | |
| 53502.06 | 28.8 | 4.0 | 20.5 | |
| 53505.05 | 26.2 | 3.7 | 21. | |
| 53513.06 | 20.8 | 3.7 | 16.5 | |
| 53518.00 | 19.8 | 3.8 | 17. | |
| 53521.00 | 18.8 | 3.9 | 17.5 | |
| 53522.02 | 19.8 | 3.6 | 17. | |
| 53527.98 | 20.6 | 3.9 | 17. | |
| 53529.91 | 21.8 | 4.1 | 17.5 | |
| 53532.02 | 23.1 | 4.1 | 18.5 | |
| 53534.94 | 25.1 | 3.9 | 19. | |
| 53542.91 | 28.2 | 3.9 | 21. | |
| 53547.93 | 27.5 | 3.5 | 21. | |
| 53560.88 | 24.6 | 3.8 | 23. | |
| 53567.88 | 23.7 | 3.6 | 21.5 | |
| 53568.89 | 23.9 | 3.8 | 22. | |
| 53571.93 | 22.6 | 4.0 | 20.5 | |
| 53579.87 | 25.6 | 3.7 | 18. | |
| 53584.87 | 29.7 | 4.1 | 18.5 | |
| 53588.87 | 30.5 | 4.1 | 20. | |
| 53590.91 | 30.3 | 4.0 | 20. | |
| 53597.85 | 32.2 | 3.7 | 19.5 | |
| 53598.84 | 31.8 | 3.4 | 19.5 | |
| 53599.85 | 32.0 | 3.6 | 20.5 | |
| 53603.84 | 30.3 | 3.3 | 23. | |
| 53606.88 | 27.4 | 4.1 | 99. | |
| 53607.84 | 24.9 | 3.7 | 26.5 | |
| 53609.85 | 23.6 | 3.8 | 25.5 | |
| 53612.82 | 23.0 | 3.9 | 24.5 | |
| 53615.87 | 22.1 | 3.7 | 23. | |
| 53620.81 | 21.5 | 4.0 | 20.5 | |
| 53621.83 | 20.7 | 3.7 | 19. | |
| 53625.80 | 22.4 | 4.0 | 18. | |
| 53627.79 | 23.4 | 3.9 | 18. | |
| 53629.83 | 24.6 | 4.2 | 20. | |
| 53636.80 | 26.1 | 4.0 | 19. | |
| 53638.78 | 27.5 | 3.5 | 18.5 | |
| 53645.77 | 26.3 | 3.9 | 25. | |
| 53647.77 | 24.2 | 3.7 | 24.5 | |
| 53658.76 | 19.5 | 4.1 | 20.5 | |
| 53663.74 | 20.0 | 3.5 | 18.5 | |
| 53668.74 | 21.1 | 3.9 | 17.5 | |
| 53670.73 | 20.5 | 3.8 | 18. | |
| 53672.72 | 21.2 | 3.8 | 18. | |
| 53674.72 | 21.8 | 4.0 | 19. | |
| 53686.71 | 23.1 | 3.9 | 22.5 | |
| 53690.71 | 21.3 | 4.2 | 22. | |
| 53692.70 | 21.4 | 4.2 | 21. | |
| 53721.28 | 18.6 | 4.4 | 21.5 | |
| 53764.28 | 26.4 | 3.6 | 21.5 | |
| 53782.15 | 27.0 | 3.5 | 18. | |
| 53795.19 | 28.0 | 4.4 | 22. | |
| 53800.16 | 26.9 | 4.3 | 23.5 | |
| 53817.16 | 26.8 | 4.1 | 21.5 | |
| 53829.12 | 24.1 | 4.0 | 20.5 | |
| 53831.10 | 25.2 | 4.1 | 19. | |
| 53834.09 | 26.8 | 4.3 | 21.5 | |
| 53836.10 | 26.4 | 4.2 | 23. | |
| 53851.06 | 24.0 | 4.2 | 26. | |
| 53857.04 | 24.3 | 4.4 | 23.5 | |
| 53861.11 | 24.9 | 4.3 | 21.5 | |
| 53864.04 | 24.0 | 4.2 | 23. | |
| 53871.04 | 24.6 | 4.0 | 21. | |
| 53881.99 | 23.8 | 3.9 | 18.5 | |
| 53885.01 | 22.9 | 3.9 | 19.5 | |
| 53888.98 | 23.1 | 4.4 | 20. | |
| 53894.96 | 25.2 | 4.6 | 20.5 | |
| 53898.01 | 27.0 | 4.4 | 21. | |
| 53907.98 | 26.5 | 4.3 | 25.5 | |
| 53909.01 | 27.0 | 4.2 | 25. | x |
| 53910.98 | 25.8 | 4.1 | 24.5 | x |
| 53913.97 | 24.8 | 4.3 | 26. | x |
| 53914.97 | 24.7 | 4.3 | 26.5 | x |
| 53916.96 | 23.6 | 4.1 | 24.5 | x |
| 53918.97 | 22.9 | 4.1 | 23.5 | x |
| 53919.96 | 23.4 | 4.1 | 24.5 | x |
| 53924.04 | 22.3 | 3.8 | 21. | x |
| 53925.90 | 22.1 | 4.0 | 20. | x |
| 53927.90 | 22.6 | 3.9 | 19.5 | x |
| 53928.90 | 23.0 | 4.2 | 20. | x |
| 53929.89 | 23.4 | 3.9 | 19. | x |
| 53930.94 | 23.2 | 4.1 | 19. | x |
| 53931.91 | 23.7 | 4.3 | 19.5 | x |
| 53932.89 | 23.7 | 4.2 | 19.5 | x |
| 53933.90 | 24.3 | 4.2 | 19.5 | x |
| 53934.90 | 24.8 | 4.1 | 19. | x |
| 53936.90 | 25.8 | 4.3 | 21. | x |
| 53939.96 | 26.0 | 4.2 | 20.5 | x |
| 53940.91 | 25.8 | 4.2 | 20.5 | x |
| 53944.99 | 25.6 | 4.1 | 20.5 | x |
| 53948.98 | 24.3 | 4.0 | 21. | x |
| 53953.87 | 21.4 | 3.8 | 22.5 | x |
| 53954.90 | 22.0 | 3.8 | 22. | x |
| 53956.90 | 21.3 | 4.0 | 21.5 | x |
| 53960.85 | 21.0 | 3.7 | 20. | x |
| 53962.93 | 20.3 | 3.7 | 19.5 | |
| 53975.84 | 24.6 | 4.5 | 22. | |
| 53976.83 | 25.6 | 4.4 | 21.5 | |
| 53985.87 | 23.5 | 3.8 | 20.5 | |
| 53986.82 | 22.4 | 4.1 | 21.5 | |
| 53998.82 | 21.4 | 3.6 | 20.5 | |
| 54000.80 | 22.3 | 3.6 | 20. | |
| 54032.74 | 21.8 | 3.9 | 20.5 | |
| 54034.73 | 21.9 | 3.9 | 19. | |
| 54040.73 | 23.0 | 3.7 | 18. | |
| 54042.72 | 22.8 | 3.9 | 18.5 | |
| 54045.71 | 22.8 | 3.3 | 16.5 | |
| 54048.72 | 22.2 | 3.7 | 18. | |
| 54057.70 | 19.7 | 3.6 | 19.5 | |
| 54065.27 | 20.1 | 4.0 | 22. | |
| 54078.28 | 26.7 | 4.6 | 21.5 | |
| 54086.29 | 27.9 | 4.6 | 22. | |
| 54113.24 | 26.6 | 4.4 | 23.5 | |
| 54134.28 | 20.5 | 4.3 | 21.5 | |
| 54146.26 | 26.1 | 4.8 | 22.5 | |
| 54161.23 | 26.5 | 4.2 | 21.5 | |
| 54181.17 | 21.5 | 4.6 | 17. | |
| 54185.00 | 23.9 | 4.3 | 17.5 | |
| 54192.13 | 24.6 | 4.2 | 21. | |
| 54194.13 | 24.2 | 4.3 | 21.5 | |
| 54200.10 | 22.6 | 4.7 | 25. | |
| 54206.11 | 20.4 | 4.8 | 23.5 | |
| 54220.09 | 21.6 | 5.1 | 22. | |
| 54228.06 | 23.3 | 5.5 | 24.5 | |
| 54235.06 | 23.8 | 5.1 | 26. | |
| 54239.05 | 25.1 | 5.1 | 27. | |
| 54243.07 | 24.8 | 5.0 | 27. | |
| 54250.04 | 24.0 | 4.7 | 23. | |
| 54251.01 | 23.7 | 4.8 | 23. | |
| 54255.99 | 22.2 | 4.4 | 23. | |
| 54267.00 | 21.9 | 4.2 | 19.5 | |
| 54271.98 | 23.3 | 4.5 | 21. | |
| 54277.99 | 24.6 | 4.6 | 23. | |
| 54287.99 | 20.9 | 5.8 | 34. | o |
| 54288.98 | 22.2 | 5.3 | 32.5 | o |
| 54293.99 | 19.5 | 5.7 | 36. | o |
| 54299.90 | 19.1 | 6.1 | 37. | o |
| 54300.92 | 20.3 | 5.6 | 36. | o |
| 54303.90 | 20.8 | 5.3 | 33. | o |
| 54307.99 | 20.8 | 4.1 | 29. | o |
| 54310.92 | 18.1 | 2.0 | 27.5 | o |