Detection of Coronal Magnetic Activity in Nearby Active Supermassive Black Holes
Abstract
Central supermassive black holes of active galactic nuclei host hot plasma with a temperature of K, namely coronae. Like the Sun, black hole coronae are theoretically believed to be heated by their magnetic activity, which have never been observed yet. Here we report the detection of coronal radio synchrotron emission from two nearby Seyfert galaxies using the Atacama Large Millimeter/submillimeter Array, the Karl G. Jansky Very Large Array, and Australia Telescope Compact Array. The coronal magnetic field of both systems is estimated to be Gauss on scales of Schwarzschild radii from the central black holes. This magnetic field strength is weaker than the prediction from the magnetically heated corona scenario. We also find that coronae of Seyferts are composed of both thermal and non-thermal electrons. This may imply a possible contribution of Seyferts to the cosmic MeV gamma-ray background radiation.
1 Introduction
Magnetic fields in the vicinity of supermassive black holes (SMBHs) are believed to be one of the most fundamental parameters governing the launch of relativistic jets (Blandford & Znajek, 1977) and generation of hot accretion disk coronae (Haardt & Maraschi, 1991). Various attempts have been made to measure magnetic fields at the center of active galactic nuclei (AGNs; Gnedin et al., 2014; Lopez-Rodriguez et al., 2015; Martí-Vidal et al., 2015). To date, however, magnetic fields in the inner accretion disk region at the scale of tens of Schwarzschild radii () have not been measured yet.
In the radio centimeter (cm) or longer wavelength regime, synchrotron radiation from AGN jets and/or galactic cosmic-ray particles dominate the emission, while extended galactic thermal dust emission dominates the millimeter (mm) radiation. It is theoretically predicted that there also exists radio synchrotron emission arising from accreting hot plasma, namely corona, near central SMBHs appearing in the mm band due to the strong synchrotron self-absorption (SSA) effect by the coronal component itself (Di Matteo et al., 1997; Laor & Behar, 2008; Veledina et al., 2011; Inoue & Doi, 2014; Raginski & Laor, 2016).
Previous observations had presented inconclusive signs of a new component in the radio spectra of several Seyfert galaxies. The putative new component – so-called mm excess – had been explored only in the short cm regime (Antonucci & Barvainis, 1988; Barvainis et al., 1996) or a monochromatic mm band (Behar et al., 2015, 2018). Recently, a multi-band observation at 7 mm and longer wavelengths presented a possible sign for the existence of mm excess (Doi & Inoue, 2016). Synchrotron emission from thermal hot plasma and free-free emission from surrounding ionized materials are found to be difficult to explain the putative mm-excess in terms of luminosity (Field & Rogers, 1993; Laor & Behar, 2008; Doi & Inoue, 2016). However, it is still inconclusive evidence because a paucity of multi-band data at shorter wavelengths. Investigation using conventional mm telescopes has been also hampered by the contamination of extended galactic emission. Thus, the existence as well as physical origins of those excesses are still veiled in mystery. High angular resolution and multi-band observations are required for the detection and understanding of compact coronal synchrotron emission (Inoue & Doi, 2014).
By utilizing the Atacama Large Millimeter/submillimeter Array (ALMA), we have obtained new measurements for nearby radio-quiet Seyferts IC 4329A and NGC 985 at 12 frequency bands from 90 GHz up to 250 GHz. The observed radio emission is hardly contaminated by dust because of the sub-arcsec resolution of ALMA. We further analyzed archival cm data from the Karl G. Jansky Very Large Array (VLA) and Australia Telescope Compact Array (ATCA). In this paper, we report our new observational results.
This paper is organized as follows. In Section 2, we introduce our observations and data analysis. In Section 3, we present our results. Discussion and conclusion are given in Sections 4 and 5, respectively.
2 Observations
2.1 Target objects
IC 4329A is a southern Seyfert 1.2 galaxy at (Willmer et al., 1991) whose central black hole mass is (Nikolajuk et al., 2004; Markowitz, 2009). The host galaxy is an edge-on spiral galaxy in a pair with IC 4329 separated by arcmin. IC 4329A is one of the brightest X-ray Seyferts and shows a typical spectrum of radio-quiet Seyferts in the hard X-ray band (Zdziarski et al., 1994; Madejski et al., 1995; Zdziarski et al., 1996; Brenneman et al., 2014a).
NGC 985 is a southern Seyfert 1 galaxy at (Fisher et al., 1995) whose black hole mass is (Kim et al., 2008). NGC 985 is a peculiar galaxy with a prominent ring-shaped zone at several kiloparsecs from the nucleus (de Vaucouleurs & de Vaucouleurs, 1975), suggesting that the galaxy is under- going a merging process. The galaxy contains a double nucleus, Seyfert nucleus, and non-AGN (Perez Garcia & Rodriguez Espinosa, 1996). The nuclei are separated by 3 arcsec.
2.2 Radio observations with ALMA
We observed IC 4329A and NGC 985 on October 2nd, 2016 and August 18th, 2017, respectively, using the ALMA Band 3, 4, and 6 receivers (project-ID: 2016.1.01140.S, PI = Y. Inoue).
For the IC 4329A observation, J1427-4206 and J1351-2912 were observed as a flux calibrator and phase calibrator, respectively. Additionally, J1349-3056 was also observed for Band 6 as a water vapor radiometer calibrator. For the NGC 985 observation, J0238+1636 and J0241-0815 were observed as a flux calibrator and phase calibrator, respectively, for Bands 3 and 4, while J0334-4008 and J0241-0815 were observed as a flux calibrator and phase calibrator, respectively, for Band 6. Additionally, J0243-0550 was also observed as a water vapor radiometer calibrator.
Four spectral windows (SPWs) with a bandwidth of 2.000 GHz were placed at sky frequencies centered at 90.5 GHz, 92.4 GHz, 102.5 GHz, and 104.5 GHz in Band 3, at 138.0 GHz, 139.9 GHz, 150.0 GHz, and 152.0 GHz in Band 4, and at 213.0 GHz, 215.0 GHz, 229.0 GHz, and 231.0 GHz in Band 6. The correlation was made in the Time Division Mode with 128 channels for an SPW.
The data were calibrated using the ALMA reduction package CASA version 4.7.0 (McMullin et al., 2007). We reduced raw data using pipeline scripts provided by the ALMA regional center.
For IC 4329A observation, the flux scaling factors were determined with reference to the quasar J1427-4206 at all bands. For NGC 985 observations, the flux scaling factors were determined with reference to the quasar J0238+1636 at Bands 3 and 4, and J0334-4008 at Band 6. Their flux densities are regularly monitored by the ALMA observatory. We queried the ALMA calibrator database to make the assurance doubly sure. J1427-4206 was stable ( and at Bands 3 and 6, respectively) during the period before and after the dates of ALMA observations. The flux scaling factors used in the pipelines were based on a power-law spectrum that was determined from Band-3/7 observations carried out by the observatory within 7 days of our ALMA observations. The flux densities of J0238+1636 and J0334-4008 were determined from Band-3/7 observations carried out by the observatory 2 days before our ALMA observations.
We confirmed that no line emission practically contributes to the observed frequency ranges. Although a possible absorption feature by the Earth’s atmosphere is seen at (spw 3 in Band 6), this does not affect the photometry of continuum emission.
The calibrated visibilities were exported for four individual SPWs, and processed for mapping and CLEANing using natural weighting. Consequently, we obtained four continuum images for each band. The images were analyzed with the CASA. The ratio between peak flux density and integrated flux density was %, %, and % for Band 3, 4, and 6, respectively, in the case of IC 4329A, while it was %, %, and % in the case of NGC 985. Thus, unresolved sources dominate the emission in all the images.
The emission center of the IC 4329A nucleus is located at 13h49m19.26170s , 18′34.22145 (J2000) at 150 GHz. The emission center of the NGC 985 nucleus is located at 02h34m37.84028s , 47′16.07808 (J2000) at 150 GHz. These are the best determined positions ever for these Seyfert nuclei where a systematic error is included. An astrometric position error on the phase calibrator was determined to be in a sub-milli-arcsecond level in the 2nd International Celestial Reference Frame (Ma et al., 2009).
The flux measurements were performed by a Gaussian fit using the CASA task IMFIT. Results are summarized in Tables. 1 and 2. We assume that the accuracy of the absolute amplitude calibration is 5% for Bands 3 and 4, and 10% for Band 6 following the ALMA Proposer’s Guide. No other emission was found in a field of view of , even on higher signal-to-noise images that we made from visibilities concatenated throughout the four SPWs.
| Date | |||||
| (GHz) | (mJy) | (mJy/beam) | (arcsecarcsec) | (deg) | (yr-m-d) |
| (1) | (2) | (3) | (4) | (5) | (6) |
| ALMA | |||||
| 90.5 | 2016-10-02 | ||||
| 92.4 | 24.6 | 2016-10-02 | |||
| 102.5 | 20.0 | 2016-10-02 | |||
| 104.5 | 23.7 | 2016-10-02 | |||
| 138.0 | 2016-10-02 | ||||
| 139.9 | 18.9 | 2016-10-02 | |||
| 150.0 | 26.0 | 2016-10-02 | |||
| 152.0 | 9.6 | 2016-10-02 | |||
| 213.0 | 21.8 | 2016-10-02 | |||
| 215.0 | 62.6 | 2016-10-02 | |||
| 229.0 | 34.9 | 2016-10-02 | |||
| 231.0 | 19.5 | 2016-10-02 | |||
| VLA | |||||
| 1.4 | 1995-01-18 | ||||
| 1.4 | 1998-02-08 | ||||
| 1.5 | 1991-03-08 | ||||
| 4.9 | 1991-03-08 | ||||
| 4.9 | 1986-04-03 | ||||
| 8.4 | 1995-07-15 | ||||
| 8.4 | 1998-02-08 | ||||
| ATCA | |||||
| 4.8 | 2008-04-19 | ||||
| 5.5 | 2010-03-04 | ||||
| 8.6 | 2008-04-19 | ||||
| 9.0 | 2010-03-04 | ||||
| 33.0 | 2009-04-25 | ||||
| 35.0 | 2009-04-25 | ||||
Col. (1) center frequency; Col. (2) total flux density; Col. (3) image r.m.s. noise in the blank sky; Col. (4)–(5) synthesized beam sizes along the major axis, minor axis, and position angle of the major axis, respectively; Col. (6) observation date.
| Date | |||||
| (GHz) | (mJy) | (mJy/beam) | (arcsecarcsec) | (deg) | (yr-m-d) |
| (1) | (2) | (3) | (4) | (5) | (6) |
| ALMA | |||||
| 90.5 | 2017-08-18 | ||||
| 92.4 | 2017-08-18 | ||||
| 102.5 | 2017-08-18 | ||||
| 104.5 | 2017-08-18 | ||||
| 138.0 | 2017-08-18 | ||||
| 139.9 | 2017-08-18 | ||||
| 150.0 | 2017-08-18 | ||||
| 151.8 | 2017-08-18 | ||||
| 213.0 | 2017-08-18 | ||||
| 215.0 | 2017-08-18 | ||||
| 229.2 | 2017-08-18 | ||||
| 231.0 | 2017-08-18 | ||||
| VLA | |||||
| 1.4 | 1982-05-30 | ||||
| 4.9 | 1982-05-30 | ||||
| 14.9 | 1985-07-28 | ||||
| 1.5 | 1986-11-08 | ||||
| 4.9 | 1986-11-08 | ||||
| 1.5 | 1990-05-23 | ||||
| 4.9 | 1990-05-23 | ||||
| 8.4 | 1990-05-23 | ||||
| 22.5 | 2001-09-28 | ||||
| 8.5 | 2003-06-19 | ||||
| 8.5 | 2003-12-24 | ||||
| 14.9 | 2003-12-24 | ||||
| 22.5 | 2003-12-24 | ||||
| 43.3 | 2003-12-24 | ||||
| ATCA | |||||
| 19.0 | 2009-10-15 | ||||
| 19.0 | 2009-10-16 | ||||
| 19.0 | 2009-10-17 | ||||
| 21.0 | 2009-10-15 | ||||
| 21.0 | 2009-10-16 | ||||
| 21.0 | 2009-10-17 | ||||
Same as in Table. 1.
2.3 Low-frequency radio data from VLA and ATCA observations
We retrieved archival data obtained using the VLA and the ATCA from the US National Radio Astronomy Observatory and the Australia Telescope National Facility, respectively, to examine low-frequency components associated with the Seyfert nuclei. For IC 4329A we retrieved all available data from the data archive centers; the observation codes were AE76, AM384, AS230, and AK394 for the VLA data and C1803 and C1964 for the ATCA data. For NGC 985, we retrieved archival data with codes AB417 and AB489 for the VLA data and C1964 for the the ATCA data. Additionally, we used the results of previous VLA studies for NGC 985 (Doi & Inoue, 2016). We also retrieved and analyzed the 1.4-GHz images from the NRAO VLA Sky Survey (NVSS; (Condon et al., 1998)).
The VLA data were reduced in the standard manners for continuum observations using the software Astronomical Image Processing System (AIPS; Greisen, 2003). Calibrations were carried out in accordance with the guidelines for the accurate flux density bootstrapping. Flux density bootstrapping covers the corrections for the elevation dependences of the gain curve for antenna elements and of atmospheric opacity. It also covers self-calibration procedures with the source structure models for standard flux calibrators and with a point source model for gain calibrators.
The accuracy of flux scaling is 1%–2% at 8.4 GHz or lower in VLA observations; we assume a 3% error in the present study, conservatively. All target images were generated from calibrated visibilities with natural weighting in addition to deconvolution through the CLEAN algorithm. A single emission component was clearly detected at the position of the nucleus. The source identification was performed by Gaussian model fitting on each image using the AIPS task JMFIT. The final error of the flux density measurements was determined by root-sum-squares of the Gaussian fitting error and the flux scaling uncertainty. The fitting results were indicative of an underlying emission that was slightly resolved to be a few arcsec in diameter on images with a compact array configuration. In NGC 985, it is known that a radio emitting region of star formation was located westward from the nucleus (Appleton et al., 2002). The NVSS image actually shows a westward elongation. We made image-based model fitting with two components and subtracted the contribution of the western component from the total flux densities for the NVSS and the AB417 at 1.5 GHz.
The ATCA data were also reduced in the standard manners using the software Miriad (Sault et al., 1995). The ATCA observation and data analysis procedure also follows a philosophy that is very similar to the VLA observation. Corrections to atmospheric opacity, antenna positions, and system temperature measurements were applied to the data obtained at 19 GHz or higher frequencies. We assume flux scaling errors of 10% and 3% at 33/35 GHz and other lower frequencies, respectively, according to the ATCA user guide. Target images were synthesized with natural weighting and the CLEAN deconvolution. Flux density measurements were carried out in the same manner as in the VLA data analysis, using the AIPS task JMFIT. The VLA and ATCA results are listed in Tables 1 and 2.
2.4 X-ray data analysis of NGC 985
For the thermal coronal properties of IC 4329A, we adopted the data analysis results of the joint Suzaku and NuSTAR observations toward IC 4329A (Brenneman et al., 2014b). They found that the coronal temperature and the Thomson scattering optical depth are 50 keV and 2.34, respectively, assuming a spherical geometry. For NGC 985, we analyze archival NuSTAR data in order to derive coronal properties. Coronal parameters are determined by characteristics of primary high-energy continuum. Therefore, we restrict our analysis to 5–79 keV in order to avoid the effects of low-energy absorption, which are poorly constrained by NuSTAR only.
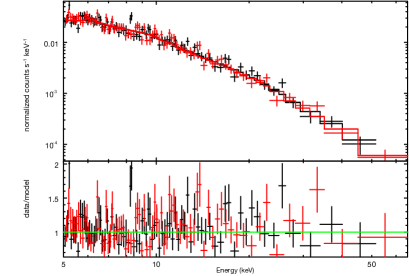
NuSTAR is a focusing hard X-ray telescope providing a bandpass of 3–79 keV with a spectral resolution of keV (Harrison et al., 2013). NuSTAR observed NGC 985 on August 11, 2013 (obsid: 60061025002). After eliminating Earth occultations, passages through the South Atlantic Anomaly, and other periods of high background, the NuSTAR observation reached ks of on-source time for focal plane module A (FPMA) and focal plane module B (FPMB).
We reduced the data using the NuSTAR Data Analysis Software (NuSTARDAS) and calibration version 1.4.1. We filtered the event files and applied the default depth correction using the nupipeline task. We used circular extraction regions, 45 arcsec in radius, for the source and background, with the source region centered on NGC 985 and the background taken from the corner of the same detector, as close as possible to the source without being contaminated by the point spread function wings. Spectra and images were extracted and response files were generated using the nuproducts task. To minimize systematic effects, we fitted spectra from FPMA and FPMB simultaneously. We allowed the absolute normalization for both modules to vary. We found a cross-calibration factor of for FPMB relative to FPMA.
Given the short exposure, we followed the analysis procedure of IC 4329A (Brenneman et al., 2014a). we first evaluated the NuSTAR spectrum with the pexmon model (Nandra et al., 2007), which incorporates both primary emission and reflection. We fixed the abundance of elements to the solar abundances, the inclination angle of , otherwise we cannot get any constraints on other parameters. The foreground Galactic column density was set to (Kalberla et al., 2005). We got , , and with a goodness-of-fit of .
Then, to derive physical parameter of the corona, we employed the compTT model (Titarchuk, 1994), which calculates the Comptonization spectra. compTT does not self-consistently calculate the reflection component. Thus, we added the reflection component by using pexmon. We set the cutoff energy in pexmon to 2.7 times of the coronal electron temperature. We fixed the other values of the reflection component to the values found for the pexmon fit and include only the reflection part of the model. We found the coronal temperature of and the Thomson scattering optical depth of with a goodness-of-fit of . In order to obtain the better fit, we may need further exposure. The resulting spectrum is shown in Figure. 1.
3 Results
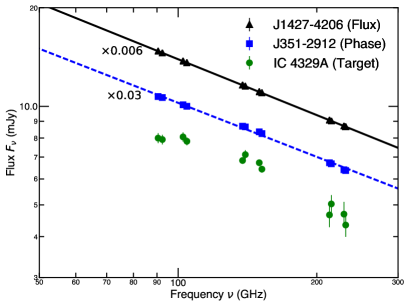
Figure. 2 shows the mm spectrum of our target object IC 4329A together with those of the flux calibrator J1427-4206 and the phase calibrator J1351-2912. The flux of J1427-4206 and J1351-2912 in Figure. 2 is renormalized by a factor of 0.006 and 0.03, respectively, for the comparison with the target object IC 4329A. The spectra of J1427-4206 and J1351-2912 are well reproduced by single power-law models, while our target object IC 4329A shows spectral curvature (Figure. 2). We do not see such curvature features in the ALMA data of NGC 985.
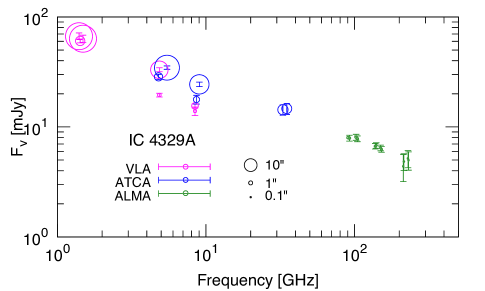
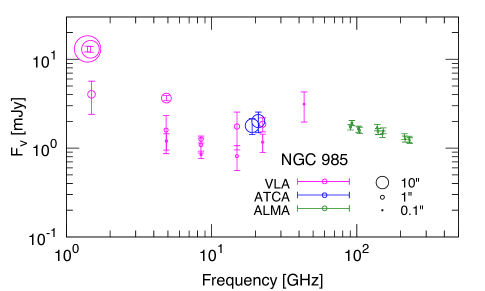
The left and right panel of Figure. 3 shows the observed cm-mm radio spectral data of IC 4329A and NGC 985, respectively. Different beam size data are included ranging from 0.15” to 45.0” for IC 4329A and from 0.10” to 45.0” for NGC 985 (Tables 1 and 2). Geometric mean of synthesized beam sizes at major and minor axes for each data is also represented in the Figure. In both objects, a clear tendency of higher flux densities at larger beam sizes is apparent. For large beam size data sets, it is naturally expected that extended emission such as host galaxy component contributes to photometry, while such extended emission does not significantly contribute to small beam size data sets. Therefore, consideration of observational beam size is important for the understanding the emission from the compact regions.
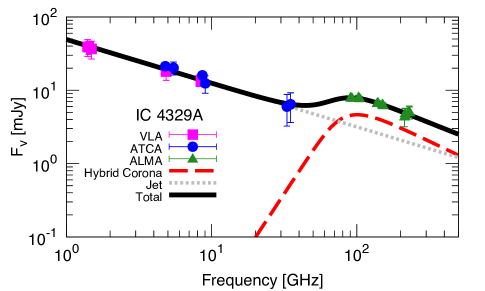
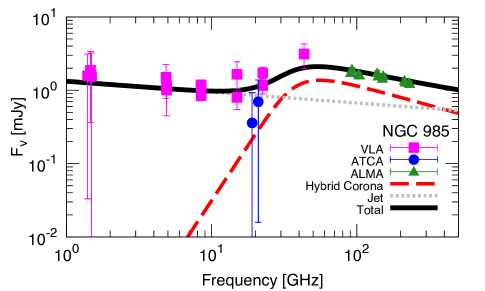
In order to investigate the origin of the radio emission, we simultaneously fit ALMA, VLA, and ATCA measurements between 1 GHz and 250 GHz with four spectral components. One is synchrotron emission from a hybrid corona (Inoue & Doi, 2014) in which fitting parameters are the plasma size (), the magnetic field strength (), the spectral index of non-thermal electrons (), and the energy fraction of non-thermal electrons (). The coronal temperature and the Thomson scattering optical depth are determined by X-ray spectral analysis (e.g., Brenneman et al., 2014b). We adopt spherical geometry for coronae for simplicity. We define the distribution of electrons in hybrid coronae as relativistic Maxwellian distribution at and at , where is the electron Lorentz factor and is the break Lorentz factor. By setting , can be obtained. Second is a jet synchrotron emission component represented by the form setting . The other two components represent galactic thermal bremsstrahlung and galactic synchrotron of the form and , where is the beam size along the major axis, is that along the minor axis, and gives the angular size of the star formation activity region around the Seyfert nuclei. We set a spectral index of for the thermal free-free component and the spectral index of for the galactic synchrotron component (Magnelli et al., 2015). Since the angular resolutions of observations by VLA and ATCA were not as good as that of ALMA (Figure. 3), the measured fluxes by VLA and ATCA must have been contaminated not only by the jet but also by extended emission due to star formation activity in the host galaxy. Therefore, we consider beam sizes and in our modeling.
The left panel of Figure. 4 shows the cm-mm radio spectrum of IC 4329A after we subtract beam-size dependent extended galactic emission components. The mm excess is clearly visible in the cm–mm spectrum, which determines the properties of the coronae. The measured ALMA spectrum of IC 4329A exhibits flattening below 100 GHz, while calibrators’ spectra exhibit simple power-law shape (Figure. 2). This indicates SSA in a very compact region in the order of several tens of the Schwarzschild radius. The measured spectra are well reproduced by the assumed models without time variability.
The coronal properties of IC 4329A are estimated as with G and based on our model fitting. The coronal temperature and the Thomson scattering optical depth are set to 50 keV and 2.34, respectively (Brenneman et al., 2014b). We fix the energy fraction of non-thermal electrons as 4% of that of the total electron population. This value is inferred from the explanation of the cosmic MeV gamma-ray background radiation by Seyferts (Inoue et al., 2008). Because , , and are closely tied (Inoue & Doi, 2014), current radio data do not allow us to solve these three parameters simultaneously without decoupling thermal and non-thermal components. Future simultaneous radio and sub-MeV gamma-ray observations will enable us to estimate more precise model parameters. Even if we vary from 0.01 to 0.30, the parameters , , and are consistent within an uncertainty of 1-. Current X-ray observations of Seyferts constrain (Fabian et al., 2017).
The right panel of Figure. 4 shows the cm-mm radio spectrum of NGC 985 after subtracting extended galactic components, same as in IC 4329A. Again, the mm excess is clearly seen. We fit the spectrum with the same models for IC 4329A. For the X-ray coronal properties, we adopt the coronal temperature and the optical depth due to Thomson scattering of 29 keV and 3.5, respectively (see Section. 2.4). The coronal properties of NGC 985 are estimated as , setting . The obtained parameters for both systems are summarized in Table. 3.
| Parameter | IC 4329A | NGC 985 |
|---|---|---|
| Hybrid corona | ||
| (G) | ||
| () | ||
| (fixed) | (fixed) | |
| Jet | ||
| (mJy) | ||
| Star formation activity | ||
| (mJy) | ||
| (mJy) | ||
| (arcsec) | ||
The errors and the upper limit correspond to 1- uncertainties. The upper limit is the 1- upper limit.
4 Discussion
4.1 Variability
Both IC 4329A and NGC 985 are known to be relatively steady in X-ray ( % of flux variability) during NuSTAR and ALMA observations (Oh et al., 2018; Kawamuro et al., 2018). Such small variabilities will vary and for about 10%, which is smaller than 1- uncertainties of parameters. Here, compact jets explaining the cm data are also potentially variable. But, the multi-epoch cm data are consistent with a single power law, indicating no significant variability in the jet components in both Seyferts.
4.2 Contribution of Other Components
Thermal dust emission might contribute to the mm flux (e.g. Doi & Inoue, 2016). However, given the ALMA spectral shapes, the dust scenario is clearly disfavored because the gray body spectrum from thermal dust shows a much harder spectrum. IC 4329A is known to have a hot nuclear dust component (Mehdipour & Costantini, 2018). The expected compact nuclear dust contamination into the ALMA bands is less than mJy.
Would a pure thermal coronal synchrotron emission scenario explain the observed spectra (Inoue & Doi, 2014; Raginski & Laor, 2016)? Considering the X-ray measurements (temperature and Thomson scattering optical depth), the required size for pure thermal coronae become with G for IC 4329A and with G for NGC 985. Such large coronal size is naturally expected for pure thermal synchrotron cases (Inoue & Doi, 2014; Raginski & Laor, 2016). However, the inferred coronal size are too large comparing to the expected coronal size from other measurements. For example, a combined optical and X-ray study of 51 unobscured AGNs revealed the average corona radii of (Jin et al., 2012). Microlensing observations toward the Lensed Quasar Q J0158-4325 also inferred the half-light radius for X-ray emission of (Morgan et al., 2012). Given these size constraints, pure thermal electron distribution would be difficult to explain the measured radio spectral data of the two Seyferts.
Here, the SSA peak flux ( mJy) and frequency ( GHz) position are observationally fixed, while the number of high energy electron () in pure thermal distribution is much less than that in hybrid distribution cases. Thus, the required size and magnetic field strength for thermal models become larger than those in the case of hybrid coronae. We note that the size and magnetic field of plasma can also be derived once the SSA frequency and flux are determined. The SSA optical depth is defined as where is the synchrotron absorption coefficient. The SSA frequency is given by . The optically thin synchrotron flux is expressed as where is the synchrotron emissivity, is the volume of the plasma, and is the distance to the object. By adopting synchrotron absorption and emission coefficients (Rybicki & Lightman, 1979) and setting electron distribution, one can derive and by solving above equations.
4.3 Corona Heating Mechanism and Its Structure
It is believed that accretion disk coronae are heated by the release of magnetic field energy, like in the Sun, while cooling is dominated by Comptonization by disk photons in the case of disk coronae (Haardt & Maraschi, 1991; Liu et al., 2002). Based on our measurement, the plasma beta (the ratio of gas pressure to magnetic pressure, ) in the accretion disk coronae becomes for both objects. The inferred plasma beta is higher than that typically observed in the solar corona, – (Gary, 2001). Given our measurements of two Seyferts, the magnetic heating rate in the coronae is estimated as (i.e., magnetic energy release rate at the Alfvén speed), while the Compton cooling rate by disk photons is setting 10% of the Eddington luminosity. Therefore, magnetic field energy is insufficient for keeping coronae as hot as observed in X-rays.
Here, if the inner part of the accretion disk at several tens of the Schwarzschild radius is composed of a cold disk and a hot accretion flow like an advection-dominated accretion flow (e.g., Yamada et al., 2013), the advection-heated inner accretion region can play the role of coronae (Merloni et al., 2000; Kawabata & Mineshige, 2010). Observations of a Galactic X-ray binary Cygnus X-1 suggests such an accretion disk picture in order to explain its X-ray spectra and its variability (Yamada et al., 2013; Basak et al., 2017). In this case, the hot accretion flow would be heated up to electron rest-mass energy (Manmoto et al., 1997). Based on the self-similar solutions of hot accretion flows (Kato et al., 2008; Yuan & Narayan, 2014), the magnetic field strength can be estimated as G at the size of assuming the parameter of 0.1 and the mass accretion rate of 0.1% of the Eddington rate in the inner hot accretion flow. Following the numerical general relativistic magnetohydrodynamic simulations of hot accretion flows, decreases with increasing distance away from the midplane of the disk and becomes above approximately two density scale heights (De Villiers et al., 2003, 2005). These are consistent with our radio observation results.
Typically, seyferts have much higher accretion rate and the accretion rate can be determined with reasonable accuracy from the observed optical flux once the black hole mass is known (e.g., Davis & Laor, 2011). However, optical emission arises at the outer thin disc region, i.e. the inferred high mass accretion rate is the value at the outer region. The accurate mass accretion rate in the inner region is still not well understood because AGN disk emission peaks in the UV regime which cannot be directly observed due to dust extinction. Moreover, Brenneman et al. (2014b) found the equivalent width of the broad iron Fe K line emission is 24–42 eV corresponding to the location of cold material at . This suggests that the optically thick disk may not extend down to the inner region. Therefore, the accretion rate in the inner region could be lower than that measured from optical fluxes.
This cold + hot accretion flow scenario may also present an inconsistency with the general picture of broad iron Fe K line emissions originating from near the innermost stable circular orbit and soft X-ray lags (Reynolds, 2014; Kara et al., 2016). However, line profiles of Fe K lines in Seyferts could be narrower than ever thought, implying the far location of neutral iron, by considering hard X-ray variabilities (Noda et al., 2011) or double partial covering materials (Miyakawa et al., 2012). For the IC 4329A, as described above, the location of the origin of the Fe K line is found to be at (Brenneman et al., 2014b). The origin of soft X-ray lags is also under debate (Miller et al., 2010; Mizumoto et al., 2018). Future detailed X-ray and radio observations will be important to reconcile these problems.
4.4 On the Origin of the Cosmic MeV Gamma-ray Background Radiation
The possible evidence of non-thermal electrons in coronae would shed new light on the origin of the cosmic MeV gamma-ray background, which has been long discussed (see e.g., Inoue, 2014, for reviews). One possible candidate is the MeV non-thermal photon spectral tail expected in Seyfert spectra arisen from non-thermal electrons in coronae (see Inoue et al., 2008, for details), while blazars are also considered as a candidate (Ajello et al., 2009). Due to a lack of MeV gamma-ray observations, the origin of the cosmic MeV gamma-ray background is still veiled in mystery, although anisotropy measurements may distinguish these two scenarios (Inoue et al., 2013).
Our radio observations toward nearby Seyferts suggested possible existence of non-thermal electrons in coronae, which is anticipated for the Seyfert scenario on the MeV gamma-ray background. The required non-thermal electron energy fraction for the Seyfert scenario is approximately % with a spectral index of . Future simultaneous radio and MeV gamma-ray observations will be able to quantify amount of non-thermal electrons in coronae and reveal the origin of the MeV background radiation.
5 Conclusion
By utilizing ALMA, we have obtained new measurements for nearby radio-quiet Seyferts IC 4329A and NGC 985 at 12 frequency bands from 90 GHz up to 250 GHz. We further analyzed archival cm data from VLA and ATCA. By combining the mm and cm data sets, the spectra of compact components clearly show the excesses in the mm band.
The measured spectra suggest that the coronal magnetic field is approximately Gauss on scales of from the SMBHs for the two Seyferts. This magnetic field strength is weaker than the prediction from the magnetically heated accretion corona scenario (e.g., Liu et al., 2002). Our mm observation also provides observational evidence of non-thermal electron population in coronae, which may suggest possible contribution of Seyferts to the cosmic MeV gamma-ray background radiation through the Comptonization process of such non-thermal electrons (Inoue et al., 2008).
References
- Ajello et al. (2009) Ajello, M., Costamante, L., Sambruna, R. M., et al. 2009, ApJ, 699, 603, doi: 10.1088/0004-637X/699/1/603
- Antonucci & Barvainis (1988) Antonucci, R., & Barvainis, R. 1988, ApJl, 332, L13, doi: 10.1086/185256
- Appleton et al. (2002) Appleton, P. N., Charmandaris, V., Gao, Y., et al. 2002, ApJ, 566, 682, doi: 10.1086/338227
- Barvainis et al. (1996) Barvainis, R., Lonsdale, C., & Antonucci, R. 1996, AJ, 111, 1431, doi: 10.1086/117888
- Basak et al. (2017) Basak, R., Zdziarski, A. A., Parker, M., & Islam, N. 2017, MNRAS, 472, 4220, doi: 10.1093/mnras/stx2283
- Behar et al. (2015) Behar, E., Baldi, R. D., Laor, A., et al. 2015, MNRAS, 451, 517, doi: 10.1093/mnras/stv988
- Behar et al. (2018) Behar, E., Vogel, S., Baldi, R. D., Smith, K. L., & Mushotzky, R. F. 2018, MNRAS, 478, 399, doi: 10.1093/mnras/sty850
- Blandford & Znajek (1977) Blandford, R. D., & Znajek, R. L. 1977, MNRAS, 179, 433, doi: 10.1093/mnras/179.3.433
- Brenneman et al. (2014a) Brenneman, L. W., Madejski, G., Fuerst, F., et al. 2014a, ApJ, 781, 83, doi: 10.1088/0004-637X/781/2/83
- Brenneman et al. (2014b) —. 2014b, ApJ, 788, 61, doi: 10.1088/0004-637X/788/1/61
- Condon et al. (1998) Condon, J. J., Cotton, W. D., Greisen, E. W., et al. 1998, AJ, 115, 1693, doi: 10.1086/300337
- Davis & Laor (2011) Davis, S. W., & Laor, A. 2011, ApJ, 728, 98, doi: 10.1088/0004-637X/728/2/98
- de Vaucouleurs & de Vaucouleurs (1975) de Vaucouleurs, G., & de Vaucouleurs, A. 1975, ApJL, 197, L1, doi: 10.1086/181762
- De Villiers et al. (2003) De Villiers, J.-P., Hawley, J. F., & Krolik, J. H. 2003, ApJ, 599, 1238, doi: 10.1086/379509
- De Villiers et al. (2005) De Villiers, J.-P., Hawley, J. F., Krolik, J. H., & Hirose, S. 2005, ApJ, 620, 878, doi: 10.1086/427142
- Di Matteo et al. (1997) Di Matteo, T., Celotti, A., & Fabian, A. C. 1997, MNRAS, 291, 805, doi: 10.1093/mnras/291.4.805
- Doi & Inoue (2016) Doi, A., & Inoue, Y. 2016, PASJ, 68, 56, doi: 10.1093/pasj/psw052
- Fabian et al. (2017) Fabian, A. C., Lohfink, A., Belmont, R., Malzac, J., & Coppi, P. 2017, MNRAS, 467, 2566, doi: 10.1093/mnras/stx221
- Field & Rogers (1993) Field, G. B., & Rogers, R. D. 1993, ApJ, 403, 94, doi: 10.1086/172185
- Fisher et al. (1995) Fisher, K. B., Huchra, J. P., Strauss, M. A., et al. 1995, The Astrophysical Journal Supplement Series, 100, 69, doi: 10.1086/192208
- Gary (2001) Gary, G. A. 2001, Sol. Phys., 203, 71, doi: 10.1023/A:1012722021820
- Gnedin et al. (2014) Gnedin, Y. N., Globina, V. N., Piotrovich, M. Y., Buliga, S. D., & Natsvlishvili, T. M. 2014, ApJ, 57, 163, doi: 10.1007/s10511-014-9323-z
- Greisen (2003) Greisen, E. W. 2003, in Astrophysics and Space Science Library, Vol. 285, Information Handling in Astronomy - Historical Vistas, ed. A. Heck, 109
- Haardt & Maraschi (1991) Haardt, F., & Maraschi, L. 1991, ApJl, 380, L51, doi: 10.1086/186171
- Harrison et al. (2013) Harrison, F. A., Craig, W. W., Christensen, F. E., et al. 2013, ApJ, 770, 103, doi: 10.1088/0004-637X/770/2/103
- Inoue (2014) Inoue, Y. 2014, ArXiv e-prints. https://arxiv.org/abs/1412.3886
- Inoue & Doi (2014) Inoue, Y., & Doi, A. 2014, PASJ, 66, L8, doi: 10.1093/pasj/psu079
- Inoue et al. (2013) Inoue, Y., Murase, K., Madejski, G. M., & Uchiyama, Y. 2013, ApJ, 776, 33, doi: 10.1088/0004-637X/776/1/33
- Inoue et al. (2008) Inoue, Y., Totani, T., & Ueda, Y. 2008, ApJL, 672, L5, doi: 10.1086/525848
- Jin et al. (2012) Jin, C., Ward, M., Done, C., & Gelbord, J. 2012, MNRAS, 420, 1825, doi: 10.1111/j.1365-2966.2011.19805.x
- Kalberla et al. (2005) Kalberla, P. M. W., Burton, W. B., Hartmann, D., et al. 2005, A&A, 440, 775, doi: 10.1051/0004-6361:20041864
- Kara et al. (2016) Kara, E., Alston, W. N., Fabian, A. C., et al. 2016, MNRAS, 462, 511, doi: 10.1093/mnras/stw1695
- Kato et al. (2008) Kato, S., Fukue, J., & Mineshige, S. 2008, Black-Hole Accretion Disks — Towards a New Paradigm —
- Kawabata & Mineshige (2010) Kawabata, R., & Mineshige, S. 2010, PASJ, 62, 621, doi: 10.1093/pasj/62.3.621
- Kawamuro et al. (2018) Kawamuro, T., Ueda, Y., Shidatsu, M., et al. 2018, ArXiv e-prints. https://arxiv.org/abs/1807.00874
- Kim et al. (2008) Kim, M., Ho, L. C., Peng, C. Y., et al. 2008, ApJ, 687, 767, doi: 10.1086/591663
- Laor & Behar (2008) Laor, A., & Behar, E. 2008, MNRAS, 390, 847, doi: 10.1111/j.1365-2966.2008.13806.x
- Liu et al. (2002) Liu, B. F., Mineshige, S., & Shibata, K. 2002, ApJl, 572, L173, doi: 10.1086/341877
- Lopez-Rodriguez et al. (2015) Lopez-Rodriguez, E., Packham, C., Jones, T. J., et al. 2015, MNRAS, 452, 1902, doi: 10.1093/mnras/stv1410
- Ma et al. (2009) Ma, C., Arias, E. F., Bianco, G., et al. 2009, IERS Technical Note, 35
- Madejski et al. (1995) Madejski, G. M., Zdziarski, A. A., Turner, T. J., et al. 1995, ApJ, 438, 672, doi: 10.1086/175111
- Magnelli et al. (2015) Magnelli, B., Ivison, R. J., Lutz, D., et al. 2015, A&A, 573, A45, doi: 10.1051/0004-6361/201424937
- Manmoto et al. (1997) Manmoto, T., Mineshige, S., & Kusunose, M. 1997, ApJ, 489, 791, doi: 10.1086/304817
- Markowitz (2009) Markowitz, A. 2009, ApJ, 698, 1740, doi: 10.1088/0004-637X/698/2/1740
- Martí-Vidal et al. (2015) Martí-Vidal, I., Muller, S., Vlemmings, W., Horellou, C., & Aalto, S. 2015, Science, 348, 311, doi: 10.1126/science.aaa1784
- McMullin et al. (2007) McMullin, J. P., Waters, B., Schiebel, D., Young, W., & Golap, K. 2007, in Astronomical Society of the Pacific Conference Series, Vol. 376, Astronomical Data Analysis Software and Systems XVI, ed. R. A. Shaw, F. Hill, & D. J. Bell, 127
- Mehdipour & Costantini (2018) Mehdipour, M., & Costantini, E. 2018, ArXiv e-prints. https://arxiv.org/abs/1808.04628
- Merloni et al. (2000) Merloni, A., Di Matteo, T., & Fabian, A. C. 2000, MNRAS, 318, L15, doi: 10.1046/j.1365-8711.2000.03943.x
- Miller et al. (2010) Miller, L., Turner, T. J., Reeves, J. N., & Braito, V. 2010, MNRAS, 408, 1928, doi: 10.1111/j.1365-2966.2010.17261.x
- Miyakawa et al. (2012) Miyakawa, T., Ebisawa, K., & Inoue, H. 2012, PASJ, 64, 140, doi: 10.1093/pasj/64.6.140
- Mizumoto et al. (2018) Mizumoto, M., Done, C., Hagino, K., et al. 2018, MNRAS, 478, 971, doi: 10.1093/mnras/sty1114
- Morgan et al. (2012) Morgan, C. W., Hainline, L. J., Chen, B., et al. 2012, ApJ, 756, 52, doi: 10.1088/0004-637X/756/1/52
- Nandra et al. (2007) Nandra, K., O’Neill, P. M., George, I. M., & Reeves, J. N. 2007, MNRAS, 382, 194, doi: 10.1111/j.1365-2966.2007.12331.x
- Nikolajuk et al. (2004) Nikolajuk, M., Papadakis, I. E., & Czerny, B. 2004, MNRAS, 350, L26, doi: 10.1111/j.1365-2966.2004.07829.x
- Noda et al. (2011) Noda, H., Makishima, K., Yamada, S., et al. 2011, PASJ, 63, S925, doi: 10.1093/pasj/63.sp3.S925
- Oh et al. (2018) Oh, K., Koss, M., Markwardt, C. B., et al. 2018, ApJS, 235, 4, doi: 10.3847/1538-4365/aaa7fd
- Perez Garcia & Rodriguez Espinosa (1996) Perez Garcia, A. M., & Rodriguez Espinosa, J. M. 1996, AJ, 112, 1863, doi: 10.1086/118147
- Raginski & Laor (2016) Raginski, I., & Laor, A. 2016, MNRAS, 459, 2082, doi: 10.1093/mnras/stw772
- Reynolds (2014) Reynolds, C. S. 2014, Space Science Reviews, 183, 277, doi: 10.1007/s11214-013-0006-6
- Rybicki & Lightman (1979) Rybicki, G. B., & Lightman, A. P. 1979, Radiative processes in astrophysics
- Sault et al. (1995) Sault, R. J., Teuben, P. J., & Wright, M. C. H. 1995, in Astronomical Society of the Pacific Conference Series, Vol. 77, Astronomical Data Analysis Software and Systems IV, ed. R. A. Shaw, H. E. Payne, & J. J. E. Hayes, 433
- Titarchuk (1994) Titarchuk, L. 1994, ApJ, 434, 570, doi: 10.1086/174760
- Veledina et al. (2011) Veledina, A., Vurm, I., & Poutanen, J. 2011, MNRAS, 414, 3330, doi: 10.1111/j.1365-2966.2011.18635.x
- Willmer et al. (1991) Willmer, C. N. A., Focardi, P., Chan, R., Pellegrini, P. S., & da Costa, N. L. 1991, AJ, 101, 57, doi: 10.1086/115665
- Yamada et al. (2013) Yamada, S., Makishima, K., Done, C., et al. 2013, PASJ, 65, 80, doi: 10.1093/pasj/65.4.80
- Yuan & Narayan (2014) Yuan, F., & Narayan, R. 2014, ARA&A, 52, 529, doi: 10.1146/annurev-astro-082812-141003
- Zdziarski et al. (1994) Zdziarski, A. A., Fabian, A. C., Nandra, K., et al. 1994, MNRAS, 269, L55, doi: 10.1093/mnras/269.1.L55
- Zdziarski et al. (1996) Zdziarski, A. A., Gierlinski, M., Gondek, D., & Magdziarz, P. 1996, A&As, 120, 553