Molecular layers in thin supported films exhibit the same scaling as the bulk between slow relaxation and vibrational dynamics
Abstract
We perform molecular-dynamics simulations of a supported molecular thin film. By varying thickness and temperature, we observe anisotropic mobility as well as strong gradients of both the vibrational motion and the structural relaxation through film layers with monomer-size thickness. We show that the gradients of the fast and the slow dynamics across the layers (except the adherent layer to the substrate) comply, without any adjustment, with the same scaling between the structural relaxation time and the Debye–Waller factor originally observed in the bulk [Larini et al., Nat. Phys., 2008, 4, 42]. The scaling is not observed if the average dynamics of the film is inspected. Our results suggest that the solidification process of each layer may be tracked by knowing solely the vibrational properties of the layer and the bulk.
I Introduction
Ultra-thin organic soft films made by small molecular weight or polymeric units are involved in tissue engineering Liu and Ma (2004), mechanically flexible electronics Peumans et al. (2003), memories Yang et al. (2006) and displays Howard (2004). Mechanical flexibility, scalability to the nanoscale and processability are some of their most appealing features. In supported thin films the mobility is slowed down close to the solid substrate Schneider et al. (1996); Napolitano and Wübbenhorst (2011); Yelash et al. (2012) and enhanced at the free interface Yang et al. (2010); Forrest and Dalnoki-Veress (2014) with considerable distribution of the solidification temperature, i.e. the glass transition (GT) temperature Ellison and Torkelson (2003). The differences between soft thin films and their bulk counterpart are widely reported by dedicated topical reviews Roth and Dutcher (2005); Forrest and Dalnoki-Veress (2001); Baschnagel and Varnik (2005); Jones (1999); Alcoutlabi and McKenna (2005); Napolitano et al. (2017).
Molecular reorganization deals with long-time transport properties. Yet, several experimental and numerical studies in bulk evidenced universal correlations between the long-time structural relaxation and the fast (picosecond) dynamics as sensed by the Debye-Waller (DW) factor , the rattling amplitude of the particle within the cage of the first neighbours Hall and Wolynes (1987); Larini et al. (2008); Ottochian et al. (2009); Puosi and Leporini (2011); Ottochian and Leporini (2011, 2011); De Michele et al. (2011); Puosi and Leporini (2012); Simmons et al. (2012); Puosi et al. (2013); Ottochian et al. (2013); Novikov and Sokolov (2013); Puosi et al. (2016); Guillaud et al. (2017); Horstmann and Vogel (2017); Puosi and Leporini (2018). In particular, correlations are found in polymers Larini et al. (2008); Ottochian et al. (2009); Puosi and Leporini (2011, 2018), binary atomic mixtures Ottochian et al. (2009); Puosi et al. (2013), colloidal gels De Michele et al. (2011), antiplasticized polymers Simmons et al. (2012), water Novikov and Sokolov (2013) and water-like models Guillaud et al. (2017); Horstmann and Vogel (2017).
The extension of the correlation between the vibrational dynamics and the slow relaxation observed in bulk to thin films Pazmiño Betancourt et al. (2015) - also in connection to the strictly related theme of the changes of Lang et al. (2014) - has been investigated by numerical studies considering the average dynamics of the film. Nonetheless, owing to the strong gradients of mobility and relaxation Ellison and Torkelson (2003), high-resolution studies are needed and it has been noted Hanakata et al. (2012) that, since the spatial variation of relaxation is difficult to access experimentally, the Debye-Waller factor may be an effective measure for probing spatial variations of relaxation through the film.
Motivated by the previous remarks we carried out a thorough campaign of molecular dynamics (MD) simulations of a supported molecular thin film. Here, we show that, with the exception of the layer of monomers adhering to the substrate Schneider et al. (1996); Napolitano and Wübbenhorst (2011); Yelash et al. (2012), the gradients of the DW factor and the structural relaxation time across film layers with monomer-size thickness correlate strongly and exhibit the same master curve observed in bulk with no adjustable parameter Larini et al. (2008).
II Simulation Methods
We model molecules as unentangled linear chains of beads linked by harmonic springs. The substrate supporting the polymer film is modeled as a collection of substrate atoms and coupled to the chains. The film is under vacuum, i.e. no pressure is exerted. Each linear chain has monomers. Non-bonded monomers belonging to the same or different chains interact with a truncated Lennard-Jones (LJ) potential:
| (1) |
is the position of the potential minimum with depth . The value of the constant is chosen to ensure at . Bonded monomers interact with an harmonic potential with and . Henceforth, all quantities are expressed in terms of reduced Lennard-Jones units, i.e. , , with unit monomer mass and Boltzmann constant. The reduced units can be mapped onto physical units relevant to generic non-equilibrium fluids, by taking MD time, length and energy units as corresponding roughly to about ps, nanometer and kJ/mol , respectively Kröger (2004).
To model the substrate, we tether each substrate atom to one site of a square lattice at spaced by with harmonic potential where and denotes the distance between the substrate atom and the tied site of the lattice. Substrate atoms are not mutually interacting, whereas they are coupled to the polymer monomers with the same LJ potential of the non-bonded monomers. Molecular-dynamics (MD) numerical simulations were carried out with the LAMMPS code (http://lammps.sandia.gov) Plimpton (1995). The two transversal dimensions of the film are considered as infinite and periodic boundary conditions are applied. We simulated samples with different temperatures (0.47, 0.48, 0.49, 0.5) and number of total monomers N = 2001, 3000, 3999 corresponding to different film thicknesses of about 5, 7.5 e 10 according to the criterion of ref. Hanakata et al. (2015). Additionally, we simulate a bulk system with M = 3 and N = 3999 at zero pressure for the purpose of comparison. All the systems where initially equilibrated in the ensemble (constant number of particles, pressure and temperature) with to allow full correlation loss of the end-end vector of the polymer chains (). Production runs were carried out in the ensemble (constant number of particles, volume and energy). Up to sixty-four independent replicas of each state were considered to ensure suitable statistical average.
III Results and Discussion
We present and discuss results concerning the simulation of the microscopic dynamics of a thin molecular film supported by a solid substrate.
III.1 Spatial variation of the density
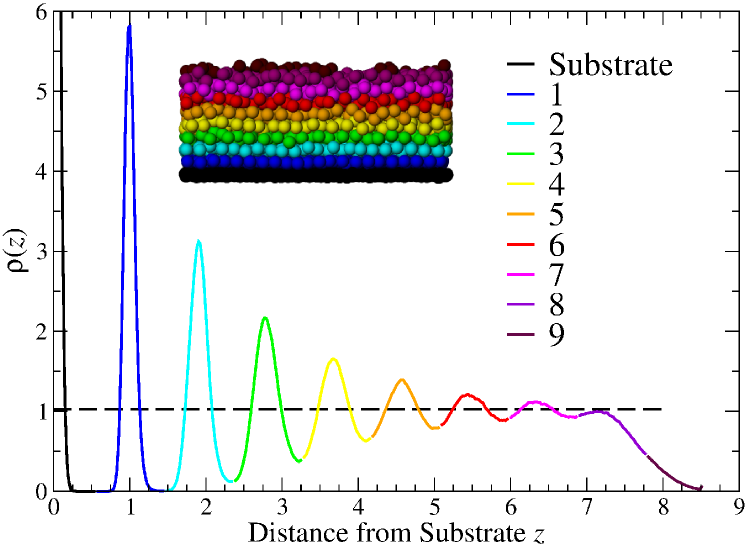
Fig.1 shows the density of the molecular film with thickness and temperature at a distance from the substrate (thickness measured according to ref. Hanakata et al. (2015)). It is apparent that the presence of the latter favours the organisation of the particles in well-defined layers with width comparable to the monomer size, about . This is a marked difference with respect to the corresponding bulk system where density is homogeneous. To analyse the behaviour of each layer, we partition the particles of the film in subsets. Each subset corresponds to a single layer with width . More precisely, having located the density maximum of the substrate at , the i-th particle with distance from the substrate belongs to the m-th layer if . The result of the partition is shown in Fig.1 in terms of a suitable color code.
III.2 Spatial variation of mobility and relaxation
The spatial distribution of the particle packing across the film leads to a corresponding spatial distribution of both the mobility and the relaxation. The matter is discussed in this Section.
III.2.1 Mobility
First, we investigate the mobility of the particles initially located in the m-th layer. To this aim, we define their mean square displacement (MSDm):
| (2) |
is the position of the j-th particle at time . The latter was at the initial time one of the particles of the m-th layer. denotes the average over the system replicas to improve the statistical precision.
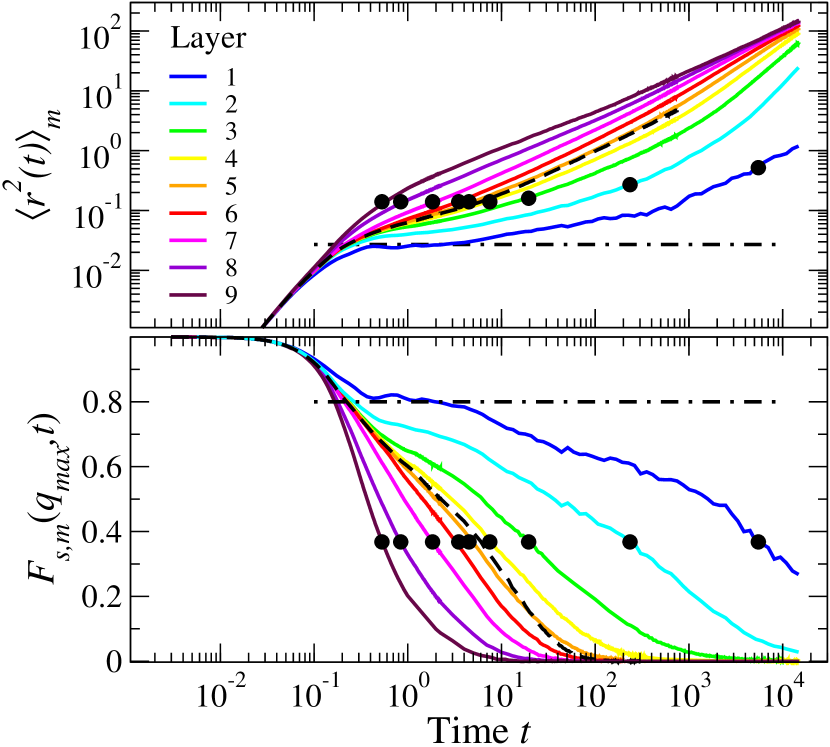
Representative results concerning the MSDm of all the layers of the film with density profile plotted in Fig.1 are shown in Fig.2 (top panel). To appreciate the huge spread due to the film confinement, the mobility of the equivalent bulk system is superimposed. Going into details, one sees that for very short times, , the MSDm increase is independent of the layer since the particle displacement is ballistic, i.e. . Later, MSDm increases less due to two distinct effects: i) the trapping due to the cage of the surrounding particles, and ii) the absorption-desorption process of the particles close to the substrate. While the cage effect slows down all the particles, the absorption-desorption process is felt, via the molecular connectivity, only at short distance from the substrate where it lowers the mobility. We remind that the substrate is solid, i.e. its particles perform small-amplitude random oscillations around their average positions so that after the ballistic regime their MSD reaches a plateau with no further increase. Fig.2 (top panel) shows a multiple transient arrest in the closest layer to the substrate which, for conciseness reasons, will be denoted henceforth as the ”adherent layer”. The multiple transient arrest of the particles of the adherent layer is evidenced by a first plateau with MSD coinciding with the substrate one in the time window , followed by a mild increase, and a later plateau in the time window . That scenario have been already observed at polymer-solid interfaces with attractive interactions Yelash et al. (2012); Zhang et al. (2018). The first plateau signals the arrest due to the adsorption, whereas the second one pertains to desorbed particles awaiting for the escape from the cage of the neighbours. At later times, the escape is seen in all the layers. Early escape events yield a change of the concavity of the time dependence of MSDm and the presence of an inflection point at . By performing the same analysis as in ref. Larini et al. (2008) one finds as in bulk systems. MSDm at is interpreted as a mean localization length and we define the DW factor of the m-th layer as . For more details, see Ref. Larini et al. (2008). For times fairly longer than the mobilities of the particles belonging initially to different layers tend to equalise. This is due to the fact that at long times particles move from one layer to the other ones leading to an averaged mobility across the film.
III.2.2 Structural relaxation
The structural relaxation following the escape process of one particle initially belonging to the m-th layer from the cage of the first neighbouring particles is conveniently described by the self part of the intermediate scattering function (ISFm) Hansen and McDonald (2006):
| (3) |
ISFm is evaluated at the wavevector with being the q-vector of the maximum of the static structure factor corresponding to about the distance of nearest-neighbours. By construction, ISFm is negligibly small when the particle displacement exceeds a few particle diameters. Fig.2 (bottom panel) plots ISFm of the film with density profile plotted in Fig.1. It is seen that the ISFm decay is identical in the different layers in the short-time ballistic regime. Later, the decay is slowed down in a way depending on the layer and paralleling the progress of mobility shown in Fig.2 (top panel). In particular, the adherent layer exhibits a temporary arrest of the relaxation at the same height of the substrate in the time window followed by a second plateau in the time window and a further decay in agreement with previous studies Yelash et al. (2012); Zhang et al. (2018).
III.2.3 The layer structural relaxation time
We are interested in the definition of the characteristic structural relaxation time of the m-th layer, . A convenient definition has to ensure that within particle rearrangements relax effectively the cage structure with displacements along the z direction not exceeding the half-layer thickness. Fulfilling these requirements is not obvious since the molecular film is partitioned in layers as thin as about one particle diameter. Nonetheless, we remind the well- known result that the atomic MSD during the structural relaxation is less than one atomic radius Angell (1991). We find that a proper definition of is the familiar one defined by the equation . To motivate this choice, we define the distribution function:
| (4) |
where and are the Dirac delta and the elevation of the j-th particle from the substrate at time , respectively. At the initial time the j-th particle is one of the particles of the m-th layer. The quantity is the probability that the particle initially in the m-th layer changes the initial distance from the substrate between and after a time . We are interested in the distribution of the modulus of ,
| (5) |
which is normalised in the positive semiaxes .
The top panel of Fig.3 shows the distribution of all the layers of the film with thickness at . It is seen that the elevation change in a time is comparable to or less than the particle radius, i.e. the half-layer thickness. Identical conclusions are reached by considering the layers of all the films at the different temperatures examined in the present paper. This provides evidence that is a characteristic relaxation time of the m-th layer. Alternative choices for leading to longer time scales are anticipated to be affected by particle exchange between nearby layers so that we think that is a convenient definition of the relaxation time of the m-th layer.
III.2.4 Anisotropy of the particle displacement in a time
The particle displacement in the film is anisotropic in a time . To show that, we consider the self part of the van Hove function restricted to particles which belong to the m-th layer at the initial time:
| (6) |
where is the position of the j-th particle at time , respectively. At the initial time the j-th particle is one of the particles of the m-th layer. We average the distribution over a spherical shell of radius and thickness to get the spherical van Hove distribution . The interpretation of is direct. The product is the probability that the particle, initially in the m-th layer, is at a distance between and from the initial position after a time t.
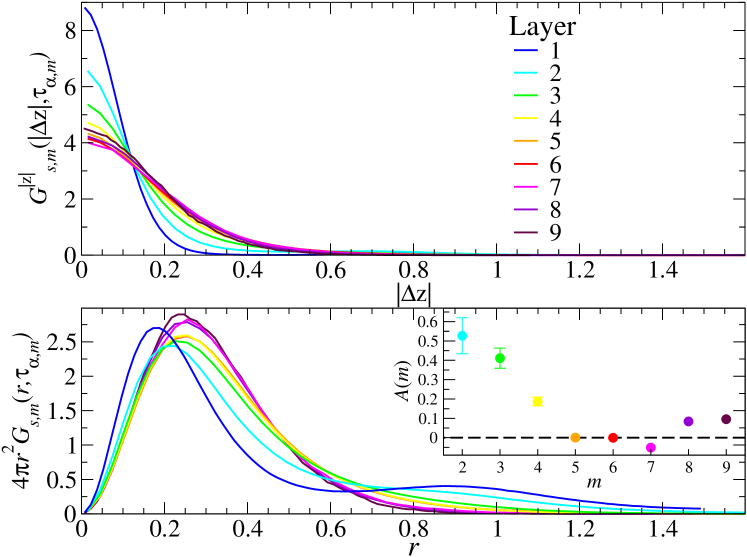
The bottom panel of Fig.3 shows the van Hove distribution of a particle initially located in the m-th layer of the film with thickness at . By comparison with the top panel of Fig.3, it is seen that in a time the distance between the initial and the final positions is larger than the change of distance from the substrate which is of the order of the particle radius, i.e. the half-layer thickness. In particular, the self part of the van Hove function shows that the particles closer to the substrate undergo solid-like large jumps of the order of the particle size, well seen in the peak at which is, instead, virtually missing in the elevation distribution distribution , Fig.3 (top panel). That findings suggest that the particle motion is anisotropic with larger intra-layer displacements with respect to the interlayer ones. The feature is also apparent in the MSD evaluated at , see Fig.2 (top panel), which increases for layers closer to the substrate whereas the corresponding interlayer displacements decrease, see Fig.3 (top panel). This suggests that, at least in some layers, the structural relaxation of the layer in a time is facilitated by quasi-bidimensional intra-layer displacements.
To better scrutinize the anisotropy motion we define the anisotropy function of the m-th layer as:
| (7) |
where is the second moment of the distribution of Eq.4 at . The function is small if the displacement is isotropic and positive if the intra-layer mobility exceeds the inter-layer mobility. The inset in the bottom panel of Fig.3 shows that the anisotropy is meaningful close to the substrate, absent in the central region of the film and weak close to the free surface. The finding is ascribed to the presence of increasing dimensional constraints far from the inner part of the film. We anticipate stronger bi-dimensional character of the motion close to the solid substrate than to the free interface which has more diffuse character along the direction, see Fig.1.
III.3 Scaling between slow relaxation and vibrational dynamics
In bulk systems pioneering studies Hall and Wolynes (1987) and later investigations involving MD simulations and extended comparison with the experiment Larini et al. (2008); Puosi et al. (2013, 2016) revealed the strong correlation between the fast vibrational dynamics, characterized by the DW factor , and the structural relaxation time. The dynamics was varied by changing several parameters like, e.g., temperature, pressure, inter- and intra-molecular potential and polymer size in one- or two- components systems. Notice that, here, the dynamics is changed by resorting to completely different variables, e.g. the film thickness and the position of the layer, in addition to the temperature. The correlation between structural relaxation and fast mobility is summarized by the master curve Larini et al. (2008):
| (8) | |||||
| (9) |
is the fast mobility at GT, and are suitable universal constants independent of the kinetic fragility Larini et al. (2008); Puosi et al. (2013), and to comply with the usual definition s at the glass transition. For the present molecular model in bulk systems Eq.9 reduces to Larini et al. (2008):
| (10) |
with .
Douglas and coworkers developed a localization model predicting the alternative master curve relating the structural relaxation time and the fast mobility Simmons et al. (2012); Pazmiño Betancourt et al. (2015). Both the latter form and Eq.9 account for the convexity of the master curve, evidenced by experiments and simulations, and improve the relation originally proposed by Hall and Wolynes Hall and Wolynes (1987).
Our claim in the present work is that the scaling form given by Eq.10, originally found in bulk systems, also works as a master curve of the relaxation time and DW factor of the m-th layer, i.e. we anticipate
| (11) |
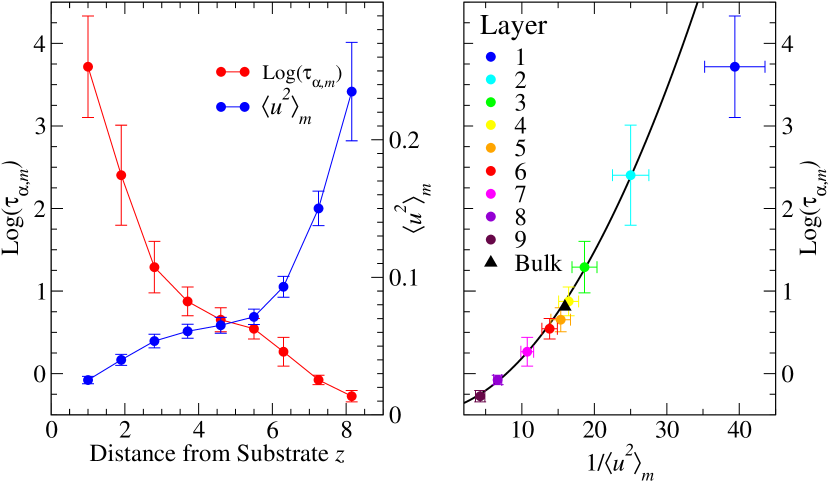
where and are the same of bulk systems. To start with, the left panel of Fig. 4 shows the distribution of both the relaxation time and the DW factor across the molecular film with thickness at . The relaxation is faster, and the DW is larger, on approaching the film interface at large values. The distribution of the relaxation times extends over about four orders of magnitude. Three regions are seen: a less mobile region close to the substrate - the so called ”bound layer” Zhang et al. (2017, 2018) - , an intermediate bulk-like region, and a more mobile region close to the free interface.
The right panel of Fig. 4 is a correlation plot between the relaxation time and the inverse DW factor. The superimposed curve is Eq. 11, i.e. the master curve of bulk systems. As a consistency check, we show that the pair (, ) of the corresponding bulk molecular liquid at same pressure and temperature fulfills the scaling. It is seen that the corresponding pairs of all the layers, but the single adherent layer, do the same. The scaling holds even for the superficial layer at the free surface of the film, which has a particularly complex dynamics Roth and Dutcher (2005); Forrest and Dalnoki-Veress (2001); Baschnagel and Varnik (2005); Jones (1999); Alcoutlabi and McKenna (2005); Napolitano et al. (2017). The result is noticeable and suggests that, aside from the adherent layer, the relaxation and the vibrational dynamics of the other layers of the thin film correlate as in the bulk.
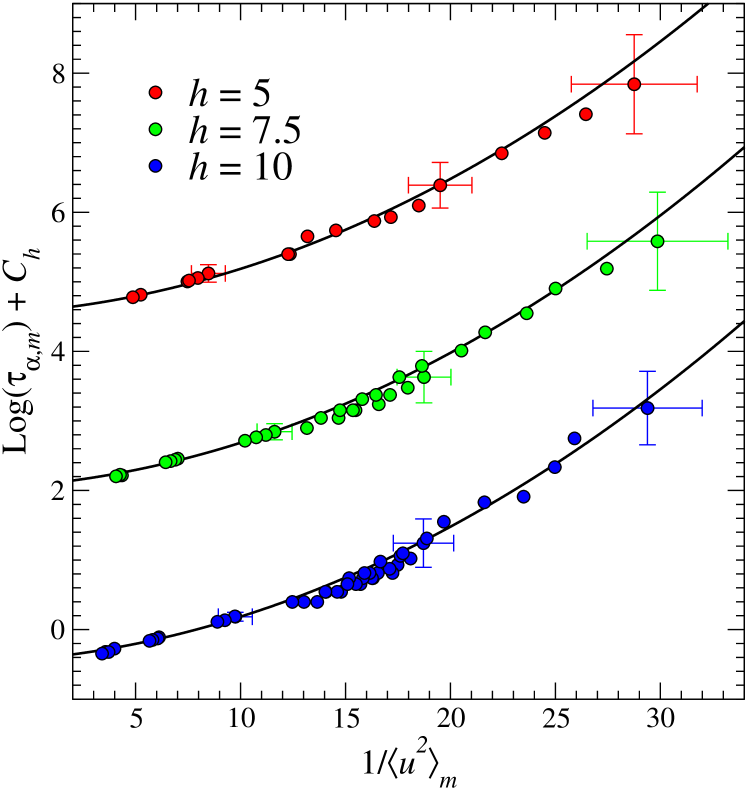
To provide a sound basis to the previous result we have investigated films with different thickness and temperature. The results are summarized in Fig. 5 for all the layers but the adherent layer. We stress that the MD results are compared to Eq. 11 with no adjustement. We see that structural relaxation and vibrational dynamics of the layers exhibit the same scaling of the bulk system.
The results of Fig. 5 suggest that, apart from the adherent layer, layers with equal DW factor exhibit equal relaxation time , as stated by Eq.11. Having defined GT as occurring at a temperature where the relaxation time has a conventional well-defined value, a sharp relation between the DW factors of the m-th layer of the film evaluated at the corresponding GT temperature and the corresponding quantities of the bulk system, and , is predicted
| (12) |
More generally, the results of Fig. 5 and the relation between the pair of parameters and Larini et al. (2008), suggest that Eq.11 may be recast in the universal form
| (13) |
Eq.13 is the analogous of Eq. 9 for thin films. It allows to monitor the solidification of the m-th layer of the film by using solely information concerning the vibrational properties of the layer and the bulk.
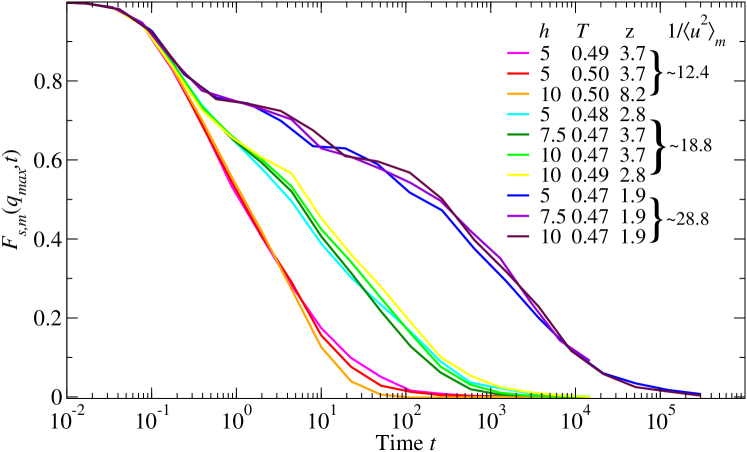
For bulk systems it was shown that particle ensembles with equal DW factor have identical ISF up to the structural relaxation time Larini et al. (2008); Ottochian et al. (2009); Puosi and Leporini (2011). This a stronger conclusion than the mere scaling between DW and the relaxation time. In an attempt to see if that conclusion may be duly extended to thin films, we wondered if layers with equal DW factor have identical ISFm up to , irrespective of the film thickness, temperature, and layer position. Fig.6 provides a positive answer in three different mobility regimes.
Only the adherent layer fails to comply with the scaling between vibrational dynamics and structural relaxation. This is explained by the fact that, broadly speaking, the scaling correlates the local stiffness of the cage, as expressed by the inverse of DW, with the escape rate of the particle trapped in it Larini et al. (2008). However, very close to the substrate, the local stiffness is hardened by the absorption process which superimpose to the one due to the cage effect, resulting in a weaker correlation. The effect is negligible farther from the substrate. The presence of an adherent layer is reported by both experiments Schneider et al. (1996); Napolitano and Wübbenhorst (2011) and simulations Yelash et al. (2012). It is a limited part of the so- called ”bound” layer having much lower mobility than the film interior and observed near an attractive substrate in a region with thickness Zhang et al. (2017, 2018). Referring to Fig.4 (left), we may estimate as the position of the inflection point limiting the slowed-down region close to the substrate. This yields . This estimate is very close to derived in Ref.Zhang et al. (2018) for the same thickness by using a very similar model to ours.
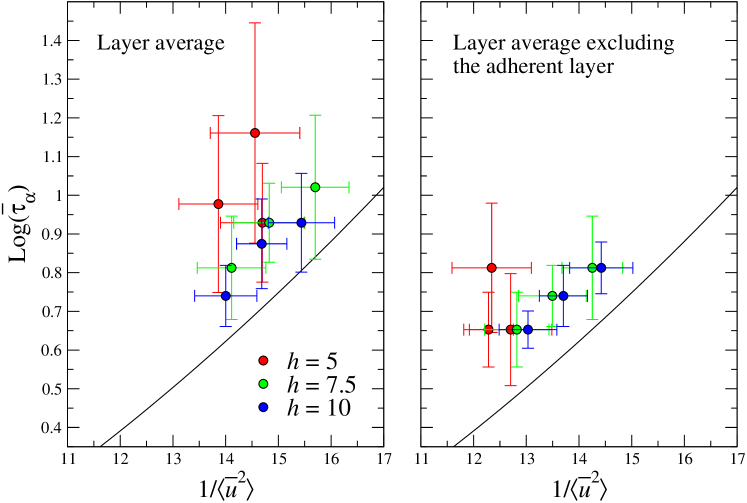
Previous studies considered the average fast and vibrational dynamics of the whole film Pazmiño Betancourt et al. (2015); Lang et al. (2014). We show that the scaling tends to be hidden if the dynamics is averaged over the whole film, including or not the adherent layer. To this aim, we first average the self part of the intermediate scattering function over the particles of interest and consider the time when the resulting curve drops at 1/e. Then, we perform the average over the same particles to draw the average DW factor . Fig.7 shows that the scaling of the relaxation time and DW factor is missing if averaged over both all the layers (left panel) and all the layers but the adherent one (right panel) of a film. Note that there are appreciable deviations from Eq.11 which increase by decreasing the thickness if the average includes all the layers. Anyway, the deviations, even if appreciable, are not large. This offers an explanation of why the scaling is recovered by small adjustment of a single parameter Pazmiño Betancourt et al. (2015).
IV Conclusions
We studied by MD simulations a class of supported thin films with attractive substrate interaction and different thickness and temperature. The films are analysed by partitioning them into layers as thin as one particle size with the purpose of investigating the observed anisotropic mobility and the strong gradients of both the fast and the slow dynamics. We define a characteristic structural relaxation time of the layer and prove that, aside from the single layer adherent to the substrate, it exhibits strong correlation with the fast vibrational dynamics of the layer, as accounted for by the DW factor of the particles. We find that the correlation is the same of bulk in the sense that it is described by the same master curve with no adjustable parameters. Our results suggest that the solidification process of each layer may be tracked by knowing solely the vibrational properties of the layer and the bulk. The scaling is hidden if the average dynamics of the film is inspected.
Acknowledgements
Francesco Puosi and Antonio Tripodo are thanked for helpful discussions. We acknowledge the support from the project PRA-2018-34 (”ANISE”) from the University of Pisa. A generous grant of computing time from IT Center, University of Pisa and Dell EMC® Italia is also gratefully acknowledged.
References
- Liu and Ma (2004) X. Liu and P. X. Ma, Annals of Biomedical Engineering, 2004, 32, 477–486.
- Peumans et al. (2003) P. Peumans, A. Yakimov and S. R. Forrest, Journal of Applied Physics, 2003, 93, 3693–3723.
- Yang et al. (2006) Y. Yang, J. Ouyang, L. Ma, R. J. H. Tseng and C. Chu, Advanced Functional Materials, 2006, 16, 1001–1014.
- Howard (2004) W. Howard, Scientific American, 2004, 290, 76–81.
- Schneider et al. (1996) H. M. Schneider, P. Frantz and S. Granick, Langmuir, 1996, 12, 994–996.
- Napolitano and Wübbenhorst (2011) S. Napolitano and M. Wübbenhorst, Nature Communications, 2011, 2, 260.
- Yelash et al. (2012) L. Yelash, P. Virnau, K. Binder and W. Paul, Europhys. Lett., 2012, 98, 28006.
- Yang et al. (2010) Z. Yang, Y. Fujii, F. K. Lee, C.-H. Lam and O. K. C. Tsui, Science, 2010, 328, 1676–1679.
- Forrest and Dalnoki-Veress (2014) J. A. Forrest and K. Dalnoki-Veress, ACS Macro Letters, 2014, 3, 310–314.
- Ellison and Torkelson (2003) C. J. Ellison and J. M. Torkelson, Nature Materials, 2003, 2, 695–700.
- Roth and Dutcher (2005) C. B. Roth and J. R. Dutcher, in Mobility on Different Length scales in thin polymer films, ed. J. R. Dutcher and A. G. Marangoni, Marcel Dekker, New York, 2005, ch. 1, pp. 1–38.
- Forrest and Dalnoki-Veress (2001) J. A. Forrest and K. Dalnoki-Veress, Curr. Opin. Colloid Interface Sci., 2001, 94, 167–195.
- Baschnagel and Varnik (2005) J. Baschnagel and F. Varnik, J. Phys.: Condens. Matter, 2005, 17, R851–R953.
- Jones (1999) R. A. Jones, Curr. Opin. Colloid Interface Sci., 1999, 4, 153–158.
- Alcoutlabi and McKenna (2005) M. Alcoutlabi and G. B. McKenna, J. Phys.: Condens. Matter, 2005, 17, R461–R524.
- Napolitano et al. (2017) S. Napolitano, E. Glynos and N. Tito, Rep. Prog. Phys., 2017, 80, 036602.
- Hall and Wolynes (1987) R. W. Hall and P. G. Wolynes, J. Chem. Phys., 1987, 86, 2943–2948.
- Larini et al. (2008) L. Larini, A. Ottochian, C. De Michele and D. Leporini, Nature Physics, 2008, 4, 42–45.
- Ottochian et al. (2009) A. Ottochian, C. De Michele and D. Leporini, J. Chem. Phys., 2009, 131, 224517.
- Puosi and Leporini (2011) F. Puosi and D. Leporini, J.Phys. Chem. B, 2011, 115, 14046–14051.
- Ottochian and Leporini (2011) A. Ottochian and D. Leporini, Philosophical Magazine, 2011, 91, 1786–1795.
- Ottochian and Leporini (2011) A. Ottochian and D. Leporini, J. Non-Cryst. Solids, 2011, 357, 298–301.
- De Michele et al. (2011) C. De Michele, E. Del Gado and D. Leporini, Soft Matter, 2011, 7, 4025–4031.
- Puosi and Leporini (2012) F. Puosi and D. Leporini, J. Chem. Phys., 2012, 136, 211101.
- Simmons et al. (2012) D. S. Simmons, M. T. Cicerone, Q. Zhong, M. Tyagic and J. F. Douglas, Soft Matter, 2012, 8, 11455–11461.
- Puosi et al. (2013) F. Puosi, C. D. Michele and D. Leporini, J. Chem. Phys., 2013, 138, 12A532.
- Ottochian et al. (2013) A. Ottochian, F. Puosi, C. D. Michele and D. Leporini, Soft Matter, 2013, 9, 7890–7891.
- Novikov and Sokolov (2013) V. N. Novikov and A. P. Sokolov, Phys. Rev. Lett., 2013, 110, 065701.
- Puosi et al. (2016) F. Puosi, O. Chulkin, S. Bernini, S. Capaccioli and D. Leporini, J. Chem. Phys., 2016, 145, 234904.
- Guillaud et al. (2017) E. Guillaud, L. Joly, D. de Ligny and S. Merabia, The Journal of Chemical Physics, 2017, 147, 014504.
- Horstmann and Vogel (2017) R. Horstmann and M. Vogel, The Journal of Chemical Physics, 2017, 147, 034505.
- Puosi and Leporini (2018) F. Puosi and D. Leporini, J. Chem. Phys., 2018, 148, 131102.
- Pazmiño Betancourt et al. (2015) B. A. Pazmiño Betancourt, P. Z. Hanakata, F. W. Starr and J. F. Douglas, Proc. Natl. Acad. Sci. USA, 2015, 112, 2966–2971.
- Lang et al. (2014) R. J. Lang, W. L. Merling and D. S. Simmons, ACS Macro Letters, 2014, 3, 758–762.
- Hanakata et al. (2012) P. Z. Hanakata, J. F. Douglas and F. W. Starr, J. Chem. Phys., 2012, 137, 244901.
- Kröger (2004) M. Kröger, Phys. Rep., 2004, 390, 453–551.
- Plimpton (1995) S. Plimpton, J. Comput. Phys., 1995, 117, 1–19.
- Hanakata et al. (2015) P. Z. Hanakata, B. A. P. Betancourt, J. F. Douglas and F. W. Starr, J. Chem. Phys., 2015, 142, 234907.
- Zhang et al. (2018) W. Zhang, J. F. Douglas and F. W. Starr, Proceedings of the National Academy of Sciences, 2018, 115, 5641–5646.
- Hansen and McDonald (2006) J. P. Hansen and I. R. McDonald, Theory of Simple Liquids, 3rd Ed., Academic Press, 2006.
- Angell (1991) C. Angell, J.Non-Crystalline Sol., 1991, 131-133, 13–31.
- Zhang et al. (2017) W. Zhang, J. F. Douglas and F. W. Starr, The Journal of Chemical Physics, 2017, 147, 044901.