Multimodal Polynomial Fusion for Detecting Driver Distraction
Abstract
Distracted driving is deadly, claiming 3,477 lives in the U.S. in 2015 alone. Although there has been a considerable amount of research on modeling the distracted behavior of drivers under various conditions, accurate automatic detection using multiple modalities and especially the contribution of using the speech modality to improve accuracy has received little attention. This paper introduces a new multimodal dataset for distracted driving behavior and discusses automatic distraction detection using features from three modalities: facial expression, speech and car signals. Detailed multimodal feature analysis shows that adding more modalities monotonically increases the predictive accuracy of the model. Finally, a simple and effective multimodal fusion technique using a polynomial fusion layer shows superior distraction detection results compared to the baseline SVM and neural network models.
Index Terms: multimodal interaction, speech processing, spoken dialog systems
1 Introduction
In 2015, 3477 deaths in car crashes in the U.S. were attributed to distracted driving [1]. The use of electronic devices, particularly cellphones, while driving is one of the most common causes. Vehicle and cellphone manufacturers designed speech interfaces (such as Siri) that were supposed to reduce potential distraction by eliminating the need to look at a screen. However, studies show that hands-free voice technologies are still highly distracting [2]. While legislation in many states bans the use of cellphones while driving, many individuals continue to speak and text while driving. Since this practice continues, another strategy must be adopted: warning the driver when a dangerous situation arises while she is distracted.
Automatic distraction detection can enable in-car systems or virtual personal assistants to choose the right time to warn the driver, giving out safety information, or shut down some app in a dangerous situation. Early attempts to do this had high false alarm rates [3]. False alarms cause drivers to ignore or disable the system. This lack of robustness is often linked to the paucity of information, that is, the use of only one or two modalities for detection, often just facial expressions. Detecting driver distraction is complex. A variety of modalities come into play, all of which should be used to detect distraction. In addition to facial expression, there is the driver’s speech while talking to a passenger, instructing an intelligent agent or talking on the phone. Information coming from the vehicle itself (CAN bus) such as knowing when the driver is braking is also important. Interaction across modalities is important. For example, a system based on eye-gaze alone fails if the driver is wearing sunglasses. Recent advances in multimodal deep learning afford better performance thanks to both improved facial feature detection and the ability to learn a joint representation from multiple modalities via multimodal fusion [4]. There are two advantages of multimodal deep learning over traditional unimodal approaches: 1) better accuracy, and 2) more robust detection.
We have developed a novel deep multimodal polynomial fusion (MPF) architecture to robustly detect distraction. Specifically, we used a polynomial function to map features from different modalities to a weighted sum of the intermodal product interactions as the fused representation for distraction detection. We also introduce a new training and assessment dataset.
The contribution of this paper is three-fold:
-
•
A database of distracted driving behavior containing distraction events.
-
•
Empirical evidence that incorporating multiple modalities improves distraction detection.
-
•
A simple and effective multimodal fusion technique that outperforms baseline models.
2 Related Work
This section describes existing distraction detection approaches for each modality, and then describes previous work which explored multiple modalities. We also present related datasets.
Visual - Facial expression
Previous work focused on facial cues such as facial landmarks, head pose turns, glances, eye-gaze tracking, and facial action units [5, 6, 7, 8, 9, 10]. While good detection accuracy was achieved without the use of other modalities, these approaches lack robustness in cases where either some part of the face is obscured or the lighting changes dramatically [7]. Data from additional modalities can compensate for the missing information.
Visual - Road conditions
Researchers used a forward-facing camera and computer vision algorithms [11, 12, 13, 14]. Scene understanding is used along with information from a backward-facing camera (driver’s glances) to categorize driving behavior [13, 14]. This bi-modal approach can detect what the driver is attending to on the road ahead [15]. Lane position changes can be captured by the forward-facing camera [11, 14].
Acoustics - Speech
The driver’s speech has been used by [16, 17, 18]. There are voice interfaces installed in the vehicle, such as a spoken dialog system or personal assistant [16, 15]. The driver’s speech is analyzed to derive features such as voice activity detection and strings of words via automatic speech recognition [18].
Driving measures
Combinations of modalities
There have been attempts to use multimodal fusion for distraction detection [16, 15, 18, 13, 19]. These used early fusion techniques that concatenate multimodal features into a single feature vector. For example, [19] uses modalities similar to those used in this paper. They used data from front and rear-facing cameras to extract road and facial features, audio from a microphone to extract the energy of speech, and CAN-bus information. They performed early feature fusion, trained machine learning models for binary classification of distraction, and showed promising results. This did not, however, model the intermodal interaction amongst features [20]. We compare our MPF model to their best binary classification model, SVM, below.
Other information
A few studies have used body position from a Kinect camera [21]. This indicates whether the driver’s both hands are on the steering wheel. Physiological signals such as an electroencephalogram (EEG) have also been studied [10]. Both approaches require additional equipment not commonly found on vehicles (often due to cost). Due to the limited amount of existing data and the fact that these signals are noisy, they are less interesting for distraction detection.
Datasets
One of the most well-studied distraction detection datasets is UTDrive [16]. Collected in the 2000s, it is naturalistic and multimodal, and has a speech interface. Beside the limited sensor capabilities existing at the time the data was recorded, the dataset does not have: 1) extensive dialog interaction (i.e. phone usage), and 2) sufficient amounts of data. Taamneh et al. [22] released a multimodal distracted driving dataset which is large enough for our needs, but does not include recorded speech. To investigate distraction detection using multimodal deep learning, we need a dataset that has speech and more instances of distraction.
3 Multimodal Distraction Dataset
We designed a dataset that can capture more instances and nuances of distraction (we have datapoints at frame-level in the training set and of them correspond to places where the driver was distracted). Specifically, we wanted to create distracting instances that afford different degrees of cognitive load, due to the road conditions, the type of message to be dealt with and the coincidence of the two. We also wanted to represent several sources of messages: texts, phone calls and emails. We recorded as many different modalities as possible (forward camera, backward camera, microphone, car information). There were 30 subjects, 7 female and 23 male, each driving for about 15 minutes (minimum 9 minutes, maximum 21.36 minutes).
While driving, each subject had three types of interaction at different levels of cognitive load with the message agent on an Android phone. For example, low cognitive load is a combination of low-load email from Mom asking if the driver was feeling ok today while the subject was driving on a straightaway. High load is the combination of a friend asking the driver to list five things she wants for her upcoming birthday while she is entering a hairpin turn. Messages were sent as: text messages, phone calls, and email. The four modalities we captured were time synchronized. After driving, the subject was asked to watch the recording and annotate stretches of time (start and end point) when they felt they had been distracted.
Data collection system architecture
The simulated driving route was created using the OpenDS driving simulator [23]. Traffic signs, a traffic light, hairpin turns, and odd objects along the side of the road created situations that demanded attention. The simulator recorded and synchronized the driving data. A spoken dialog system was connected to a personal assistant that interacted with the driver to produce the predefined messages. The MultiSense recorder 111http://multicomp.cs.cmu.edu/ recorded and synchronized facial videos and speech from a backward-facing camera. Open Broadcaster screen capture software 222https://obsproject.com/, served as the forward-facing camera, capturing what the subject saw on the screen while driving. A wizard interface controlled all of the submodules and initiated tasks in the dialog system. Each type of signal was synchronized with timestamps and saved to the database.
The multimodal distraction detection dataset will be made publicly available after Interspeech publication of this paper.
4 Multimodal Polynomial Fusion
In this section, we present multimodal polynomial fusion (MPF) for learning fused representations for distraction detection.
Given feature vectors , , at each time frame (10Hz) from face, speech, and car modalities respectively, we want to learn a shared hidden representation that captures the interaction amongst these modalities to detect driver distraction at that time frame.
The cube activation function [24], where , is a simple way to learn such a shared representation from multiple feature vectors (, along with a bias term ) of the same dimension. It is a special configuration of Polynomial Networks [25, 26, 27, 28, 29]. Chen et al. [24] show that the product interactions of features captured by cube activation empirically lead to a better representation for dependency parsing. Intuitively, the cube activation function resembles a polynomial kernel that extracts 3-combinations with repetitions from , , …, , and :
| (1) |
where is the Hadamard product.
The multimodal polynomial fusion (MPF) layer is inspired by the cube activation function. First, the feature vectors from each modality are transformed so that all of them have the same dimension , so that an element-wise product (the Hadamard product) of features from different modalities can be performed:
| (2) |
where , , . Then , , and could be passed to a cube activation to model the intermodal interactions of the three: .
However, cube activation captures redundant combinations from duplicated feature modalities, although being computationally efficient. For example, is also an interaction term captured by cube activation, but it is not a reasonable representation to include in multimodal fusion, since modalities need not be repeatedly used in intermodal interaction. Such redundancy could increase complexity and lead to inferior predictive results.
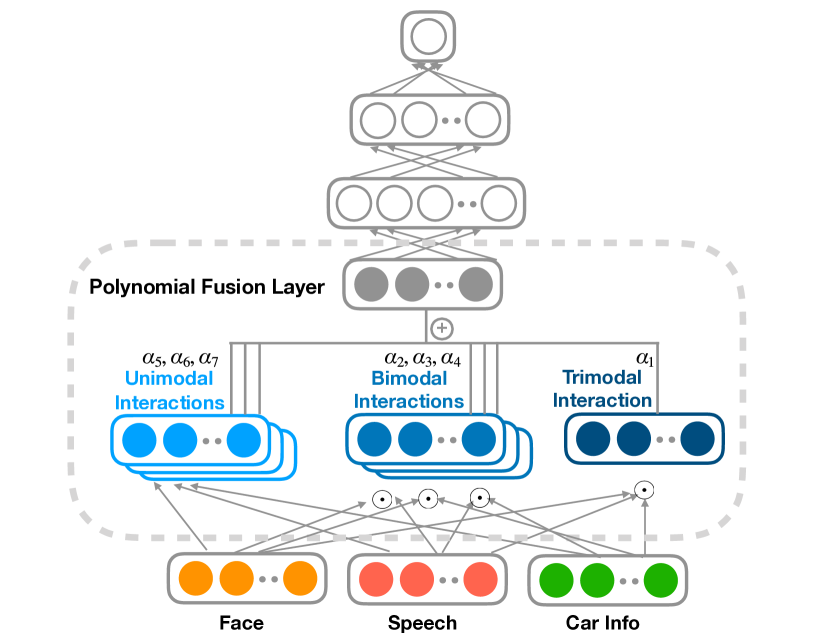
To alleviate this problem, the multimodal polynomial fusion (MPF) layer (Eq. 3) is designed to model by summing up selected weighted intermodal interaction amongst the three feature modalities. Each interaction is derived by an element-wise product of features. The proposed neural architecture is shown on Figure 1. The multimodal fusion representation is calculated using the following polynomial function:
| (3) |
where are learnable parameters adjusting the weight of each term, is the bias term, and is the element-wise multiplication of vectors. Thus, models trimodal interaction; , , and models bimodal interaction; , , and are the unimodal features. Essentially, is a weighted sum of the product interactions of the feature vectors from the three modalities.
The advantage of the polynomial fusion layer is that it explicitly specifies the desired combinations of modalities to model interaction and also learns the weights for all intermodal dynamics. The polynomial fusion layer can easily be extended to accommodate more modalities by adding more terms in the polynomial.
We then feed the fused hidden representation to a tanh activation:
| (4) |
The activation function is used because is unbounded and thus needs to be controlled by bounded non-linear activation [30]. Empirically, we found that did stabilize network training and led to better results than unbounded activations such as .
Finally, the hidden representation is fed to a two-layer feed forward neural network with dropouts and ReLU activations. The complete model is shown on Figure 1.
5 Experiments
We now describe the multimodal features, baseline models, experimental methodology, and results.
5.1 Multimodal Features
This paper focuses on three modalities: facial expression/movement, speech, and car information. Feature sets were extracted from the backward facing camera video and the speech signal.
Facial features
The OpenFace [31] toolkit is a state-of-the-art tool used for facial landmark detection, head pose estimation, facial action unit recognition, and eye-gaze estimation. The facial features we use include: a) Facial landmarks (FL): 68 points on the face (204 values). b) Gaze vectors: 3D vector and gaze angle for each eye (8 values), and 28 2D and 3D eye region landmarks for each eye (280 values). c) 18 Action Units (AU): regression and binary outputs of all the available AUs in [31] (36 values). d) Head pose: 3D translation and 3D rotation of head pose (6 numbers). Facial features are extracted at a frame rate of 30Hz.
Speech features
The OpenSMILE [32] toolkit is an audio feature extractor that extracts a knowledge-based feature set. The speech-related features include: a) Prosody: Pitch and loudness. b) Voice-Quality (VQ): jitter and shimmer, creaky voice. c) Frame Energy. d) Voice Activity Detection (VAD). e) F0 fundamental frequency. f) Syllables per second (SPS). The speech-related features are extracted with a moving window of 300ms and a shift of 100ms.
Car driving measures
The features from the car logged by the driving simulator are: a) Speed of the vehicle: a real number (in km/h). b) Steering wheel position: a continuous number from -1 to 1. c) Gas pedal position: a continuous number from 0 to 1. d) Break pedal position: a continuous number from 0 to 1.
All of the above features were synchronized with respect to the frame of audio features (10Hz). Distraction classification is performed here on a frame-wise basis.
Qualitative feature analysis
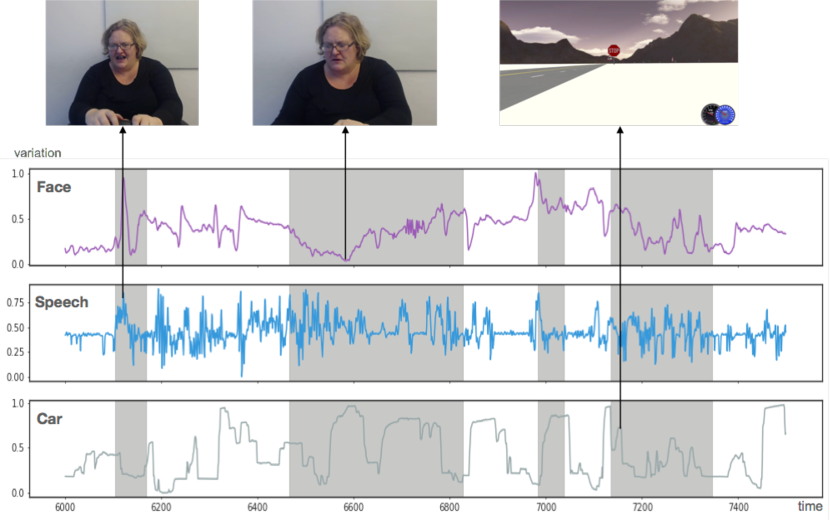
Feature value variation by dimensionality reduction for each of the three modalities over time is shown for one example in Figure 2. The grey area denotes the time period when the driver said she was distracted. Figure 2 shows that when the driver screamed, there was a peak in the speech features as well as a corresponding peak in the facial features, due to mouth opening. Similarly, when the driver turned her head to the side toward the phone, the facial features show a negative peak. There was also a significant change in car information showing the moment when the driver realized that she went off the road and tried to shift back onto it. This qualitative analysis shows that the feature peaks may correlate with and complement one another in indicating driver distraction (the grey area). Thus, distraction detection may benefit from modeling the intermodal interaction of the modalities.
5.2 Baseline Models
We compare our model (MPF) to seven baseline models and MPF variants: Majority is the trivial baseline predicting the majority label; SVM is the Support Vector Machine using early fusion multimodal features in [19] which achieves the best performance on binary classification of distraction; NN-Early is a two-layer feed forward neural network that takes the concatenation of features from three modalities; NN-Cube is the cube activation function for fusing features from three modalities described in [24]; NN-TC is the tanh-cube activation function for fusing features from three modalities described in [30]; MPF-1 and MPF-2, which are variants of our full MPF model, use one modality and two modalities as input respectively. To ensure fair comparisons of neural network models, all of the fused representations have the same size (except for early fusion which has a larger size due to concatenation) and are fed to a two-layer feed forward neural network with the same number of parameters using the train/dev/test partition mentioned below.
| Model | Modal. | Acc. | AUC | EER | F-1 |
| Majority | – | 0.7753 | 0.5000 | 0.5000 | – |
| F | 0.7749 | 0.6752 | 0.3714 | 0.4965 | |
| MPF-1 | S | 0.7491 | 0.5271 | 0.4850 | 0.1816 |
| C | 0.7724 | 0.5141 | 0.4928 | 0.0813 | |
| F + S | 0.7976 | 0.6960 | 0.3568 | 0.5318 | |
| MPF-2 | F + C | 0.7932 | 0.6935 | 0.3579 | 0.5269 |
| S + C | 0.7633 | 0.5386 | 0.4787 | 0.1987 | |
| SVM | All | 0.7542 | 0.6637 | 0.3768 | 0.4772 |
| NN-Early | All | 0.8046 | 0.6867 | 0.3693 | 0.5208 |
| NN-Cube | All | 0.8023 | 0.7048 | 0.3488 | 0.5453 |
| NN-TC | All | 0.8015 | 0.6931 | 0.3615 | 0.5290 |
| MPF | All | 0.8139 | 0.7152 | 0.3416 | 0.5641 |
5.3 Methodology
The 30 subjects were randomly separated into 20/5/5 train/dev/test sets. Each subject is in only one partition so that models can generalize to new drivers. For each subject, features are scaled to zero mean and unit variance. The binary classification of distraction is performed at frame-level, so the train/dev/test sets have 147k/36k/37k datapoints. Since the data is imbalanced, the performance of the models is evaluated by Area Under ROC Curve (AUC), Equal Error Rate (EER), and F-1 score. We chose the hyper-parameters of each model based on its development set performance. Neural network models were trained using the Adam optimizer [33] with a step learning rate scheduler, regularized by dropouts [34]. The size of the fused representation is 16 and the size of hidden layers is 8.
5.4 Results and Discussion
In Table 1, we report the experimental results of the baseline models and our MPF model with accuracy, AUC, EER, and F-1 score. For MPF-1 and MPF-2, we also show the choice of feature combinations that was used. Other baseline models besides Majority use all three modalities.
Table 1 shows that MPF performs best for the combinations of modalities (MPF-1 and MPF-2). It also shows that even if some unimodal features have poor performance, all modalities contribute to a certain extent to the results. That is, we achieve monotonically increasing accuracy with MPF using modalities that may not individually have good performance. This emphasizes the importance of intermodal interaction in multimodal fusion representation.
Results show that MPF performs better than the baseline models (all using three modalities), where the MPF model achieves an AUC of 0.7152, an EER of 0.3416, and an F-1 score of 0.5641 on the test set, while the best baseline NN-Cube achieves 0.7048, 0.3488, and 0.5453 respectively.
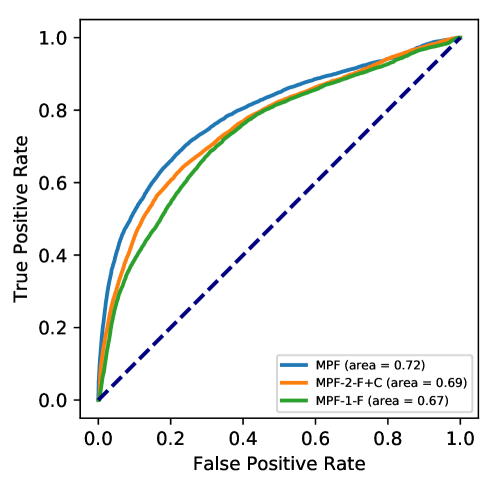
We also show the ROC curve of selected models in Figure 3. at various detection thresholds. We see that using more modalities (blue curve) has the largest ROC AUC. Performance increased when the speech modality was added. By adjusting the detection threshold, MPF achieves the lowest false positive rate while preserving good detection accuracy.
6 Conclusion
The results confirm that combining signals from multiple modalities through MPF affords better prediction performance for distraction detection due to its ability to model unimodal, bimodal and trimodal interactions. In future work we plan to add the fourth modality from the forward-facing camera that records road conditions to further boost performance.
7 Acknowledgements
We thank the anonymous reviewers for their valuable comments. We thank Zhenqiang Xu and Qizhe Xie for suggestions on the draft. This work has been sponsored by the U.S. Department of Transportation grant (Carnegie Mellon University UTC T-SET). The opinions expressed in this paper do not necessarily reflect those of the U.S. Department of Transportation.
References
- [1] “Distracted driving 2015,” 2017. [Online]. Available: https://crashstats.nhtsa.dot.gov/Api/Public/ViewPublication/812381
- [2] D. L. Strayer, J. Turrill, J. M. Cooper, J. R. Coleman, N. Medeiros-Ward, and F. Biondi, “Assessing cognitive distraction in the automobile,” Human Factors, vol. 57, no. 8, pp. 1300–1324, 2015.
- [3] “Distraction detection algorithm evaluation,” 2013. [Online]. Available: https://www.nhtsa.gov/sites/nhtsa.dot.gov/files/811548.pdf
- [4] T. Baltrusaitis, C. Ahuja, and L. Morency, “Multimodal machine learning: A survey and taxonomy,” CoRR, vol. abs/1705.09406, 2017.
- [5] Y. Liang, M. L. Reyes, and J. D. Lee, “Real-time detection of driver cognitive distraction using support vector machines,” IEEE Transactions on Intelligent Transportation Systems, vol. 8, no. 2, pp. 340–350, June 2007.
- [6] L. Fridman, H. Toyoda, S. Seaman, B. Seppelt, L. Angell, J. Lee, B. Mehler, and B. Reimer, “What can be predicted from six seconds of driver glances?” CoRR, vol. abs/1611.08754, 2016.
- [7] A. Fernández, R. Usamentiaga, J. Carús, and R. Casado, “Driver distraction using visual-based sensors and algorithms,” Sensors, vol. 16, no. 11, pp. 1–44, 2016, jCR: 2.676 - Q1 [2016].
- [8] C. Streiffer, R. Raghavendra, T. Benson, and M. Srivatsa, “Darnet: a deep learning solution for distracted driving detection,” in Middleware Industry. ACM, 2017, pp. 22–28.
- [9] N. Li and C. Busso, “Analysis of facial features of drivers under cognitive and visual distractions,” in 2013 IEEE International Conference on Multimedia and Expo (ICME), July 2013, pp. 1–6.
- [10] H. B. Kang, “Various approaches for driver and driving behavior monitoring: A review,” in 2013 IEEE International Conference on Computer Vision Workshops, Dec 2013, pp. 616–623.
- [11] M. Kutila, M. Jokela, G. Markkula, and M. R. Rue, “Driver distraction detection with a camera vision system,” in 2007 IEEE International Conference on Image Processing, vol. 6, Sept 2007, pp. VI – 201–VI – 204.
- [12] R. Klette, “Vision-based driver assistance systems,” 2015.
- [13] M. Rezaei and R. Klette, “Look at the driver, look at the road: No distraction! no accident!” in 2014 IEEE Conference on Computer Vision and Pattern Recognition, June 2014, pp. 129–136.
- [14] C.-W. You, N. D. Lane, F. Chen, R. Wang, Z. Chen, T. J. Bao, M. Montes-de Oca, Y. Cheng, M. Lin, L. Torresani, and A. T. Campbell, “Carsafe app: Alerting drowsy and distracted drivers using dual cameras on smartphones,” in Proceeding of the 11th Annual International Conference on Mobile Systems, Applications, and Services, ser. MobiSys ’13. New York, NY, USA: ACM, 2013, pp. 13–26.
- [15] J. H. L. Hansen, C. Busso, Y. Zheng, and A. Sathyanarayana, “Driver modeling for detection and assessment of driver distraction: Examples from the utdrive test bed,” IEEE Signal Processing Magazine, vol. 34, no. 4, pp. 130–142, July 2017.
- [16] P. Angkititrakul, D. Kwak, S. Choi, J. Kim, A. Phucphan, A. Sathyanarayana, and J. H. L. Hansen, “Getting start with utdrive: Driver-behavior modeling and assessment of distraction for in-vehicle speech systems,” 2007.
- [17] N. Kamaruddin and A. Wahab, “Driver behavior analysis through speech emotion understanding,” in 2010 IEEE Intelligent Vehicles Symposium, June 2010, pp. 238–243.
- [18] C. Craye, A. Rashwan, M. S. Kamel, and F. Karray, “A multi-modal driver fatigue and distraction assessment system,” International Journal of Intelligent Transportation Systems Research, vol. 14, no. 3, pp. 173–194, 2016.
- [19] N. Li and C. Busso, “Predicting perceived visual and cognitive distractions of drivers with multimodal features,” IEEE Trans. Intelligent Transportation Systems, vol. 16, no. 1, pp. 51–65, 2015. [Online]. Available: https://doi.org/10.1109/TITS.2014.2324414
- [20] A. Zadeh, M. Chen, S. Poria, E. Cambria, and L. Morency, “Tensor fusion network for multimodal sentiment analysis,” in EMNLP. Association for Computational Linguistics, 2017, pp. 1103–1114.
- [21] C. Craye and F. Karray, “Driver distraction detection and recognition using RGB-D sensor,” CoRR, vol. abs/1502.00250, 2015.
- [22] S. Taamneh, P. Tsiamyrtzis, M. Dcosta, P. Buddharaju, A. Khatri, M. Manser, T. K. Ferris, R. C. Wunderlich, and I. T. Pavlidis, “A multimodal dataset for various forms of distracted driving.” Scientific data, vol. 4, p. 170110, 2017.
- [23] R. M. et al., “Opends: A new open-source driving simulator for research,” 2013.
- [24] D. Chen and C. D. Manning, “A fast and accurate dependency parser using neural networks.” in EMNLP, A. Moschitti, B. Pang, and W. Daelemans, Eds. ACL, 2014, pp. 740–750.
- [25] R. Livni, S. Shalev-Shwartz, and O. Shamir, “A provably efficient algorithm for training deep networks,” CoRR, vol. abs/1304.7045, 2013.
- [26] R. Livni, S. Shalev-Shwartz, and O. Shamir, “On the computational efficiency of training neural networks,” in Advances in Neural Information Processing Systems 27, Z. Ghahramani, M. Welling, C. Cortes, N. D. Lawrence, and K. Q. Weinberger, Eds. Curran Associates, Inc., 2014, pp. 855–863.
- [27] M. Blondel, M. Ishihata, A. Fujino, and N. Ueda, “Polynomial networks and factorization machines: New insights and efficient training algorithms,” in ICML, ser. JMLR Workshop and Conference Proceedings, vol. 48. JMLR.org, 2016, pp. 850–858.
- [28] Q. Xie, K. Sun, S. Zhu, L. Chen, and K. Yu, “Recurrent polynomial network for dialogue state tracking with mismatched semantic parsers,” in Proceedings of the 16th Annual Meeting of the Special Interest Group on Discourse and Dialogue. Prague, Czech Republic: Association for Computational Linguistics, September 2015, pp. 295–304. [Online]. Available: http://aclweb.org/anthology/W15-4641
- [29] K. Sun, Q. Xie, and K. Yu, “Recurrent polynomial network for dialogue state tracking,” CoRR, vol. abs/1507.03934, 2015. [Online]. Available: http://arxiv.org/abs/1507.03934
- [30] W. Pei, T. Ge, and B. Chang, “An effective neural network model for graph-based dependency parsing.” in ACL (1). The Association for Computer Linguistics, 2015, pp. 313–322.
- [31] T. Baltrusaitis, P. Robinson, and L.-P. Morency, “Openface: An open source facial behavior analysis toolkit.” in WACV. IEEE Computer Society, 2016, pp. 1–10.
- [32] F. Eyben, M. Wöllmer, and B. Schuller, “Opensmile: the munich versatile and fast open-source audio feature extractor.” in ACM Multimedia, A. D. Bimbo, S.-F. Chang, and A. W. M. Smeulders, Eds. ACM, 2010, pp. 1459–1462.
- [33] D. P. Kingma and J. Ba, “Adam: A method for stochastic optimization,” CoRR, vol. abs/1412.6980, 2014. [Online]. Available: http://arxiv.org/abs/1412.6980
- [34] N. Srivastava, G. Hinton, A. Krizhevsky, I. Sutskever, and R. Salakhutdinov, “Dropout: A simple way to prevent neural networks from overfitting,” J. Mach. Learn. Res., vol. 15, no. 1, pp. 1929–1958, Jan. 2014. [Online]. Available: http://dl.acm.org/citation.cfm?id=2627435.2670313