Free-carrier dynamics in Au2Pb probed by optical conductivity measurements
Abstract
We measured the optical reflectivity of the Dirac material Au2Pb in a broad frequency range (30 – 48 000 cm-1) for temperatures between 9 and 300 K. The optical conductivity, computed from the reflectivity, is dominated by free-carrier contributions from topologically trivial bulk bands at all temperatures. The temperature-independent total plasma frequency of these carriers is eV. Overall, optical response of Au2Pb is typically metallic with no signs of localization and bad-metal behavior.
artem.pronin@pi1.physik.uni-stuttgart.de
-
•
October 25, 2018
Keywords: Dirac materials, topological semimetals, optical conductivity
1 Introduction
Current tremendous interest in different topological materials has led to prediction and experimental verification of a number of new solid-state phases, where the low-energy physics is governed by novel emerging quasiparticles, such as Dirac or Weyl fermions [1]. Recently, Au2Pb gained attention because of the prediction [2] of Dirac bands in this Laves-phase compound, which was known to be superconducting ( K) for decades [3]. Au2Pb possesses three structural transitions at , 51 and 40 K [2, 4, 5, 6, 7]. The high-temperature structure is cubic (space group ) and the electronic structure features bulk Dirac cones (six per Brillouin zone). The Dirac points are protected by rotation symmetry. Upon cooling, the symmetry gets lowered and the Dirac bands become gapped. At the lowest temperatures, the structure is orthorhombic (space group ). This phase has also been predicted to be topologically nontrivial and to possess topological surface states with linear dispersion relations [2]. In the superconducting state, the surfaces of Au2Pb crystals are therefore a natural platform for realizing Majorana fermions [8]. Most recent angle-resolved photoemission spectroscopy (ARPES) provided an experimental evidence for Dirac states in Au2Pb [7].
A direct gap is present in the low-temperature electronic structure at all momenta, but a number of electron- and hole-like trivial bands cross the Fermi level. The trivial electron and hole pockets also exist in the high-temperature phases, in addition to the bulk Dirac bands. Carriers from these trivial Fermi-surface pockets dominate the broad optical response of Au2Pb. In this paper, we investigate their contributions to the optical conductivity.
2 Sample preparation and characterization
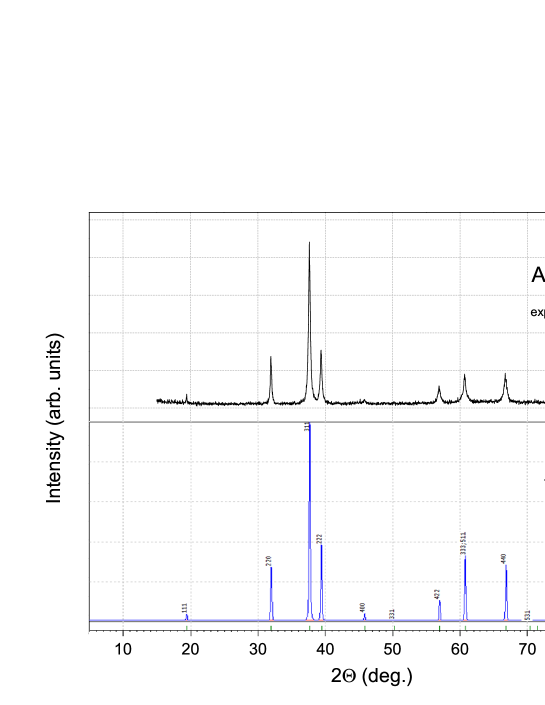
Single crystals of Au2Pb were synthesized according to the procedure reported by Schoop et al. [2]. The single crystals were grow out of lead flux. For the synthesis, 0.78 g of gold powder (99.99 %) and 1.24 g of lead beads (99.999 %, average diameter is 1 mm) were put together in a quartz tube with a neck of about 1-2 mm in the middle of the tube. The evacuated and sealed tube was heated within 12 h to 600 ∘C and kept there for 24 h. Then the melt was allowed to cool down (3 ∘C/h) to 300 ∘C and kept there for 48 h. When the quartz glass tube was turned, flux and crystals were separated. The traces of remaining lead on the surface of the crystals were removed by washing them in an aqueous solution of 20 ml acetic acid (50 %) and 4 ml hydrogen peroxide (30 %) for some minutes. Powder x-ray diffraction data of ball milled samples were collected on a Bruker D2 Phaser using MoK-radiation ( = 0.71073 Å) at room temperature and indicate a cubic Laves phase (space group ) with the lattice constant Å. No reflections from impurities, elements (Au and Pb), and any other lead-gold phases have been detected in these measurements, see figure 1. For the crystals used in the measurements, Laue diffraction demonstrated perfect single-crystalline patterns with the largest surfaces being either (111) or (100).
Electrical dc resistivity measurements were performed in four-contact geometry in a custom-made setup by cooling from room temperature down to 5 K. Transversal magnetoresistance (MR) and Hall resistivity measurements were conducted on Hall bars at 5 to 280 K in magnetic fields of up to 6 T. The crystal plane used for all transport experiments was (110). We should notice that due to the cubic high-temperature structure and the fact the at low temperatures the orthorhombic distortions are pretty small [2], no significant anisotropy is expected in Au2Pb.
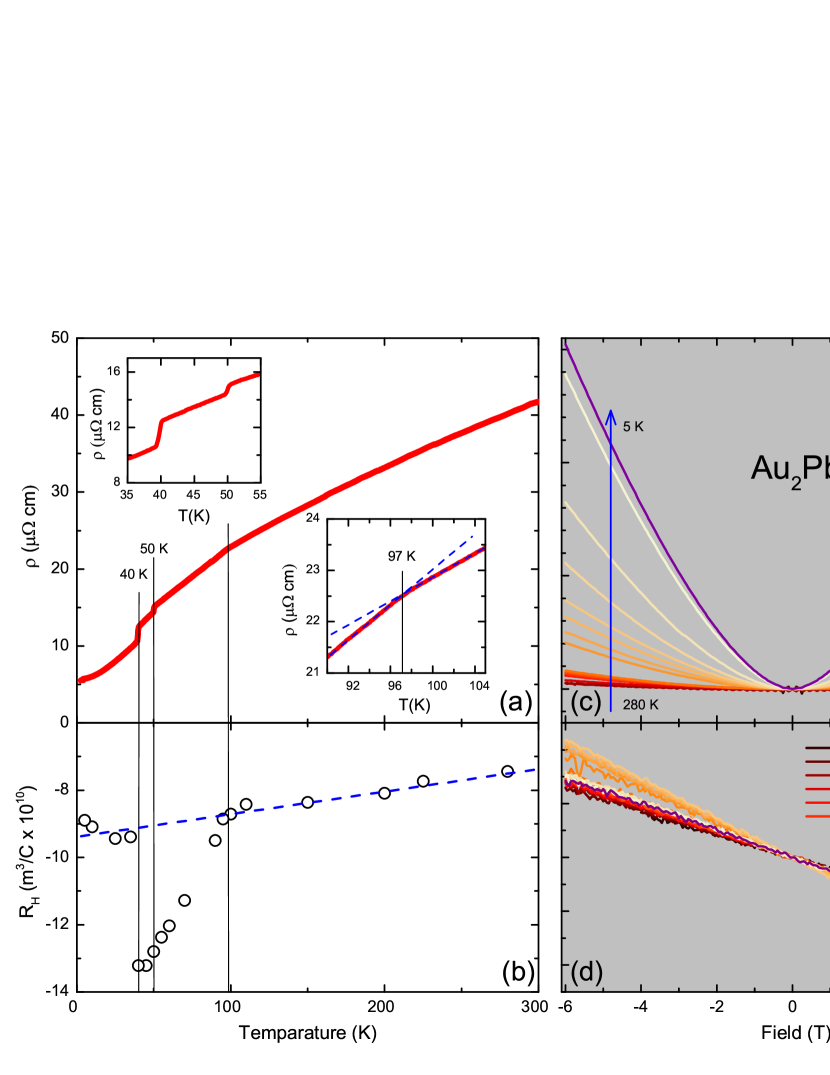
The results of our dc measurements are shown in the panel (a) of figure 2. A clear metallic behavior is observed, the residual resistivity being = 5.5 cm and ( K)/. These values, as well as the overall resistivity curve, are in good agreement with results previously reported in literature [2, 4, 5]. As discussed above, Au2Pb undergoes several structural phase transitions with decreasing temperature: at 97, 51 and 40 K [2]; accordingly, anomalies in the measured are detected at these temperatures. The magnetotransport results are presented in the panels (b), (c) and (d). We observe a non-saturating moderate positive magnetoresistance at all measurement temperatures and magnetic fields, panel (c). The Hall constant is negative and non-monotonic in temperature [panels (b) and (d)]. It exhibits jumps at the structural-transition temperatures, reflecting the corresponding changes in band structure [2].
As already noticed, band-structure calculations for the high- and low-temperature phases predict that both, electron- and hole-like, bands cross the Fermi level and, hence, contribute (with different signs) to at any temperature. Thus, a straightforward determination of the free-carrier concentration from is not possible. Application of the one-carrier-type (OCT) relation, , allows a low-bound estimation for the free-carrier concentration, cm-3 at 5 K. Such high strongly indicates conduction of metallic type (obviously, the real carrier concentrations can only be higher, as holes and electrons provide Hall constants of opposite signs, which partly compensate each other). Within the OCT model, one can also obtain rough estimates of the carrier mobility, cm2/(Vs), and of the relaxation rate, cm-1 (here, the free-electron mass is taken as the effective carrier mass). These values are obviously some sort of averages over all the bands crossing the Fermi level and hence should be considered with a grain of salt. Still, lies right in-between of the scattering rates obtained from our optical studies for the carriers described by the so-called narrow and broad Drude components, as discussed below.
3 Optical experiments
Temperature-dependent optical reflectivity, , was measured on a large [ mm2] polished (100) surface of a Au2Pb single crystal over a broad frequency range from to 10 000 cm-1. Additionally, we measured room-temperature reflectivity up to 48 000 cm-1. The spectra in the far-infrared (below 700 cm-1) were collected with a Bruker IFS 113v Fourier-transform spectrometer using in situ gold coating of the sample surface for reference measurements. At higher frequencies (up to 22 000 cm-1), a Bruker Hyperion infrared microscope attached to a Bruker Vertex 80v FTIR spectrometer was used. For these measurements, freshly evaporated gold mirrors (below 10 000 cm-1) and protected silver (above 10 000 cm-1) served as reference. Finally, at the highest frequencies (up 48 000 cm-1) we used a Woollam variable-angle spectroscopic ellipsometer with SiO2 on Si substrate as reference.
For Kramers-Kronig analysis [9], zero-frequency extrapolations have been made using the Drude model in accordance with the temperature-dependent dc resistivity measurements. Two narrow gaps in the measurements at around 100 and 700 cm-1, originating from absorption in beam splitters, were bridged by linear interpolations. For high-frequency extrapolations, we utilized the x-ray atomic scattering functions [10] followed by the free-electron behavior, , above 30 keV.
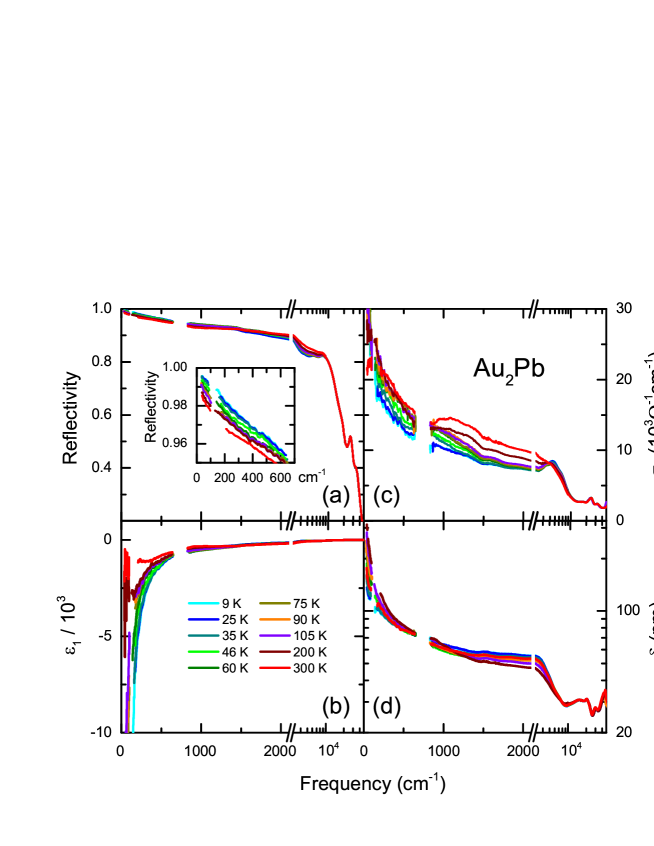
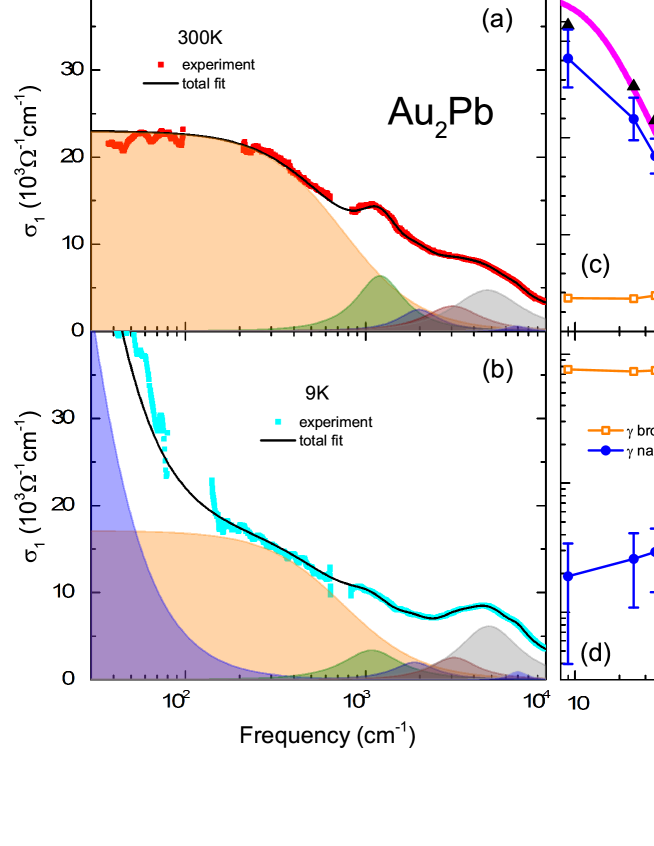
Figure 3 displays the optical reflectivity , the real part of the optical conductivity and of the dielectric constant , as well as the skin depth of Au2Pb for different temperatures. For frequencies higher than 10 000 cm-1, the optical properties are independent of temperature. Let us immediately note that the skin depth exceeds 20 nm for all measured temperatures and frequencies. Hence, our optical measurements of Au2Pb reflect its bulk properties.
Au2Pb demonstrates a typical metallic response: at the reflectivity approaches unity, is large and negative, is very high, and is inversely proportional to frequency. starts to drop down at around 10 000 cm-1, indicating the onset of the plasma edge. This high-frequency position of the plasma frequency is another indication of the high free-carrier concentration in Au2Pb.
Further, we can conclude that high concentration of free carriers prevents us from observing any sort of characteristic optical features of a Dirac material, where the interband transitions between the linearly dispersing bands are supposed to manifest themselves as a linear-in-frequency for 3D systems [11, 12, 13, 14, 15] or as a frequency-independent conductivity in the 2D case [16, 17, 18, 19, 20, 21].
In Au2Pb, one could expect to see the optical transitions between the lower and the upper Dirac bands at frequencies below some 3 200 cm-1, as the Lifshitz transition is supposed to be at around 400 meV 3 200 cm-1 [2]. To estimate the expected interband optical conductivity due to the inter-Dirac-band transitions , we can utilize the well-known relation [11, 12]:
| (1) |
which connects the real part of the complex conductivity to the number of 3D Dirac bands per Brillouin zone and the Dirac-band Fermi velocity . Using and m/s, estimated from the band-structure calculations [2], we calculate the expected optical conductivity due to the transitions between the lower and the upper Dirac bands. We find this conductivity to be orders of magnitude below the measured values. For example, we obtain of the order of 100 cm-1 at 1000 cm-1 (cf. the experimentally observed value, cm-1). Hence, the inter-Dirac-band transitions are completely masked in Au2Pb by free carriers. Hereafter, we concentrate on the intra-band, i.e. free-carrier, optical response.
In order to fit the optical response of Au2Pb, we used a standard Drude-Lorentz ansatz [9]. We have found that best description can be obtained, if we utilize two Drude contributions. Being expressed in terms of complex optical conductivity, , our fitting function reads as:
| (2) |
Here, is the dc limit of a Drude term, represents a free-electron scattering time, is the eigenfrequency of -th Lorentz oscillator, is its dielectric contribution and is the corresponding line width.
As mentioned above, band-structure calculations and ARPES measurements demonstrate that at any temperature Au2Pb possesses a few bands (Dirac or not) crossing the Fermi level [2, 7]. Thus, a multi-component Drude fit is relevant. Numerous previous optical-conductivity studies show that two Drude components is typically sufficient to fit the spectra, even if the system under study possesses more than two bands: first, adding further Drude terms () leads to ambiguous fits; second, a given Drude term is not necessarily related to the scattering processes within a given conduction band. Thus, we stick to the common minimal model. Such two-component approach has been widely used to interpret the normal-state optical spectra of iron-based superconductors [22, 23]. Recently, it has also been applied to (topological) semimetals [24, 25]. In this case, the two Drude terms can be interpreted as the response of free carriers within the Dirac (highly mobile carriers) and parabolic (less mobile carriers) bands. We show below that this simple interpretation is not applicable to Au2Pb.
Figures 4 (a) and (b) show the results of fitting the experimental data with Eq. 2 at 9 and 300 K. Let us note, that for best possible model description of the spectra, we fitted the experimental spectra of , and simultaneously. Also, we did not impose any restrictions on the fit parameters. In addition to the Drude terms, we used five Lorentzians, which effectively describe multiple transitions between trivial bands at high frequencies. We found that the two-Drude approach is relevant at all measurement temperatures, except of 300 K, where the two Drude components are not distinguishable and the spectra can be described by a single Drude term.
The fit parameters of the Drude terms versus temperature are shown in figures 4 (c) and (d). As one can see from the panel (c), the two Drude components completely account for the dc conductivity, , of Au2Pb: the sum of the zero-frequency limits of the Drude modes matches the dc conductivity values perfectly at any temperature. It is also evident that it is the narrow component, which is mostly responsible for the temperature dependence of . Overall, the temperature evolution of the optical spectra is pretty smooth.
We have to notice that the broad Drude term does reflect behavior of free carriers, has nothing to do with localization and cannot be replaced by a Lorentzian. As one can see from figure 4 (d), this term has an almost temperature-independent scattering rate, cm-1. An averaged Fermi velocity of the non-Dirac bands in Au2Pb can be estimated from the band structure [2] and is in the m/s range (for Dirac bands, it is even higher, as discussed above). Thus, the mean free path of the carriers, responsible for the broad Drude term, is at least around 7 Å. This is a few times more than the distance between the atoms. Hence, unlike the situation, e.g., in the superconducting cuprates [26, 27] and some other materials [28, 29, 30], the Ioffe-Regel limit [31] is not violated in Au2Pb. It is not a bad metal [32], the transport in Au2Pb is coherent and our “broad Drude” description is relevant.
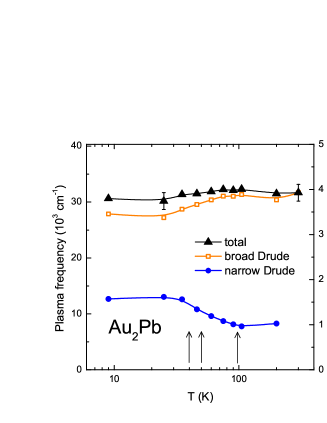
The plasma frequencies of the two Drude components, and , are shown in figure 5. They have generally rather flat temperature dependencies. Nevertheless, the plasma frequency (and hence, the corresponding spectral weight, which is proportional to the carrier density) of the narrow Drude band increases upon cooling. Would this absorption band correspond to the bulk Dirac carriers, had to decrease instead and eventually to disappear as , because the bulk Dirac bands are gapped and do not cross the Fermi level in the low-temperature phase of Au2Pb. As this decrease of does not happen, one can conclude that the narrow Drude term is not directly related to Dirac electrons. Obviously, the bulk Dirac electrons cannot provide any significant contribution to the broad Drude term, as this term is present at all temperatures and its spectral weight has hardly any temperature dependence. Also, Dirac fermions are typically highly mobile [33, 34], their scattering rates are low and the corresponding Drude bands are very narrow [15, 25]. Overall, the contribution of free Dirac carriers to the total optical response is basically negligible and optics only probes the carriers in the trivial bands of Au2Pb for all its structural phases.
In figure 5, the temperatures of the structural transitions are marked with vertical arrows. It is apparent that at temperatures around these transitions, the spectral weight redistributes between the Drude components, reflecting changes in the band structure. One has to note that plasma frequency is determinate by both, free-carrier concentration and effective mass. Thus, sharp changes in the Hall coefficient need not be directly reflected in the temperature evolution of plasma frequency. The smooth temperature evolution of and between roughly 40 and 100 K (at higher and lower temperatures, they are temperature independent within our accuracy) might indicate that more than one crystallographic structure exists at a given temperature here. Such nonhomogeneous states have indeed been detected in Au2Pb by temperature-dependent x-ray diffraction at a number of temperatures in this intermediate-temperature range [2].
As one can see from figure 5, the total plasma frequency is almost temperature independent, in agreement with the metallic type of conduction, see figure 2. The temperature-averaged value of the total plasma frequency is cm-1, eV. From , the ratio can be directly computed via:
| (3) |
Here is an averaged effective mass of all carriers and a parabolic band dispersion is assumed (as discussed above, we can ignore Dirac electrons, for which the plasma frequency is supposed to be related to the Fermi velocity, the band filling and, generally, the band gap [35, 36]). Thus, we obtain from equation (3): , where is the free-electron mass. The average effective mass is not know for Au2Pb. If we take , we get cm-3, a reasonable metallic concentration.
4 Summary
We have measured broadband optical response of Au2Pb – a Dirac material, which possess bulk Dirac bands at high temperatures (above 97 K) and surface Dirac bands at low temperatures (below 40 K). Neither of the Dirac states could be seen in optical conductivity because of the very high absorption due to free carriers (electrons and holes) in the trivial bulk bands. The total plasma frequency of these carriers remains temperature independent at eV. Optical measurements provide an estimate for the total carrier concentration: cm-3.
References
References
- [1] Wehling T O, Black-Schaffer A M and Balatsky A V 2014 Adv. Phys. 63 1
- [2] Schoop L M, Xie L S, Chen R, Gibson Q D, Lapidus S H, Kimchi I, Hirschberger M, Haldolaarachchige N, Ali M N, Belvin C A, Liang T, Neaton J B, Ong N P, Vishwanath A and Cava R J 2015 Phys. Rev. B 91 214517
- [3] Hamilton D, Raub C, Matthias B, Corenzwit E and Hull G 1965 J Phys Chem Solids 26 665
- [4] Chen K W, Graf D, Besara T, Gallagher A, Kikugawa N, Balicas L, Siegrist T, Shekhter A and Baumbach R E 2016 Phys. Rev. B 93 045118
- [5] Yu Y J, Xu Y, Xing Y, Zhang J, Ying T P, Hong X C, Wang M X, Zhang X, Jia S, Wang J and Li S Y 2016 EPL 116 67002
- [6] Xing Y, Wang H, Li C, Zhang X, Liu J, Zhang Y, Luo J, Wang Z, Wang Y, Ling L, Tian M, Jia S, Feng J, Liu X, Wei J and Wang J 2016 NPJ Quantum Materials 1 16005
- [7] Wu Y, Drachuck G, Wang L-L, Johnson D D, Swatek P, Schrunk B, Mou D, Huang L, Bud’ko S L, Canfield P C and Kaminski A 2018 Phys. Rev. B 98, 161107
- [8] Fu L and Kane C L 2008 Phys. Rev. Lett. 100 096407
- [9] Dressel M and Grüner G 2002 Electrodynamics of Solids (Cambridge: Cambridge University Press)
- [10] Tanner D B 2015 Phys. Rev. B 91 035123
- [11] Hosur P, Parameswaran S A and Vishwanath A 2012 Phys. Rev. Lett. 108 046602
- [12] Bácsi Á and Virosztek A 2013 Phys. Rev. B 87 125425
- [13] Timusk T, Carbotte J P, Homes C C, Basov D N and Sharapov S G 2013 Phys. Rev. B 87 235121
- [14] Chen R Y, Zhang S J, Schneeloch J A, Zhang C, Li Q, Gu G D and Wang N L 2015 Phys. Rev. B 92 075107
- [15] Neubauer D, Carbotte J P, Nateprov A A, Löhle A, Dressel M and Pronin A V 2016 Phys. Rev. B 93 121202
- [16] Ando T, Zheng Y and Suzuura H 2002 J. Phys. Soc. Japan 71 1318
- [17] Kuzmenko A B, van Heumen E, Carbone F and van der Marel D 2008 Phys. Rev. Lett. 100 117401
- [18] Mak K F, Sfeir M Y, Wu Y, Lui C H, Misewich J A and Heinz T F 2008 Phys. Rev. Lett. 101 196405
- [19] Carbotte J P 2017 J. Phys. Condens. Matter 29 045301
- [20] Ahn S, Mele E J and Min H 2017 Phys. Rev. Lett. 119 147402
- [21] Schilling M B, Schoop L M, Lotsch B V, Dressel M and Pronin A V 2017 Phys. Rev. Lett. 119 187401
- [22] Wu D, Barišic N, Kallina P, Faridian A, Gorshunov B, Drichko N, Li L J, Lin X, Cao G H, Xu Z A, Wang N L and Dressel M 2010 Phys. Rev. B 81 100512
- [23] Neubauer D, Pronin A V, Zapf S, Merz J, Jeevan H S, Jiao W-H, Gegenwart P, Cao G-H and Dressel M 2017 Phys. Status Solidi B 254 1600148
- [24] Schilling M B, Löhle A, Neubauer D, Shekhar C, Felser C, Dressel M and Pronin A V 2017 Phys. Rev. B 95 155201
- [25] Neubauer D, Yaresko A, Li W, Löhle A, Hübner R, Schilling M B, Shekhar C, Felser C, Dressel M and Pronin A V 2018 arXiv:1803.09708
- [26] Hussey N E, Takenaka K and Takagi H 2004 Philos. Mag. 84 2847
- [27] Basov D N and Timusk T 2005 Rev. Mod. Phys. 77 721
- [28] Kostic P, Okada Y, Collins N C, Schlesinger Z, Reiner J W, Klein L, Kapitulnik A, Geballe T H and Beasley M R 1998 Phys. Rev. Lett. 81 2498
- [29] Takenaka K, Sawaki Y, and Sugai S 1999 Phys. Rev. B 60 13011
- [30] Lobo R P S M, Chanda G, Pronin A V, Wosnitza J, Kasahara S, Shibauchi T, and Matsuda Y 2015 Phys. Rev. B 91 174509
- [31] Ioffe A F and Regel A R 1960 Prog. Semicond. 4 237
- [32] Emery V J and Kivelson S A 1995, Phys. Rev. Lett. 74 3253
- [33] Liang T, Gibson Q, Ali M N, Liu M, Cava R J and Ong N P 2015 Nat. Mater. 14 280
- [34] Shekhar C, Nayak A K, Sun Y, Schmidt M, Nicklas M, Leermakers I, Zeitler U, Skourski Y, Wosnitza J, Liu Z, Chen Y, Schnelle W, Borrmann H, Grin Y, Felser C and Yan B 2015 Nat. Phys. 11 645
- [35] Das Sarma S and Hwang E H 2009 Phys. Rev. Lett. 102, 206412
- [36] Sachdeva R, Thakur A, Vignale G and Agarwal A 2015 Phys. Rev. B 91, 205426