Discovery of An Active Intermediate-Mass Black Hole Candidate in the Barred Bulgeless Galaxy NGC 3319
Abstract
We report the discovery of an active intermediate-mass black hole (IMBH) candidate in the center of nearby barred bulgeless galaxy NGC 3319. The point X-ray source revealed by archival Chandra and XMMNewton observations is spatially coincident with the optical and UV galactic nuclei from Hubble Space Telescope observations. The spectral energy distribution derived from the unresolved X-ray and UV-optical flux is comparable with active galactic nuclei (AGNs) rather than ultra-luminous X-ray sources, although its bolometric luminosity is only . Assuming an Eddington ratio range between 0.001 and 1, the black hole mass () will be located at , placing it in the so-called IMBH regime and could be the one of the lowest reported so far. Estimates from other approaches (e.g., fundamental plane, X-ray variability) also suggest . Similar to other BHs in bulgeless galaxies, the discovered IMBH resides in a nuclear star cluster with mass of . The detection of such a low-mass BH offers us an ideal chance to study the formation and early growth of SMBH seeds, which may result from the bar-driven inflow in late-type galaxies with a prominent bar such as NGC 3319.
Subject headings:
galaxies: individual (NGC 3319)— galaxies: active — galaxies: nuclei1. Introduction
It’s widely believed that supermassive black holes (SMBHs) with masses of are present in most (possibly all) galaxies with massive bulges, and the BH mass correlates tightly with various classical bulge properties (see Kormendy & Ho 2013 for a review). These black holes must be grown from much smaller ’seeds’. Intermediate-mass black holes (IMBHs) in the nearby galaxies, with masses in the range of provide important clues to the mass and abundance of these seeds in the early universe (see review by Greene 2012). IMBHs also bridge the gap between SMBHs in the galactic nuclei and stellar black holes in binaries. Apparently, IMBHs are much more difficult to find because the radii of their gravitational influence are too small to be resolved spatially even in nearby galaxies. An alternative approach is to search for dwarf active galactic nuclei (AGNs), and hitherto discovers hundreds of candidates with BH masses of (Greene & Ho 2007; Dong et al. 2012; Reines et al. 2013; Lemons et al. 2015; Pardo et al. 2016; Mezcua et al. 2016, 2018; Liu et al. 2018).
In the hierarchical framework of galaxy formation and evolution, the correlation between SMBHs and galactic bulges are regulated by the major merger processes. A related issue is the observational census of black holes in late-type spirals and particularly whether supermassive black holes can form in galaxies that lack bulges, which haven’t undergone violent evolution by major merger. The stellar dynamical constraints on the presence of the BH in local group bulgeless galaxy M 33 shows that it does not contain a SMBH with an extremely tight upper limit of (Gebhardt et al. 2001). Again, evidence that BHs can occur in at least some very late-type disk galaxies comes from the detection of a small number of AGNs in Scd and Sd-type spirals. The first and most well-studied BH evidence in bulgeless galaxy is NGC 4395 (Filippenko & Sargent 1989; Filippenko & Ho 2003), which is a dwarf Sdm galaxy with hallmark signatures of a type 1 AGN (Filippenko & Sargent 1989; Filippenko & Ho 2003) such as broad emission lines (Filippenko & Sargent 1989) and rapid X-ray variability (Iwasawa et al. 2000). A ultraviolet (UV) reverberation-mapping measurement gave (Peterson et al. 2005), which is verified by recent direct dynamical measurement (den Brok et al. 2015). More evidences in other bulgeless galaxies are reported in recent years (e.g., Shields et al. 2008; Satyapal et al. 2007, 2016; Secrest et al. 2012). Instead of bulges, nature seems usually to make much more compact nuclear star clusters (NSCs) at the centers of very late-type spirals (e.g., Böker et al. 2002), with the size of globular clusters but ten times higher in the mass. It’s notable that the discovery of an AGN in a bulgeless galaxy is nearly always accompanied with a NSC (e.g., Filippenko & Ho 2003; Shields et al. 2008; Barth et al. 2009; Secrest et al.2013). However, the connection between NSCs and BHs, their link to galaxy formation and evolution, are still poorly understood.
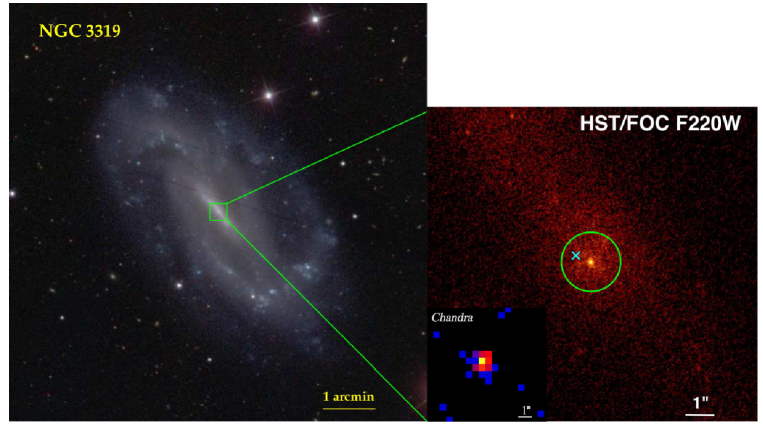
In this paper, we report the discovery of an IMBH candidate in the center of NGC 3319, which is a nearby barred bulgeless galaxy (see its SDSS image in the left panel of Figure 1). This target was firstly noted by our cross-match between XMMNewton (XMM for short) serendipitous catalog and nearby late-type galaxies. Recent Chandra observation pinpoints the X-ray source to the galaxy center. We adopt the luminosity distance (14.3 Mpc) determined from Cepheid variable stars (Sakai et al. 1999). The physical scale at the distance is 69 pc/″.
2. Data and Analysis
2.1. X-ray Observations
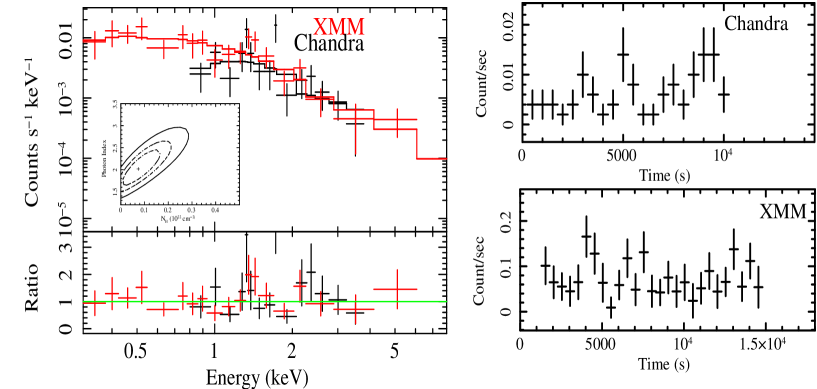
NGC 3319 was observed by Chandra on 2017 Jan 16 (observation ID 19350, PI: McHardy) for an exposure of 10 ks, using the back-illuminated chips of the Advanced CCD Imaging Spectrometer (ACIS-S). The galaxy was placed at the aimpoint of the S3 chip. The data were processed with the CIAO (version 4.9) and CALDB (version 4.7.7), following standard criteria. New level 2 event files were created using the chandra_repro script in CIAO. We ran the automated point-source detection tool wavdetect on 0.3–8 keV images of the S3 chip and found a point-like X-ray source which is spatially coincident with the optical nucleus of NGC 3319 (see detail in Section 3.1). Taking it as the source position, we extracted the source spectrum in the 0.3-7.0 keV range from a circular region with a radius of 2″.5. The background spectrum was estimated in an annulus region centered on the source position, with an inner radius of 4″ and outer radius of 7″, respectively. We also checked that no background flaring events occurred during the observation. There are totally 61 net counts detected in the energy band of 0.3–7 keV, but most (50/61) are in the 1-5 keV. Utilizing the same extraction regions as used for the spectral analysis, a background subtracted light curve was created using dmextract tool in CIAO. We have also noted that NGC 3319 is serendipitously detected by XMM as a point source on 2004 Aug 24 with an effective exposure time of 10 ks and the position is consistent with Chandra within . We extracted counts from a circle with radius of 40″ centered on the source, and the background is estimated from three circles with radii around the source. The extracted X-ray spectrum and light curves are presented in Figure 2.
We have tried to perform joint fit to the XMM and Chandra spectrum simultaneously. Due to the small number of source counts, the spectrum was rebinned to at least 5 counts in each energy bin for XMM and 2 counts for Chandra. The spectral fitting was performed using XSPEC with Cash-statistic in the minimization instead of . We fitted the spectrum with an absorbed powerlaw model (), in which is the Galactic absorption that is fixed in the fits. The model gives a photon index (1.60-2.50 in 90% confidence ranges) and an intrinsic absorption column density (0-1.8). The unabsorbed 2–10 keV flux for Chandra observation is erg s-1 cm-2, corresponding to a luminosity of erg s-1. Note that the XMM luminosity is higher by a factor of , but consistent with each other within the errors. We will adopt the Chandra result in the analysis below since it has better resolution.
2.2. HST Observations
NGC 3319 has been observed by Hubble Space Telescope (HST) Wide Field and Planetary Camera 2 (WFPC2) over a two-month period (1997 Nov 11 – 1998 Jan 3), including thirteen epochs of F555W and four epochs of F814W exposures. Before that, it has been targeted in the F606W filter on 1994 Oct 19 and in UV (F220W) by Faint Object Camera (FOC) on 1993 Mar 15.
2.2.1 UV image
The UV image of NGC 3319 was observed as part of the project to search for low-luminosity AGNs that appear as unresolved UV point sources in the nuclei of galaxy down to resolution 0″.05 with pre-COSTAR HST/FOC (Proposal ID: 4804). A compact source is embedded in the elongated diffuse emission along with the bar, which was first noticed as unresolved by Maoz et al. (1996). To check it and measure the brightness of the UV source, we try to perform two-dimensional decomposition using GALFIT (Peng et al. 2002; 2010). Precise point spread function (PSF) is of great importance to separate the compact central object from the extended starlight. However, the pre-COSTAR PSFs change with time since the telescope was shrinking fairly rapidly during the early years of the mission due to water loss from the carbon fiber telescope body. We adopted the stellar PSF taken in 1992 November111 http://www.stsci.edu/ftp/instrument_news/FOC/Foc_tools/psfs/f96_nov1992.html as an acceptable match to our data.
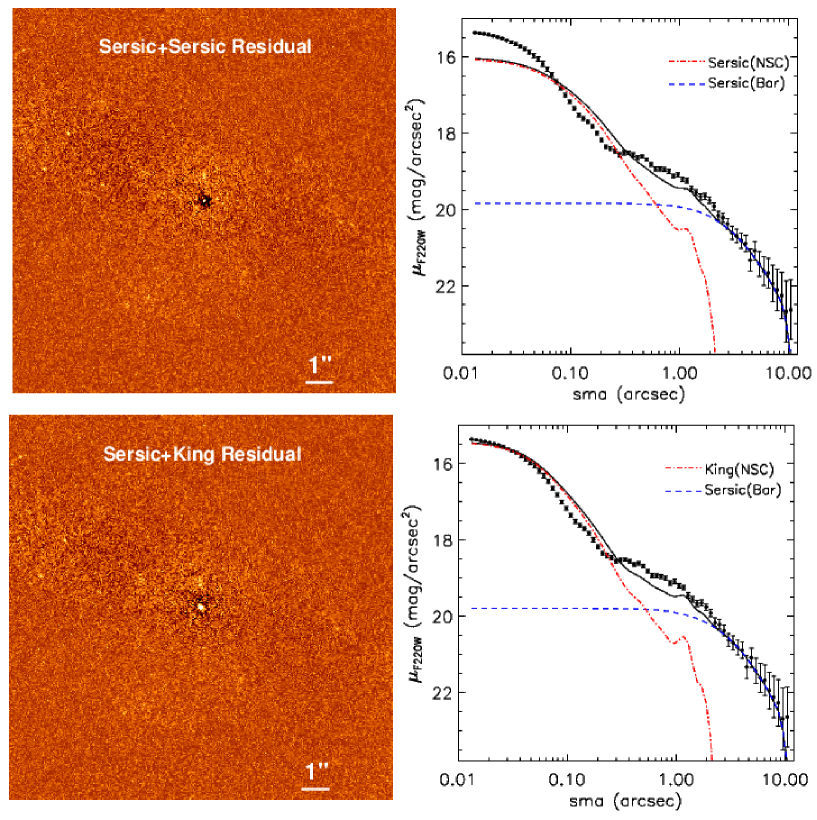
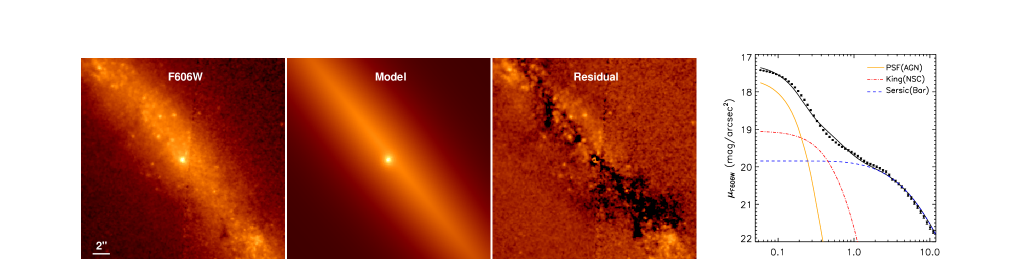
We begin the fitting with a two-Sérsic model, in which one represents the compact emission and the other for the extended underlying bar. The free fitting yields an unreasonable high Sérsic index () and large effect radius () for the central component. Hence we tried to fix the to be 0.5, 1, 2, 3 and 4 respectively and run it again. The best fitting (with least ) corresponds to and , which has given clean residuals for the outer region yet with significant mismatch in the central 2″ region (see the top panels of Figure 3). Then we attempted to replace the central Sérsic component with a standard empirical King profile (King 1966), which is a more popular model to characterize star cluster. The free fitting crashed immediately because of an unacceptably large truncation radius () as well as small core radius (), thus we fixed the to different values (e.g., 30, 50, 100 pixels). The small (30 pixels) case yields similar systematical mismatch with the two-Sérsic scenario while the large (100 pixels) case fits the outer part much better except for a deficient filling in the very central part (¡0″.2). The obvious nuclear excess (see bottom panels of Figure 3) implies an unresolved or extremely compact component.
| Band | Component | (″/pc) | |||||
|---|---|---|---|---|---|---|---|
| (1) | (2) | (3) | (4) | (5) | (6) | (7) | (8) |
| F220W | PSF | 18.70 | |||||
| King | 18.17 | [2] | 0.60/41 | 1.0 | |||
| Sérsic | 15.01 | 0.67 | 8.52/587 | 0.24 | |||
| F606W | PSF | 20.14 | |||||
| King | 18.73 | [2] | 0.45/31 | 0.88 | |||
| Sérsic | 13.25 | 0.93 | 36.8/2537 | 0.13 |
Note. — Col. (1): filter. Col. (2): Components used in the fitting schemes. Col. (3): The fitted magnitudes, not corrected for Galactic extinction. Col. (4): The absolute magnitude after Galactic extinction correction. Col. (5): The index for Sérsic or for the King profile. Col. (6): The effective radius of the Sérsic component or core radius of King profile, in units of arcsec and pc, respectively. Col. (7): Axis ratio. Col. (8): Diskiness (negative)/boxiness (positive) parameter, defined in Eqn. (3) of Peng et al. (2002). The brackets mean that they are fixed. The formal errors given by GALFIT are all tiny: for magnitude and Sérsic index, for .
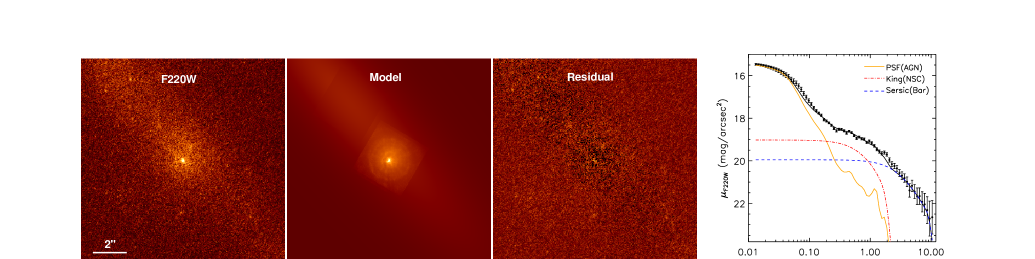
In order to depict the nuclear excess in a more self-consistent way, we then performed GALFIT decomposition by adding an unresolved PSF component. We start with the PSF+ King + Sérsic model. The fitting has improved a lot (with reduced changed from 1.12 to 1.07) and yielded smooth residuals at both small and large scales (see top panels of figure 4). Given a zeropoint of 20.64 in the ST magnitude system, the fitted magnitudes of the PSF and King component are and , corresponding to and erg s-1 cm-2 Å-1, respectively. To test whether the magnitudes are model dependent, we then try the PSF+2-Sérsic model, that is to fit the NSC with a Sérsic component (e.g., Carson et al. 2015) instead of a King profile. The fitting yields slightly larger residuals yet with a similar PSF magnitude of , which is 0.04 magnitude offset from the King model. We take the offset as the uncertainty of the PSF component. The final best-fit parameters are presented in Table 1.
We have also tried the PSF model created by Tinytim (Krist 1995), which has considered the spherical aberration, and obtained comparable results yet with larger residuals in the central part than empirical star PSF.
2.2.2 Opitcal Image
The step-by-step decomposition is not trivial for WFPC2 optical images. First, the resolution in the optical is lower than the UV, particularly considering that the center of NGC 3319 is located in the WF4 camera (0″.1/pixel) and thus severely undersampled. Moreover, the F555W and F814W images are all saturated in the central part, but the fact itself indicates a bright nucleus. The F606W image is the only unsaturated optical image because of a shorter exposure time. For ease of rejecting cosmic rays, the observation was splitted into 2 equal exposures of 80 seconds each. The two single exposures are then combined, resulting in the cosmic-ray cleaned image which is ready for the further GALFIT fitting. Following our previous work with F606W imaging decomposition (Jiang et al. 2013), we used the modeled PSF generated by Tinytim.
The same model as the UV band is exploited in the fitting and yields a fairly good result (see bottom panel of Figure 4). The PSF and NSC magnitudes given by the GALFIT fitting are and , respectively.
2.3. SDSS Spectrum
The center of NGC 3319 was spectroscopically observed by SDSS on 2004 Jan 29 with an exposure time of 2500 s. We fit the spectrum with the BC03 stellar population model (Bruzual & Charlot 2003) using the STARLIGHT code (Cid Fernandes et al. 2005). During the fitting, we have masked out all the prominent emission line regions. The fitted starlight model matches both the continuum and most of the main absorption lines well and no extra non-stellar component is needed. After subtracting the stellar population model from the raw spectra, no evident broad emission lines are visible but weak narrow emission lines of H, [O III], H and [N II] are detectable in the residual spectrum. We measure the flux of each emission line with a single Gaussian model.
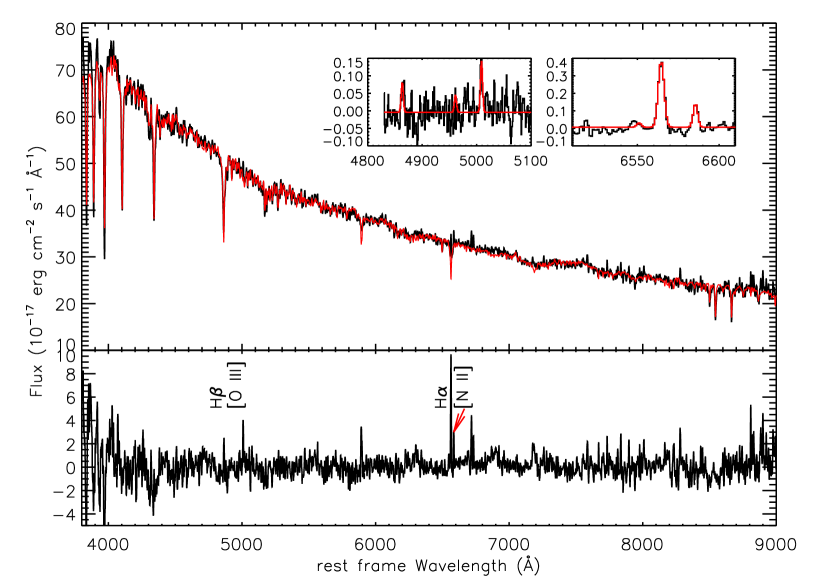
The BPT line-ratio diagram (Baldwin, Phillips & Terlevich 1981) are commonly adopted to discriminate between AGN and SF activity. The NGC 3319 is located at the star-forming region of the BPT diagram basing on the fitted line fluxes yet with large uncertainty. The absent AGN signature can be explained by the overwhelming dominance of the stellar light in the SDSS spectrum, which was acquired by a fiber with aperture of 3″. We have integrated the flux within SDSS fiber from the HST/WFPC2 F60W image and found a magnitude of 17.23, that is 15 times brighter than the fitted AGN component. We caution that the emission line fluxes are much smaller than the stellar continuum, so a small deviation (e.g., a few percent) of the stellar population subtraction may lead to significant difference in the residual Balmer lines. We have also noticed that NGC 3319 has been previously observed by double spectrograph on the Hale 5 m telescope and the spectra in the central region has been classified as uncertain H II nucleus (Ho et al. 1995, 1997).
The stellar population of NGC 3319 is quite young with an average age of only Myr given by the fitting. If we naively assume that the NSC possesses the same stellar population as that revealed by the SDSS spectrum, which has collected substantial starlight outside of the NSC, the mass of the NSC () is . As a comparison, Georgiev & Böker (2014) has obtained a much more compact NSC with pc and (Georgiev et al. 2016). The discrepancy can be addressed as they haven’t set the PSF component in their fitting, which will force the NSC to match the central unresolved component.
3. The Nature of the Unresolved Nuclear Emission
3.1. Coincidence of the X-ray and optical/UV Point Source
The X-ray luminosity ( erg s-1) revealed by XMMNewton and Chandra observations can not tell us immediately the nature of the source, e.g., an ultraluminous X-ray source (ULX) powered by X-ray binaries (XRBs) or a low-luminosity AGN. ULXs are usually defined as point-like sources within the optical extent of a host galaxy but away from the nucleus in order to exclude AGNs (see review by Kaaret et al. 2017). Several different isotropic X-ray luminosity threshold have been used to classify ULXs, such as the Eddington limit for a 1.4 neutron star (Makishima et al. 2000) or simply erg s-1(e.g., Swartz et al. 2011). First, we explore the possibility of XRBs by virtue of the scaling relations between the X-ray emission from XRBs and star formation rate (SFR). Using the recent formalism given by Lehmer et al (2016) and global SFR of NGC 3319 (Zhou et al. 2015), the expected global X-ray luminosity from high-mass XRBs is erg s-1, that is 5 times lower than the observed value. If we only care about the bar SFR, the predicted X-ray luminosity would be even lowered by one order of magnitude.
Second, the X-ray source position is exactly at or extremely close to the galactic center. The Chandra X-ray source coordinate is RA=10:39:09.446, DEC=+41:41:12.10, that is 0.16″ away from the optical center given by NED. The UV center given by HST/FOC image is RA=10:39:09.401, DEc=+41:41:11.91, that’s 0″.54 from the X-ray position (see right panel of Figure 1) yet still within the pointing error due to the guide star position uncertainty (1″). 222See the handbook on HST target acquisition in section 5.2.1 of http://documents.stsci.edu/hst/proposing/documents/pri_cy10/primer.pdf We have also checked the high-resolution optical center by HST images and found that they’re all consistent with each other when taking into consideration of errors. Hence, under current astrometry accuracy, the X-ray point source is highly consistent with the optical and UV galactic center, that is in disfavour with the ULX scenario since ULXs are defined as off-nucleus. On the other hand, according to the statistics on local ULX number density, ULXs are detected at rates of one per , one per star formation rate (Swartz et al. 2011). It will predict a chance of to find a ULX in the circle of Chandra resolution.
3.2. SED: Consistent with High-accretion-rate AGNs
Once both the unresolved optical-UV and X-ray radiation are convincingly assumed to originate from the same source, we can try to explore its nature by spectral energy distribution (SED) characteristics. First of all, ULXs usually don’t show or have very weak optical counterparts. The absolute magnitudes of well-studied ULX optical counterparts are all fainter than , with a median magnitude of (Vinokurov et al. 2018). Our GALFIT fitting of F606W image (roughly -band) gives a PSF magnitude of -10.67, that is significantly more luminous than normal ULXs. Furthermore, the X-ray to optical flux ratio, defined as (Maccacaro et al. 1982), where is the 0.3-3.5 keV observed flux in erg s-1 cm-2 and is the visual magnitude, can be used to distinguish AGN, BL Lac objects, and X-ray binaries (Stocke et al. 1991). The calculated of NGC 3319 is 0.25, that is apparently lower than usual ULXs with ratio (Tao et al. 2011). Hence both the position and the bright optical counterpart of the nuclear source are inconsistent with the ULX scenario.
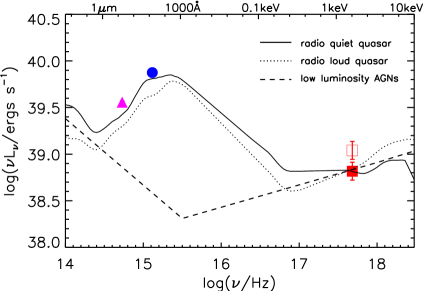
The spectral energy distribution (SED) of luminous Seyfert galaxies and quasars are well-known characterized by a big blue bump in the optical and UV bands, which is thought to be thermal emission from an optically thick accretion disk extending to a few gravitational radius (e.g., Shields 1978; Malkan & Sargent 1982). This is also the case for the optical-UV-X-ray SED of NGC 3319 nucleus(see Figure 6). Such an SED is very close to that of high accretion rate AGN systems ( in Ho (2008)), but very different from those of low accretion rate systems in nearby low luminosity AGNs (Ho 1999, 2008). In addition, the ratio of the optical-to-X-ray flux () is usually exploited by AGN community to specifically the balance of energy coming out in the optical/UV emerging from the accretion disk as compared with the X-ray luminosity from the corona (e.g., Tananbaum et al. 1979). We adopt the universal definition , where is the specific flux. Hence, it gives , in which is derived from the F220W flux assuming a spectral index -1.5 and the is from Chandra. The calculated has well fallen in the range of AGNs including IMBHs (Dong et al. 2012b; Baldassare et al. 2017; Liu et al. 2018), and suggests a central BH accreting system.
3.3. BH Mass Estimate
The of type 1 AGNs are usually computed by the empirical formula under the assumption of virial equilibrium of broad-line region gas (e.g., Greene & Ho 2005). Unfortunately, the SDSS spectrum of NGC 3319 is totally dominated by starlight and no broad H or H line is present. To catch sight of the AGN activity (such as potential broad lines) of such a small BH, further high-resolution spectra beyond seeing-limited observations (e.g., by HST or ground-based telescopes with adaptive optics) are probably required. Nevertheless, we can still try to estimate the by some other means.
Despite only a sparse sampling of the AGN SED of NGC 3319 is available (see Figure 6), it should still offer a more reliable measurement of the bolometric luminosity () of the system than any estimate based on a single band. We have first scaled the median radio-quiet quasar SED of Elvis et al. (1994) to the Chandra X-ray luminosity and then integrated the whole SED, the resulted is erg s-1. If we scale the quasar SED to the optical or UV luminosity, the difference of the is not greater than 0.1 dex. Interestingly, the of NGC 3319 is similar to NGC 4395 (Peterson et al. 2005) yet their SEDs are clearly differentiated with each other. The SED of NGC 4395 shows no big blue bump with and its / is estimated to be down to (Moran et al. 1999; Dewangan et al. 2008). In contrast, the SED of NGC 3319 agrees with a typical quasar. Besides, the / is found to be moderately correlated with hard X-ray photon index () in radio-quiet AGNs, using the correlation given by Shemmer et al. (2008), we got a / of 0.26 yet with an error as high as one dex. Assuming an Eddington ratio of 0.1, the of NGC 3319 will be , in the regime of IMBH. As a conservative estimate of uncertainty, allowing the Eddington ratio in the range of 0.001 to 1.0, we estimate the BH mass in the range of to .
It is widely known that in AGNs and BH X-ray binaries, there is a tight correlation among their radio luminosity (), X-ray luminosity () and , that is the so-called ”fundamental plane” (FP) of BH activity. Therefor, the FP could be adopted as an alternative to derive when both the X-ray and radio luminosity are available. The recent high-resolution () 1.5 GHz radio image of NGC 3319 yields non-detection with an upper-limit core luminosity of erg s-1 (Baldi et al. 2018). Taking advantage of the FP embodying low-mass BHs (Qian et al. 2018), the in NGC 3319 would be , that is consistent with the result above.
We have also tried to estimate the by X-ray variability. The excess variances of Chandra and XMM light curves are and (with 1- upper limit 0.067), respectively. We note that the value measured from the Chandra is broadly consistent with that from the XMM within errors. Although with a large scatter, we estimated the from the from the Chandra data, using the relation derived by Pan et al. (2015) for low-mass AGNs, yielding . In one word, the of NGC 3319 is well constrained to be at the low end of the central BHs, likely basing on various means above even if the precise mass is difficult to measure for the time being.
4. Discussions
4.1. The Uniqueness of the IMBH in NGC 3319
Our rough mass estimation of the IMBH in NGC 3319 may be down to , that is possibly lower than any other known BHs found in the center of galaxies (e.g., Secrest et al. 2012; Baldassare et al. 2015), promoting the accumulated IMBH population a step closer to the stellar mass BHs. The discovery of such a low-mass BH is extremely rare and its success is owing to the particularities of NGC 3319 by comparing with other well-known IMBHs (see a summary of their properties in Table 2).
| Galaxy | Distance | / | Host type | Reference | ||||
|---|---|---|---|---|---|---|---|---|
| (1) | (2) | (3) | (4) | (5) | (6) | (7) | (8) | (9) |
| NGC 4395 | 4.2 | 0.97 | dwarf irregular | Filippenko & Ho (2003) | ||||
| POX 52 | 93 | 1.44 | 0.2-0.5 | (2.2-4.2) | dwarf elliptical | Barth et al. (2004) | ||
| Henize 2-10 | 9 | … | dwarf starburst | Reines et al. (2011) | ||||
| UM 625 | 109 | (0.5-3) | 1.72 | 0.02-0.15 | Pseudobulge S0 | Jiang et al. (2013) | ||
| RGG 118 | 106 | … | dwarf disk | Baldassare et al. (2015) | ||||
| NGC 4178 | 16.8 | … | (1-10) | barred bulgeless | Secrest et al. (2012) | |||
| NGC 3319 | 14.3 | 1.40 | barred bulgeless | This work |
Note. — Column (1): object Name. Column (2): luminosity distance in unit of Mpc. Column (3): X-ray luminosity integrated from 2 to 10 keV. Column (4): bolometric luminosity in unit of erg s-1. Column (5): . Column (6): Eddington ratio. Column (7): estimated in unit of . Column (8): host galaxy type. Column (9): literature which reports the discovery of the IMBH. For the two extensively-studied IMBH prototypes NGC 4395 and POX 52, we have adopted the most updated parameters. For instance, the of NGC 4395 is measured from the gas dynamic modeling (den Brok et al. 2015).
First, NGC 3319 is one of the most nearby IMBHs. The distance effect operates not only in the brightness but also the physical size resolving ability. Even at HST resolution level, the structural decomposition of AGN and starlight is not an easy job for more distant sources, particularly when considering cases of co-existence of BH and NSCs (e.g., Shu et al. 2017). Only with the aid of HST UV and Chandra X-ray imaging, which have the best resolution current available, the SED of the unresolved AGN component is obtainable and then places strong constraints of its accretion rate. Hence, our discovery also implies that a joint UV/X-ray survey of late-type galaxies may be very efficient to detect low-mass BHs. Comparing with pure X-ray survey (e.g., She et al. 2017), the added UV band can help us diagnose its accretion state and the ULX possibility. Second, the of NGC 3319 is the faintest among all sources in question. Though it’s comparable with NGC 4395, however, its seemingly higher / results in a lower . RGG 118 is the closest source to NGC 3319 in terms of and /, whose is probably the lowest derived from the broad H line (Baldassare et al. 2015). Last but not least, the barred bulgeless host of NGC 3319 is also very distinguishing. The most analogous object before is NGC 4178, which also contains a NSC and is located at a similar distance, but with a two orders of magnitudes higher. The absence of a notable bulge also reduce the starlight contamination to recognize the signal from AGN.
As a brief summary, the BH in NGC 3319 is a unique IMBH in terms of its close distance, low luminosity, high accretion rate, bulgeless host, and most interestingly the small central BH. Further observations are highly encouraged to get a more precise .
4.2. Implications for the Formation and Growth of IMBHs
Galactic nuclei typically host either a NSC (prevalent in late-type galaxies) or a SMBH (common in early-type galaxies), among which the most intriguing observations is the coexistence of NSC and SMBH in some galaxies. Ferrarese et al. (2006) has introduced the term central massive object (CMO) to unify the BH and NSC and suggest that the formation and evolution of both types of central mass concentration may be linked by similar physical processes. As we have mentioned in the introduction, the central BH discovered in late-type galaxies are often associated with a NSC, that’s exactly the case of NSC 3319. Such systems are undoubtedly very valuable for us to probe the formation of seed BH and the NSC.
As a well-known rule of thumb, we know that the mass ratio between SMBHs and classical bulges are 0.2% (e.g., Marconi & Hunt 2003, see a more comprehensive review in Kormendy & Ho 2013). Assuming a Eddington rate of 0.1, we get , that is of the , slighter lower than the relation found for classical bulges. On the other hand, it’s proposed that similar scaling relations are also hold between and their host galaxy stellar mass () albeit it’s hotly debated what is the physical mechanism setting the correlation (e.g., Ferrarese et al. 2006; Georgiev et al. 2016). Given the = (Georgiev et al. 2016), the is only 0.18% of the , fairly consistent with classical bulges. As a comparison, the / and / ratios are 16% and 0.26% in NGC 4395 respectively, which contains a relatively larger BH and yet comparable NSC mass. This may suggest that the BH and NSC in NGC 3319 are lying in the very early stage of growth, even earlier than the IMBH prototype object NGC 4395.
Another striking morphology feature of NGC 3319 is the strong bar with a length about (7 kpc). As a typical morphology feature of non-axisymmetric potential, galactic bar can play an important role in the secular evolution of disk galaxies, that are capable of driving galactic-scale gas down to approximately pc scales (e.g., Shlosman et al. 1989; Friedli & Benz 1993; Wang et al. 2012). The resulting gas reservoir in the galaxy centers may serve to feed the BH and thus bars have been suspected to be viable mechanism to trigger AGN activity in spiral galaxies (e.g., Shlosman et al. 1990; Sakamoto et al. 1999; Jogee et al. 2005) although many statistics on basis of larger sample and with selection effect accounted for show that the AGN activity is little affected by the presence of large-scale bars (e.g., Hao et al. 2009; Lee et al. 2012; Goulding et al. 2017).
The hydrodynamical simulations don’t only show that a bar is indeed able to transfer gas to the galactic center and form a central mass concentration, but also suggest that a seed SMBH could be created (e.g., Sellwood & Moore 1999; Fanali et al. 2015). Li et al (2017) has revisited the model and argue that a NSC and perhaps a massive BH could form from the concentrated gas of low angular momentum during the bar-driven gas inflow, which will stall at a nuclear ring when the mass of the central object exceeds 1% of the disk mass. NGC 3319 may represent such a typical bar-driven growth scenario of SMBH seeds. According to Kormendy & Kennicutt (2004), a pseudobulge will form soon in this galaxy as a result of secular evolution. However, our analysis of SDSS spectrum suggests that the bar was experiencing a starburst in about 130 Myr from now, but the major star formation has ceased as there are only weak H emission lines from HII regions. Therefore, the formation of the pseudobulge must go through with stellar dynamic processes rather than in the process of the formation of new stars. The coincidence of the / and / ratios to that of classical bulge suggests perhaps that NSC is the progenitor of the pseudobulge although the physical process needs to be further understood.
References
- Baldassare et al. (2015) Baldassare, V. F., Reines, A. E., Gallo, E., & Greene, J. E. 2015, ApJ, 809, L14
- Baldassare et al. (2017) Baldassare, V. F., Reines, A. E., Gallo, E., & Greene, J. E. 2017, ApJ, 836, 20
- Baldi et al. (2018) Baldi, R. D., Williams, D. R. A., McHardy, I. M., et al. 2018, MNRAS, 476, 3478
- Baldwin et al. (1981) Baldwin, J. A., Phillips, M. M., & Terlevich, R. 1981, PASP, 93, 5
- Barth et al. (2004) Barth, A. J., Ho, L. C., Rutledge, R. E., & Sargent, W. L. W. 2004, ApJ, 607, 90
- Barth et al. (2009) Barth, A. J., Strigari, L. E., Bentz, M. C., Greene, J. E., & Ho, L. C. 2009, ApJ, 690, 1031
- Böker et al. (2002) Böker, T., Laine, S., van der Marel, R. P., et al. 2002, AJ, 123, 1389
- Böker et al. (2004) Böker, T., Sarzi, M., McLaughlin, D. E., et al. 2004, AJ, 127, 105
- Bruzual & Charlot (2003) Bruzual, G., & Charlot, S. 2003, MNRAS, 344, 1000
- Carson et al. (2015) Carson, D. J., Barth, A. J., Seth, A. C., et al. 2015, AJ, 149, 170
- Cid Fernandes et al. (2005) Cid Fernandes, R., Mateus, A., Sodré, L., Stasińska, G., & Gomes, J. M. 2005, MNRAS, 358, 363
- den Brok et al. (2015) den Brok, M., Seth, A. C., Barth, A. J., et al. 2015, ApJ, 809, 101
- Dewangan et al. (2008) Dewangan, G. C., Mathur, S., Griffiths, R. E., & Rao, A. R. 2008, ApJ, 689, 762
- Dong et al. (2012a) Dong, X.-B., Ho, L. C., Yuan, W., et al. 2012, ApJ, 755, 167
- Dong et al. (2012b) Dong, R., Greene, J. E., & Ho, L. C. 2012, ApJ, 761, 73
- Elvis et al. (1994) Elvis, M., Wilkes, B. J., McDowell, J. C., et al. 1994, ApJS, 95, 1
- Fanali et al. (2015) Fanali, R., Dotti, M., Fiacconi, D., & Haardt, F. 2015, MNRAS, 454, 3641
- Feng & Soria (2011) Feng, H., & Soria, R. 2011, NewA, 55, 166
- Ferrarese et al. (2006) Ferrarese, L., Côté, P., Dalla Bontà, E., et al. 2006, ApJ, 644, L21
- Filippenko & Sargent (1989) Filippenko, A. V., & Sargent, W. L. W. 1989, ApJ, 342, L11
- Filippenko & Ho (2003) Filippenko, A. V., & Ho, L. C. 2003, ApJ, 588, L13
- Friedli & Benz (1993) Friedli, D., & Benz, W. 1993, A&A, 268, 65
- Gebhardt et al. (2000) Gebhardt, K., Bender, R., Bower, G., et al. 2000, ApJ, 539, L13
- Georgiev Böker (2014) Georgiev, I. Y., Böker, T. 2014, MNRAS, 441, 3570
- Georgiev et al. (2016) Georgiev, I. Y., Böker, T., Leigh, N., Lützgendorf, N., & Neumayer, N. 2016, MNRAS, 457, 2122
- Goulding et al. (2017) Goulding, A. D., Matthaey, E., Greene, J. E., et al. 2017, ApJ, 843, 135
- Greene & Ho (2005) Greene, J. E., & Ho, L. C. 2005, ApJ, 630, 122
- Greene & Ho (2007) Greene, J. E., & Ho, L. C. 2007, ApJ, 670, 92
- Greene (2012) Greene, J. E. 2012, Nature Communications, 3, 1304
- Hao et al. (2009) Hao, L., Jogee, S., Barazza, F. D., Marinova, I., & Shen, J. 2009, Galaxy Evolution: Emerging Insights and Future Challenges, 419, 402
- Ho et al. (1995) Ho, L. C., Filippenko, A. V., & Sargent, W. L. 1995, ApJS, 98, 477
- Ho et al. (1997) Ho, L. C., Filippenko, A. V., & Sargent, W. L. W. 1997, ApJS, 112, 315
- Ho (1999) Ho, L. C. 1999, ApJ, 516, 672
- Ho (2008) Ho, L. C. 2008, ARA&A, 46, 475
- Iwasawa et al. (2000) Iwasawa, K., Fabian, A. C., Almaini, O., Lira, P., Lawrence, A., Hayashida, K., & Inoue, H. 2000, MNRAS, 318, 879
- Jiang et al. (2013) Jiang, N., Ho, L. C., Dong, X.-B., Yang, H., & Wang, J. 2013, ApJ, 770, 3
- Jogee et al. (2005) Jogee, S., Scoville, N., & Kenney, J. D. P. 2005, ApJ, 630, 837
- Kaaret et al. (2017) Kaaret, P., Feng, H., & Roberts, T. P. 2017, ARA&A, 55, 303
- King (1966) King, I. R. 1966, AJ, 71, 64
- Kormendy & Kennicutt (2004) Kormendy, J., & Kennicutt, R. C., Jr. 2004, ARA&A, 42, 603
- Krist (1995) Krist, J. 1995, Astronomical Data Analysis Software and Systems IV, 77, 349
- Lee et al. (2012) Lee, G.-H., Woo, J.-H., Lee, M. G., et al. 2012, ApJ, 750, 141
- Lehmer et al. (2016) Lehmer, B. D., Basu-Zych, A. R., Mineo, S., et al. 2016, ApJ, 825, 7
- Lemons et al. (2015) Lemons, S. M., Reines, A. E., Plotkin, R. M., Gallo, E., & Greene, J. E. 2015, ApJ, 805, 12
- Li et al. (2017) Li, Z., Sellwood, J. A., & Shen, J. 2017, ApJ, 850, 67
- Liu et al. (2018) Liu, H.-Y., Yuan, W., Dong, X.-B., Zhou, H., & Liu, W.-J. 2018, ApJS, 235, 40
- Maccacaro et al. (1982) Maccacaro, T., Feigelson, E. D., Fener, M., et al. 1982, ApJ, 253, 504
- Makishima et al. (2000) Makishima, K., Kubota, A., Mizuno, T., et al. 2000, ApJ, 535, 632
- Malkan & Sargent (1982) Malkan, M. A., & Sargent, W. L. W. 1982, ApJ, 254, 22
- Marconi & Hunt (2003) Marconi, A., & Hunt, L. K. 2003, ApJ, 589, L21
- Maoz et al. (1996) Maoz, D., Filippenko, A. V., Ho, L. C., et al. 1996, ApJS, 107, 215
- Mezcua et al. (2016) Mezcua, M., Civano, F., Fabbiano, G., Miyaji, T., & Marchesi, S. 2016, ApJ, 817, 20
- Mezcua et al. (2018) Mezcua, M., Civano, F., Marchesi, S., et al. 2018, MNRAS, 478, 2576
- Moran et al. (1999) Moran, E. C., Filippenko, A. V., Ho, L. C., et al. 1999, PASP, 111, 801
- Pan et al. (2015) Pan, H.-W., Yuan, W., Zhou, X.-L., Dong, X.-B., & Liu, B. 2015, ApJ, 808, 163
- Pardo et al. (2016) Pardo, K., Goulding, A. D., Greene, J. E., et al. 2016, ApJ, 831, 203
- Peng et al. (2002) Peng, C. Y., Ho, L. C., Impey, C. D., & Rix, H.-W. 2002, AJ, 124, 266
- Peng et al. (2010) Peng, C. Y., Ho, L. C., Impey, C. D., & Rix, H.-W. 2010, AJ, 139, 2097
- Peterson et al. (2005) Peterson, B. M., et al. 2005, ApJ, 632, 799
- Pogge (1989) Pogge, R. W. 1989, ApJS, 71, 433
- Qian et al. (2018) Qian, L., Dong, X.-B., Xie, F.-G., Liu, W., & Li, D. 2018, ApJ, 860, 134
- Reines et al. (2011) Reines, A. E., Sivakoff, G. R., Johnson, K. E., & Brogan, C. L. 2011, Nature, 470, 66
- Reines et al. (2013) Reines, A. E., Greene, J. E., & Geha, M. 2013, ApJ, 775, 116
- Sakai et al. (1999) Sakai, S., Ferrarese, L., Kennicutt, R. C., et al. 1999, ApJ, 523, 540
- Sakamoto et al. (1999) Sakamoto, K., Okumura, S. K., Ishizuki, S., & Scoville, N. Z. 1999, ApJ, 525, 691
- Satyapal et al. (2007) Satyapal, S., Vega, D., Heckman, T., O’Halloran, B., & Dudik, R. 2007, ApJ, 663, L9
- Satyapal et al. (2009) Satyapal, S., Böker, T., Mcalpine, W., et al. 2009, ApJ, 704, 439
- Secrest et al. (2012) Secrest, N. J., Satyapal, S., Gliozzi, M., et al. 2012, ApJ, 753, 38
- Secrest et al. (2013) Secrest, N. J., Satyapal, S., Moran, S. M., et al. 2013, ApJ, 777, 139
- Sellwood & Moore (1999) Sellwood, J. A., & Moore, E. M. 1999, ApJ, 510, 125
- She et al. (2017) She, R., Ho, L. C., & Feng, H. 2017, ApJ, 842, 131
- Shemmer et al. (2008) Shemmer, O., Brandt, W. N., Netzer, H., Maiolino, R., & Kaspi, S. 2008, ApJ, 682, 81
- Shields (1978) Shields, G. A. 1978, Nature, 272, 706
- Shields et al. (2008) Shields, J. C., Walcher, C. J., Böker, T., et al. 2008, ApJ, 682, 104
- Shlosman et al. (1989) Shlosman, I., Frank, J., & Begelman, M. C. 1989, Nature, 338, 45
- Shlosman et al. (1990) Shlosman, I., Begelman, M. C., & Frank, J. 1990, Nature, 345, 679
- Shu et al. (2017) Shu, X. W., Wang, T. G., Jiang, N., et al. 2017, ApJ, 837, 3
- Stocke et al. (1991) Stocke, J. T., Morris, S. L., Gioia, I. M., et al. 1991, ApJS, 76, 813
- Swartz et al. (2011) Swartz, D. A., Soria, R., Tennant, A. F., & Yukita, M. 2011, ApJ, 741, 49
- Tananbaum et al. (1979) Tananbaum, H., Avni, Y., Branduardi, G., et al. 1979, ApJ, 234, L9
- Tao et al. (2011) Tao, L., Feng, H., Grisé, F., & Kaaret, P. 2011, ApJ, 737, 81
- Vinokurov et al. (2018) Vinokurov, A., Fabrika, S., & Atapin, K. 2018, ApJ, 854, 176
- Wang et al. (2012) Wang, J., Kauffmann, G., Overzier, R., et al. 2012, MNRAS, 423, 3486
- Zhou et al. (2015) Zhou, Z.-M., Cao, C., & Wu, H. 2015, AJ, 149, 1