Young massive clusters in the interacting LIRG Arp 299: evidence for the dependence of star cluster formation and evolution on environment
Abstract
Archival WFC3/UVIS imaging of Arp 299 (NGC 3690E + NGC 3690W) is retrieved to investigate the young massive cluster (YMC) population of this ongoing merger. We extract 2182 cluster candidates, including 1323 high confidence photometric sources. Multiband photometry is matched with Yggdrasil models to estimate the age, mass, and extinction of each cluster. A Schechter fit of the truncated cluster mass function results in a characteristic mass . Our results confirm that intensely star-forming galaxies such as Arp 299 host more massive clusters than quiescent dwarf and normal spirals. In the case of NGC 3690E, we find that the cluster masses decrease with an increasing galactocentric radius likely due to the gas density distribution. On the other hand, the fitted age distributions of a mass-limited sample suggest that YMCs of the western component undergo stronger disruption than those hosted by the eastern galaxy. This is in agreement with the properties of the underlying cluster luminosity functions: a clear truncation at high luminosities with slopes generally shallower by dex than the ones of the NGC 3690E. Finally, the derived cluster formation efficiency, percent, indicates that Arp 299 has times more star formation happening in bound clusters compared to the cases of gas-poor spirals like NGC 2997 and NGC 4395. The merger generally follows the star formation rate density relation from the literature. The YMC photometric study of Arp 299 thus reveals that both formation and disruption mechanisms of the star cluster population are most likely environment-dependent.
keywords:
galaxies: interactions - galaxies: individual: Arp 299, NGC 3690E, NGC 3690W - galaxies: star clusters: general.1 Introduction
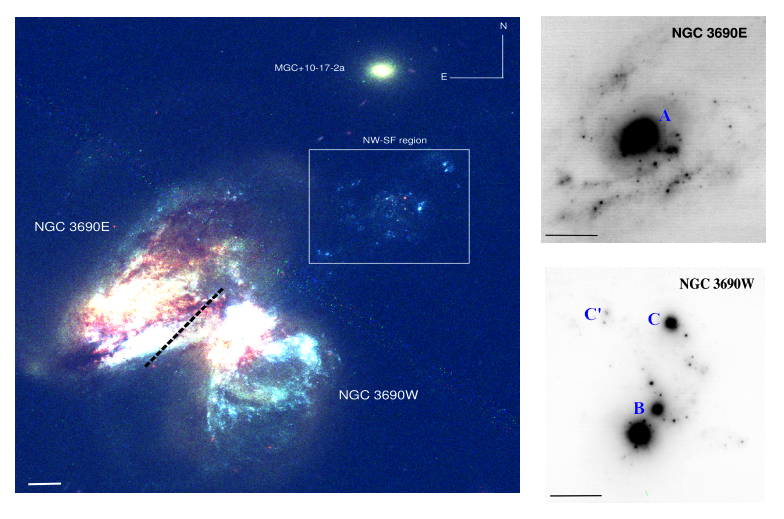
Arp 299 is a nearby luminous infrared galaxy (LIRG) system (log , Sanders et al., 2003) in an early merging stage, at a luminosity distance of 45 Mpc where arcsec. The interacting system consists of a pair of two irregular galaxies: NGC 3690E111NGC 3690E is commonly known as source A in the literature. in the eastern part, and NGC 3690W222NGC 3690W is commonly known as sources BC. the western component. While the former is possibly the remnant of a retrograde spiral galaxy, the latter has a more disturbed morphology with multiple nuclei. With a projected nuclear separation of around 4.7 kpc and the presence of a disk overlap region (known as ), the interaction between the two galaxies is believed to have started at least 750 Myr ago (Hibbard & Yun, 1999).
Larson et al. (2016) classified Arp 299 as a major merger with visible tidal tails where they found that the system contains a molecular gas fraction of 31 percent. In addition, extensive multi-wavelength observations by Alonso-Herrero et al. (2000, 2002); Alonso-Herrero et al. (2009, 2013) concluded that the interacting LIRG hosts extreme star formation (SF) activity with a recent episode of massive SF mainly enshrouded in the dusty nuclear starburst regions. Relatively high numbers of supernovae (SNe) and optically hidden core collapse SNe (CCSNe) have also been recorded in the circumnuclear regions of Arp 299 (e.g. Neff et al., 2004; Romero-Cañizales et al., 2011; Bondi et al., 2012; Mattila et al., 2012; Kankare et al., 2014). It is important to study SNe/CCSNe as they could be spatially associated with the young massive star clusters (YMCs), also known as super star clusters (SSCs) and proven to be good tracers of recent massive star formation (Kankare et al., 2014).
(Near)-infrared observations by Lai et al. (1999), Alonso-Herrero et al. (2000, 2002); Alonso-Herrero et al. (2009) and Randriamanakoto et al. (2013b) revealed that a large population of YMCs reside in the dusty nuclear starbursts and star-forming regions of Arp 299. Alternatively, Vavilkin (2011) and Linden et al. (2017) made use of archival HST/ACS data as part of the GOALS survey to probe the photometric properties of the YMC candidates. They found that the interacting system has very young and extinguished star clusters with a mass range between . In particular, Linden et al. (2017) suggested that the extreme environments of merging LIRGs favor both the formation of the very massive star clusters (with masses ) and the rapid dissolution of its cluster population. They also reported evidence of mass-independent disruption mechanisms by interpreting the mass distribution of the YMCs. Note, however, that only 53 cluster candidates hosted by Arp 299 were included in their analyses which use a combined catalogue drawn from a sample of 22 LIRGs. It is therefore worth revisiting the effects of the galactic environments and any other factors on the star cluster formation, evolution and disruption mechanisms happening in Arp 299.
It is important to investigate the influence(s) of both internal and external effects on the cluster properties since its universality is being actively questioned and debated (see e.g. Portegies Zwart et al., 2010; Whitmore et al., 2010; Bastian et al., 2012; Fall & Chandar, 2012; Fouesneau et al., 2014; Chandar et al., 2015; Hollyhead et al., 2016; Johnson et al., 2017; Adamo & Bastian, 2018). Are the characteristics of the star cluster population tightly related to the environmental properties of the host galaxy? Are internal processes such as stellar evolution and two-body relaxation strong enough to completely dissolve very massive and dense YMCs? Or do they need help from environment and/or mass-dependent external effects (e.g. strong tidal fields, dense giant molecular clouds) at some stages? The cluster mass function (CMF) is a powerful tool commonly used to help answer such questions.
Previously known to be well represented by a power-law function, Larsen (2009) and Gieles (2009) introduced another form of the CMF that is suggested to be more consistent with the data at both low and high-mass ends: a Schechter distribution. It is of the form , where is the slope and the truncated characteristic mass varying with the cluster environments. A review by Portegies Zwart et al. (2010) compared the Schechter MFs of different galaxies including the LMC, a cluster-poor spiral galaxy, a cluster-rich one, and the disturbed Antennae galaxies to explore the possibility of a mass and/or environment-dependent cluster initial mass function (CIMF). The results indicated that the location of the truncation is not the same for the different galaxies: quiescent normal galaxies have while strongly interacting galaxies are associated with higher values of . Observational works by Bastian et al. (2012), Konstantopoulos et al. (2013), and Adamo et al. (2015) also noticed that the inner and outer field of the host galaxy have two distinct Schechter characteristic masses: e.g. and , respectively. Such a difference arises because of the change in the maximum mass of the giant molecular clouds (GMCs). Furthermore, the high gas pressures of the extreme environments, seen in galaxy mergers, and the galactic nuclear regions enhance the formation of the most massive cluster candidates, and hence, result in a relatively high truncated of their corresponding Schechter CMF. Star cluster analyses of the Legacy ExtraGalactic UV Survey (LEGUS) sample also revealed strong evidence of a Schechter-type CMF with a slope and a truncation mass (Adamo et al., 2017; Messa et al., 2018). In contrast, Fouesneau et al. (2014) maintain that pure power-law mass distributions fit the data better than a Schechter one, though they also agree that the CMF may vary with respect to the host environment. Any turnover or high truncation in the CMF is believed to be a mere reflection of a constant disruption triggered by internal mechanisms (e.g. infant mortality, stellar evolution) during the cluster evolutionary processes (e.g. Whitmore et al., 2007, 2010, 2014). Chandar et al. (2014, 2017), Mulia et al. (2016), and Mok et al. (2018) also emphasize the quasi-universality of the CIMF and report that systematics alter the real feature of the mass function.
To further assess the formation conditions of YMCs, Bastian (2008) refers to the fraction of star formation happening in bound stellar clusters as cluster formation efficiency (CFE or ). The author derives the value of such a fraction by using the following expression:
| (1) |
where CFR is the cluster formation rate and SFR the host galaxy star formation rate. The former parameter is the total mass formed in clusters at a certain age interval divided by the duration of time of such an interval. In the solar neighborhood, the value of has been found to remain relatively constant: 5 % by Lada & Lada (2003), 7 % by Lamers & Gieles (2008), and 3 % for the SMC by Gieles & Bastian (2008). However, subsequent YMC extragalactic studies ruled out the concept of a constant parameter and suggested instead an environmentally-dependent CFE (Goddard et al., 2010; Adamo et al., 2011, 2015). Such arguments were supported with the predictions by e.g. Boily & Kroupa (2003), Pelupessy & Portegies Zwart (2012) and Kruijssen (2012). In fact, the fraction has been found to go beyond 40 % in high-SFR luminous blue compact galaxies (Adamo et al., 2011). A new version of the CFE - SFR surface density () relation was recently published by Johnson et al. (2016) and Messa et al. (2018). The correlation between the two parameters is thought to be a mere reflection of the CFE - gas density relation which means that high SF efficiency environments produce more GMCs. Hence, they are expected to have more stars forming in bound stellar clusters. The use of a diverse type of galaxies (normal spirals, starbursts, etc) to draw the relation, however, has raised some doubts. An inhomogeneous sample combined with low spatial resolution could affect the upper trend of the relation by showing a spurious increase of at high SFR densities (Chandar et al., 2017).
It has also been reported that the host environment and the cluster mass regulate the rate at which the cluster population get dissolved (e.g. Gieles, 2009; Bastian et al., 2011; Bastian et al., 2012; Linden et al., 2017). The intrinsic shape and slope of both the cluster luminosity function (CLF) and the CMF as well as the star cluster age distribution are usually analysed to define the intensity of the disruption. The latter distribution of the form is a mass-limited cluster sample plotted per time interval, where is the power-law slope. Such a diagram is also useful for producing the cluster formation history of the galaxy. While Fall et al. (2005) and Whitmore et al. (2007) interpret the age distribution for the clusters in the Antennae galaxies to provide evidence for a mass independent disruption scenario (e.g. a relaxation-driven cluster dissolution model), Lamers et al. (2005), Baumgardt et al. (2013) and Silva-Villa et al. (2014) have suggested that a steeper slope of is an imprint of a stronger cluster dissolution rate from strong tidal forces and GMCs of high surface density. In such a scenario, the massive cluster candidates () and those hosted by a relatively weak tidal environment are likely to remain gravitationally bound after a gradual cluster mass-loss. These YMCs are expected to have a long-term survival chance and could potentially become the present day globular clusters (see Bastian 2016 for a recent review).
The goal of this paper is to investigate whether the host galaxy environment along with other physical effects play a major role in defining the physical properties and the evolution of its YMC population. The study focuses on the star clusters of Arp 299 since the target has a large sample of YMCs and has been recently imaged by the HST/WFC3 camera. The cluster age, mass, and extinction will be derived by fitting high-resolution photometric data covering from the UV to the near-infrared (NIR) bands with carefully chosen single stellar population (SSP) models. The paper is organized as follows. In Section 2, we describe the data and observations. Object detection, aperture photometry as well as SSC candidate selection are reported in Section 3. Section 4 presents the cluster age and mass modelling. We analyse and discuss the star cluster photometric properties and the cluster formation histories in Sections 5 & 6. In Section 7, we summarize our work and then draw our conclusions.
2 Data and observations
This work mainly uses multiband observations of Arp 299 imaged with the HST WFC3/UVIS camera. Such a wealth of data will enable us to study the interacting galaxies to an unprecedented magnitude limit, hopefully detecting a significant number of new star clusters that also includes the low-mass candidates. To investigate whether there are NIR excess star clusters (see Section 6.7), we will combine the optical datasets with some observations taken with the Gemini/NIRI adaptive optics (AO) systems.
2.1 HST WFC3/UVIS data
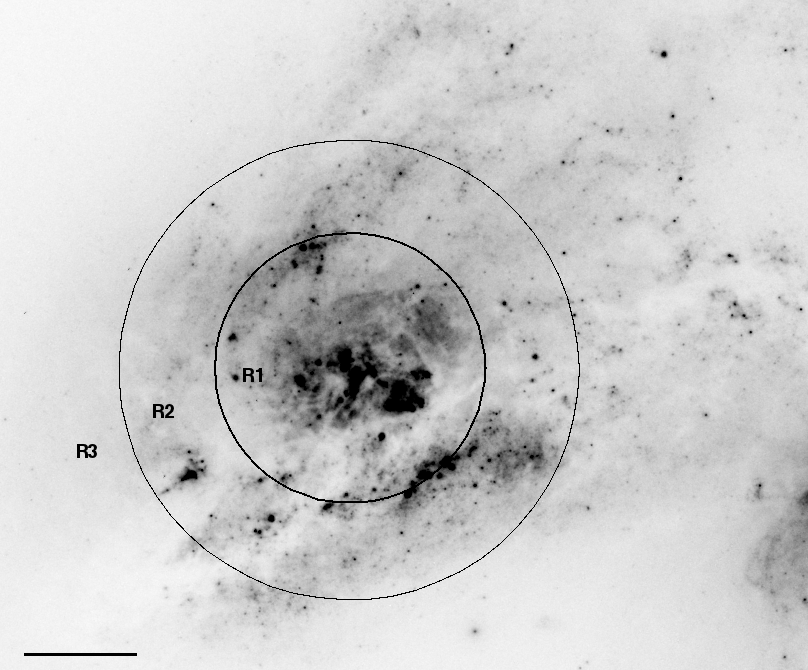
We retrieved already-processed WFC3/UVIS images of Arp 299 from the publicly available Hubble Legacy Archive (HLA333http://hla.stsci.edu) in the following broad-band filters: F336W (, 790 s), F438W (, 740 s), and F814W (, 740 s). The plate scale is 0.039 arcsec pixel-1 and the point-spread function (PSF) values for the point sources vary between 0.070.09 arcsec depending on the filter. Table 1 lists a summary of the observation log on June 24, 2010 (PI: Bond, PID: 12295). The left panel of Fig. 1 shows the three-color image of the pair of interacting galaxies from the exposures in a arcmin field of view (FoV). The northwest spheroidal MCG+10-17-2a and a star-forming region located 10 kpc away from the disk overlap were also covered during the HST imaging. Compared to previous HST instruments such as WFPC2 and WFC/ACS, the WFC3/UVIS camera provides sharper images with a more stable PSF. Furthermore, the use of deep -band data will help to constrain the cluster age-extinction degeneracy and to develop a more accurate approach on how to interpret results from -band YMC analyses.
2.2 Gemini/NIRI data
Arp 299 is amongst the targets observed in an ongoing survey dubbed SUNBIRD (SUperNovae and starBursts in the InfraReD or Supernovae UNmasked By InfraRed Detection) to search for dust-obscured CCSNe in starbursts and LIRGs using NIR AO systems (Väisänen et al., 2014; Kool et al., 2018). The -band (hereafter, referred to as -band) AO imaging of the interacting LIRG were obtained with the ALTAIR/NIRI instrument mounted on the Gemini-North telescope. Final science images of the two individual components, as shown in the right panel of Fig. 1, are the results of a multi-epoch survey during the period (PI: Ryder). The galaxy components of Arp 299 were observed separately due to the small FoV of 22 arcsec of the Gemini/NIRI camera with a plate scale of 0.022 arcsec pixel-1. The total integration times per galaxy are 1260 s (NGC 3690E) and 2192 s (NGC 3690W), respectively. The AO correction using laser guide stars resulted in a PSF of 0.1 arcsec for the point sources. The -band SSC catalogues were compiled using a criterion based on the concentration index vs. FWHM plot of the detected sources, with 81 candidates selected in each component. Further details on the observations, data reduction, as well as the selection criteria are reported in Randriamanakoto et al. (2013b).
| Filter | Pix.size | Mean wav. | Exp.time | PSF/FWHM |
| (arcsec) | (Å) | (sec) | (arcsec) | |
| (1) | (2) | (3) | (4) | (5) |
| F336W () | 0.039 | 3345.8 | 790 | 0.09 |
| F438W () | 0.039 | 4300.5 | 740 | 0.08 |
| F814W () | 0.039 | 8174.5 | 740 | 0.07 |
| Notes. Column 1: broad-band filter used; Column 2: the camera plate scale; Column 3: mean wavelength of the filter; Column 4: exposure time; Column 5: FWHM of bright isolated stars in the original image. | ||||
3 Photometry and source selection
3.1 Source extraction and aperture photometry
Automated source detection was performed on the unsharp-masked version of the combined -image using SExtractor (Bertin & Arnouts, 1996). Such a frame is chosen to gain a higher signal-to-noise ratio (SNR), and hence to facilitate the extraction of faint and extended objects. Two sets of the software critical parameters were adopted to optimally detect SSC candidates in the outer and inner regions of the galaxies. Besides the minimum object area of 8 pixels, a minimum detection limit of 4 combined with a background mesh width equal to 85 were used to extract the sources in the outer field. In contrast, a higher threshold of 9 with a relatively low background mesh of 20 were necessary to reduce the number of spurious objects from the inner field.
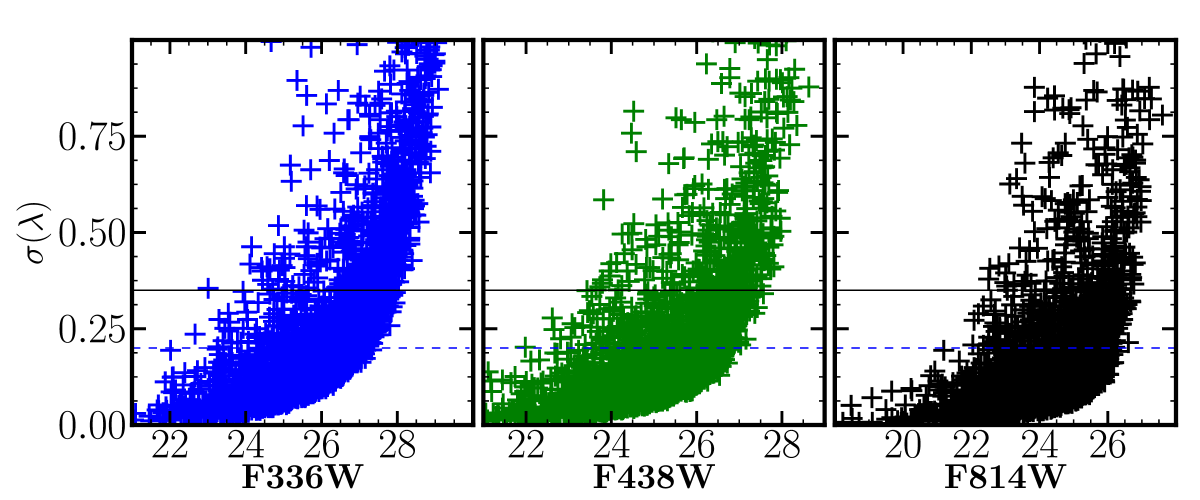
We then used IRAF/DAOPHOT package to perform aperture photometry on the resulting coordinates from SExtractor. Matched-aperture photometry was applied in all three -images with a fixed aperture radius of 2.5 pixels ( 0.1 arcsec) and sky background annuli from 4 to 6 pixels (0.08 arcsec wide). Figure 2 shows the multiband instrumental magnitudes plotted against their respective photometric uncertainties. Such plots help in deciding the value of the photometric error cutoff (see Section 3.2). Growth curves of bright and isolated sources were drawn up to 1 arcsec to calibrate - and -band aperture photometry. The value of the aperture correction was obtained from the HST/WFC3 data manuals for the -band data due to the noisy background and the lack of isolated sources. The VEGAMAG photometric zeropoints were also retrieved from the same manuals. These values along with the foreground Galactic extinction of each filter are listed in Table 2. The Vega-based absolute magnitudes are estimated to have uncertainties of mag; the relatively high errors are associated with the -band data.
| Filter | Nb.SSCs | Mag.limit | |||
| (mag) | (mag) | (mag) | () | (Vega-mag) | |
| (1) | (2) | (3) | (4) | (5) | (6) |
| 0.07 | 0.41, 23.46 | 0.17 | 1491 | 25.9 | |
| 0.06 | 0.40, 24.98 | 0.13 | 1879 | 27.0 | |
| 0.03 | 0.52, 24.67 | 0.12 | 1913 | 25.8 | |
| Notes. Column 1: broad-band filter used; Column 2: foreground Galactic reddening from NED Database; Column 3: aperture correction and zeropoint magnitude; Column 4: mean uncertainty of the cluster absolute magnitude; Column 5: number of SSCs with mag in the WFC3/UVIS field; Column 6: the corresponding Vega-based magnitude limit. | |||||
3.2 The optically-selected star cluster catalogue
The selection of star cluster candidates remains similar to the philosophy adopted by Randriamanakoto et al. (2013a, b) to draw their catalogues. The only difference lies on a cross-identification of the SExtractor coordinates in all three filters to extract the common sources instead of a criterion based on the concentration index vs. FWHM plot. As in Randriamanakoto et al. (2013a, b), preliminary steps prior to the source cross-matching include rigorous visual inspection to clean the catalogue from false detections, cosmic rays and hot pixels, foreground sources, and any contamination from the galaxy nuclei.
Only objects with 5 in all three filters were initially considered in order to output a catalogue of 1323 high confidence photometric SSC candidates. This number comes from cross-matching 1491, 1879, and 1913 objects that satisfy the conditions in the individual fields of -, -, and -band, respectively. The corresponding Vega-magnitude limits are listed in the last column of Table 2. Both the visual inspection and data point distribution in Fig. 2, however, indicate that a significant number of obvious SSCs would be rejected by applying such criteria in the photometric errors. Therefore, to draw our final -band catalogue of 2182 star cluster candidates, we set a cutoff of mag as a trade-off and also included 116 extra candidates clearly visible in all three filters but with a relatively high uncertainty in their -band magnitudes ( 0.50 mag). To strengthen our analyses, the resulting age and extinction of objects with magnitude uncertainties of 0.20 mag will be checked and evaluated separately. Nevertheless, we investigated the effects of photometric biases using the final catalogue which turned out to be insignificant. The -band apparent magnitudes with their uncertainties are available online in a machine-readable format as sampled in Table 3. Note that 74 of the selected cluster candidates are hosted by the northwest star-forming region. This subset of the catalogue will be analysed separately in Section 6.8.
To study the influence of any environment- and/or mass-dependent effects on the star cluster formation and disruption mechanisms, SSC candidates were divided in two different ways:
-
1.
as a function of the host galaxy component, i.e. NGC 3690E (A) vs. NGC 3690W (B+C). Setting a boundary (the dashed line in Fig. 1) between the two galaxy components is not trivial due to the ongoing disk overlaps in the area . The surface brightness distribution and the visual overlap region were, therefore, used to split the catalogue for convenience. A number of 988 and 1120 star cluster candidates were recovered for NGC 3690E and NGC 3690W, respectively. With a relatively large SSC population, NGC 3690W also hosts candidates with brighter magnitudes than the ones in the eastern component. For instance, the star clusters of NGC 3690W have -band absolute magnitudes between mag and mag. This range becomes mag in the field of NGC 3690E.
-
2.
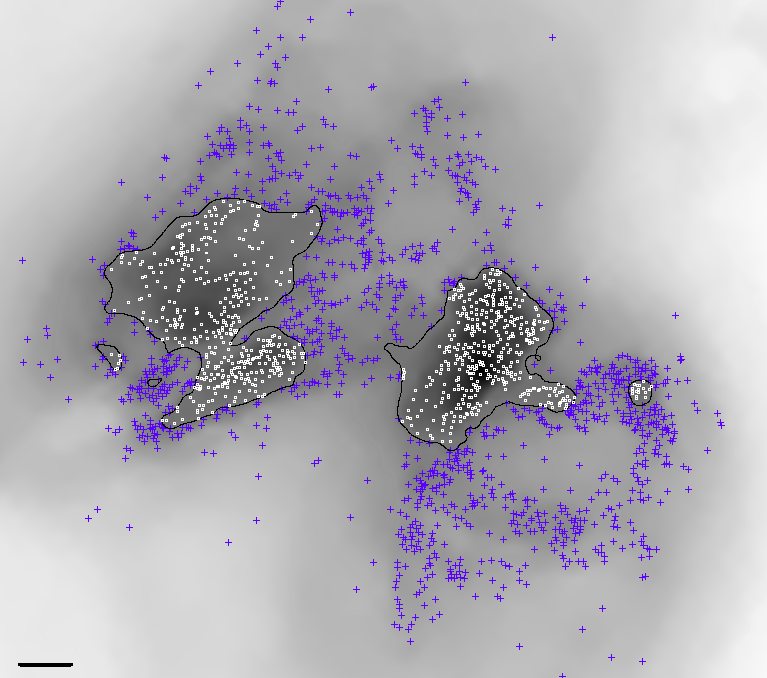
depending on their surrounding background levels, i.e. outer vs. inner regions. A logarithmic scale of the background map was used to define these two regions as shown in the upper panel of Fig. 3. Obscured nuclear regions of the interacting LIRG host 836 star clusters while we counted a population of 1272 SSC candidates in the outer field of the system.
The SSC population of NGC 3690E was also split into three categories by defining radial bins containing approximately an equal number of 330 clusters (see lower panel of Fig. 3). The bins range from 0 to 1.38 kpc (), 1.382.25 kpc (), 2.25 kpc and beyond () the galaxy detectable optical emission in the frame. This eastern component is chosen as a laboratory to further investigate any environmental effects on the cluster properties due to its morphological feature resembling that of a spiral galaxy.
|
|
3.3 Completeness of the catalogue
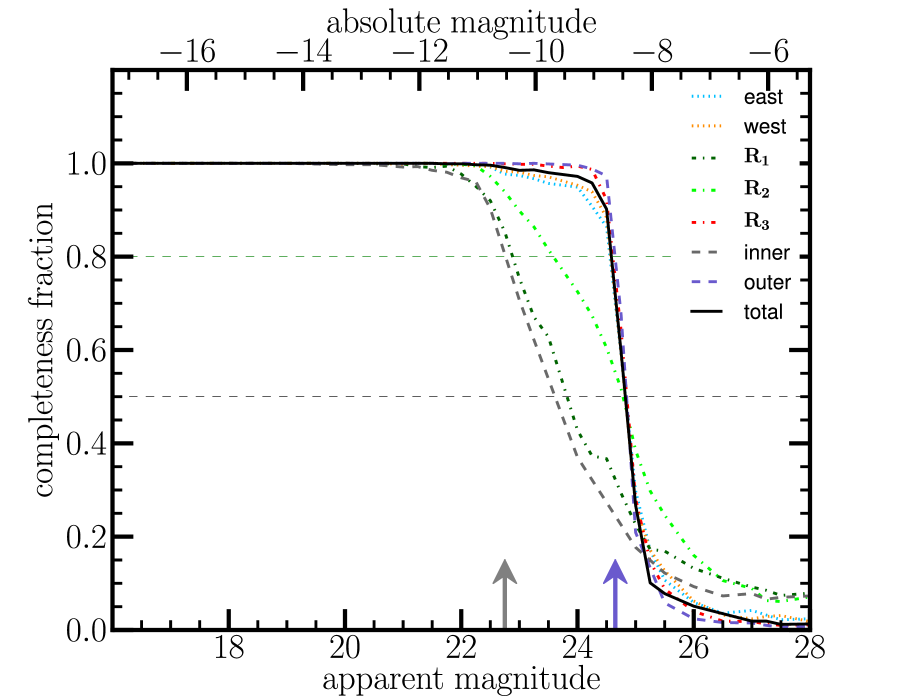
We performed Monte-Carlo completeness simulations to estimate the fraction of the sources being missed due to the detection limits and our source extraction methods. The same procedures as in Randriamanakoto et al. (2013b) were adopted and applied on the combined -frame between 16 to 28 magnitude range and considering the whole interacting system and different regions described in Section 3.2. Figure 4 plots the recovered completeness fractions as a function of magnitude in Arp 299 (black solid line), the inner (dashed grey) and outer (dashed purple) field. The other lines represent the recovery rates in the two galaxy components (dotted) and the three radial bins of NGC 3690E (dash-dotted). Based on the simulations, our catalogue is believed to be 80 percent complete down to and magnitudes, in the inner and outer regions, respectively. Note that core nuclei were excluded from the simulation because of their relatively high background levels.
| Source name | RA | DEC | F336W | F438W | F814W | AV | log( | log() |
|---|---|---|---|---|---|---|---|---|
| [deg] | [deg] | [mag] | [mag] | [mag] | [mag] | |||
| (1) | (2) | (3) | (4) | (5) | (6) | (7) | (8) | (9) |
| 1 | 172.105729167 | 58.5713222222 | 23.23 0.07 | 24.56 0.06 | 24.19 0.07 | 0.35 | 6.00 | 3.74 |
| 2 | 172.106341667 | 58.5724000000 | 24.61 0.15 | 25.34 0.10 | 24.94 0.14 | 0.01 | 7.15 | 3.61 |
| 3 | 172.106708333 | 58.5724972222 | 23.67 0.08 | 24.83 0.08 | 25.27 0.16 | 0.00 | 6.48 | 3.09 |
| 4 | 172.106895833 | 58.5725333333 | 25.05 0.24 | 26.01 0.15 | 25.05 0.11 | 0.25 | 6.95 | 3.48 |
| 5 | 172.107008333 | 58.5723416667 | 21.55 0.03 | 22.94 0.03 | 22.45 0.03 | 0.25 | 6.00 | 4.36 |
| 6 | 172.107150000 | 58.5728333333 | 23.86 0.11 | 24.94 0.09 | 23.95 0.07 | 0.25 | 6.95 | 3.96 |
| 7 | 172.107154167 | 58.5722750000 | 23.29 0.08 | 24.58 0.07 | 23.78 0.05 | 0.07 | 7.18 | 4.20 |
| 8 | 172.107204167 | 58.5726777778 | 21.36 0.03 | 22.57 0.03 | 21.82 0.03 | 0.00 | 7.18 | 4.92 |
| 9 | 172.109154167 | 58.5704083333 | 24.97 0.18 | 25.23 0.10 | 24.38 0.07 | 0.63 | 8.30 | 5.29 |
| 10 | 172.109408333 | 58.5703333333 | 23.59 0.09 | 24.87 0.09 | 23.88 0.06 | 0.13 | 6.95 | 3.93 |
| Notes. Column 1: source identification; Columns 2 & 3: right ascencion & declination in J2000 coordinates; Columns 4 6: Vega-based apparent magnitudes with their uncertainties in , and -band, respectively; Column 7: the resulting extinction value; Columns 8 & 9: the cluster age and mass in logarithmic base. | ||||||||
3.4 Comparisons with other catalogues
The number of the optically-selected SSC candidates is quite high compared to that recovered by Randriamanakoto et al. (2013b) in their -band AO images. Different selection methods and a larger FoV but especially, the capability of the WFC3/UVIS camera to deliver sharper images enabled many more objects to be detected. The observed characteristics of the -band star clusters are discussed in Section 6.7.
Previous works by Vavilkin (2011) and Linden et al. (2017) have used WFC/ACS images (PI: Evans) in their star cluster analyses. The latter combined their optical data with small FoV far-UV images (a field 35 times smaller than that imaged by WFC3/UVIS camera) and hence, only generated a cross-matched catalogue of 53 candidates with a Vega-magnitude range of mag in the -band. A further comparison of the cluster ages and masses will be done after performing spectral energy distribution (SED) fitting as described in Section 4.
Our -band cross-matched catalogue is composed of 1646 cluster candidates with mag. The data are consistent with the detection and photometry algorithms of 1321 sources derived by Vavilkin (2011) which only use these two filters in their work. The high quality data from the UVIS camera, however, include more cluster detection at fainter magnitude levels as expected. Table 4 summarizes comparison between the two datasets: the magnitude ranges (assuming Mpc) are in agreement within the cluster photometric uncertainties.
| Instrument | Pix.scale | Nb.SSCs | F438W | Reference |
| (arcsec) | () | (mag) | ||
| (1) | (2) | (3) | (4) | (5) |
| WFC/ACS | 0.05 | 1321 | -15.6 | Valvikin11 |
| WFC3/UVIS | 0.04 | 1646 | -15.2 | This work |
| Notes. Column 1: HST instrument used; Column 2: the camera plate scale; Column 3: the number of SSCs with mag by cross-matching - and -band catalogues; Column 4: the -band magnitude of the brightest star cluster; Column 5: reference from literature. | ||||
4 The cluster age and mass fitting
To derive the star cluster properties of Arp 299, we fit our -band photometric catalogue to one of the most up-to-date SSP models: Yggdrasil by Zackrisson et al. (2011). Such models are already used extensively in the study of YMCs to output reliable fits of their ages and extinction (e.g Bastian et al., 2012; Ryon et al., 2014; Adamo et al., 2015; Hollyhead et al., 2016; Messa et al., 2018). In contrast to the well-known Starburst99 (SB99) code by Leitherer et al. (1999, 2014), Yggdrasil has options to define the gas covering factor, , at low and indermediate redshifts to model unresolved stellar populations like galaxies or star clusters. The treatment of photoionized gas from nebular emission and continuum is crucial to output robust physical properties of the very young stellar clusters.
In this work, the models were retrieved assuming an instantaneous burst, a solar metallicity, a Kroupa IMF, and a Padova-AGB stellar evolutionary model. With a factor of and a low redshift coverage, the evolutionary track has an age range between 1 Myr and 10 Gyr. A metallicity of (i.e. Solar) was chosen to align with the SALT/RSS444The Robert Stobie Spectograph (RSS) is a spectrograph mounted on the 10-meter class Southern African Large Telescope (SALT). spectroscopic analyses of the SUNBIRD sample, which show typically such metallicities (Ramphul & Väisänen, private communication). Finally, a starburst attenuation curve was adopted to estimate the extinction coefficient of each filter (, Calzetti et al. 2000).
Note, however, that using appropriate SSP models alone is not enough to estimate values of the cluster age and mass. We therefore constructed an extinction map of the galactic field (see Section 4.1) in order to apply constraints on the extinction range prior to minimization. The fitting algorithm is expressed as follows:
| (2) |
where -band, and are respectively the observed and the synthetic magnitudes while is a normalization factor.
4.1 Constraining the extinction ranges
For each cluster to have its own range of extinction as an input to the fitting, an extinction map of Arp 299 was produced based on a smoothed background version of a broad-band color map as displayed in Fig. 5. An intrinsic color of mag to the starburst galaxy (Kinney et al., 1996) at a zeroth-order approximation along with a starburst attenuation law were adopted. Based on the derived map, high extinction values of mag are associated with the nuclear starburst regions of the galaxies: 3.8 mag and 3.6 mag in the case of NGC 3690E and NGC 3690W, respectively. Alonso-Herrero et al. (2000) reported similar extinction ranges using optical spectroscopy. They also estimated the extinction to the gas in the nuclei with NIR HST/NICMOS observations and by using an aperture of 2 by 2 arcsec, they found the following ranges: mag for NGC 3690E and mag for NGC 3690W. The higher extinction range in the case of NGC 3690E is expected because estimates from optical data usually reflect the dust screen only. Measurements based on NIR observations, however, probe deeper into the interstellar medium. These comparisons demonstrate that our derived extinction map should provide at least a crude approximation to the extinction of the cluster.
An area of 5 by 5 pixels centered at the spatial coordinates of any given SSC was used to calculate an average value for its initial extinction estimate. The cluster’s range of extinction for the SED fitting was then defined as follows:
| (3) |
| (4) |
The higher the value of the initial extinction is, the wider the range in which can vary. This is to ensure that is optimally used to constrain each cluster’s range of extinction. Such constraints are essential and they were all suitably chosen after comparing the derived cluster ages output from different sets of extinction ranges. In fact, we performed the following tests:
-
1.
by estimating the resulting extinctions and ages of datasets associated with less patchy dust distributions ( mag). These are expected to be young objects ( Myr) which are almost free of dust based on their colors. We varied the range of extinction between mag, then mag, and finally mag while performing the SED fitting. Results from all three sets are similar and consistent with the distribution of the datapoints in the color-color plots (see Section 5). Adopting a range of for star clusters with mag is therefore reasonable and hence, was used to derive the final results;
-
2.
by considering objects with relatively high initial extinctions of . Based on their positions in the color-color plots, the datasets either represent highly extinguished young clusters or old clusters with low extinction values. This degeneracy between age and extinction should be reduced once UV-data is incorporated. Various ranges were again used for comparison, i.e. where mag. The fitted results are generally consistent with the prediction, regardless of the extinction ranges;
-
3.
by adopting a range of for the whole catalogue, where . Compared with the results from the previous methods, we find that around 58 - 71 percent of the clusters have similar ages within 0.25 - 0.5 dex. Such a percentage is expected since the constraints on are only governed by the maximum extinction value associated with the nuclear regions.
Based on the results from these tests, the chosen values of in Eq. 4 are therefore expected to output reliable estimates of the star cluster properties.
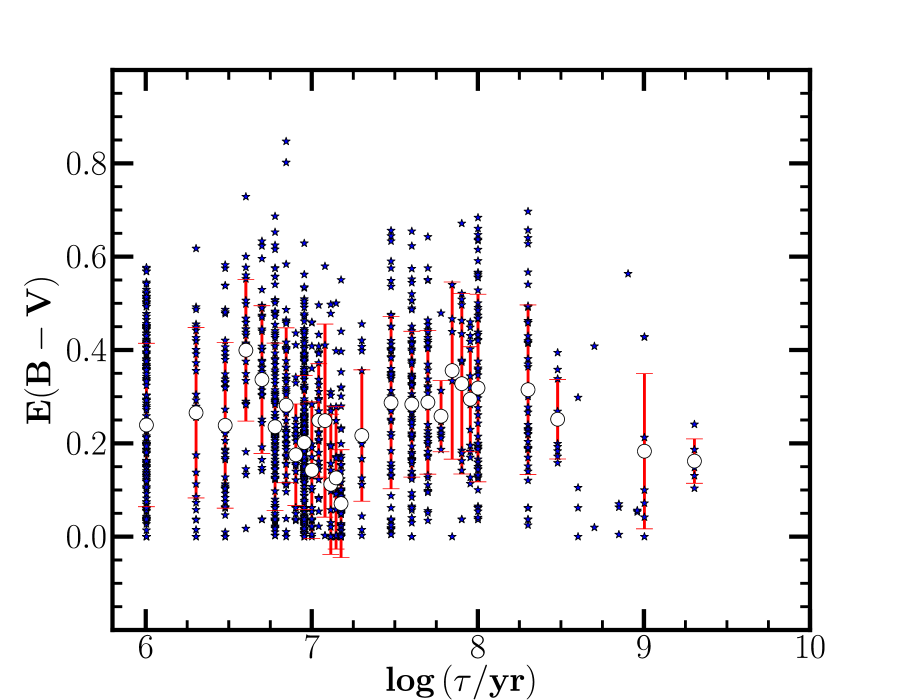
We should also note that the use of the extinction map does not bias our results: i) we constructed an extinction map based on a color and then derived the corresponding value of each cluster. The estimated ages were compared with results considering color map. We find that 80 percent of the clusters have similar ages within 0.5 dex. SED fitting that consider retrieved from a color map output clusters with slightly older ages as expected; ii) we also varied between the initial extinction estimates derived from the and color maps. We find that about 70 - 90 percent of the clusters have similar ages within 0.25 - 0.5 dex compared with results using color map. These tests emphasize the fact that the color map used to constrain the extinction does not bias the derived properties of the clusters. In addition, as shown in Fig. 6, where the open circles represent the mean extinction values at each age step, there is no clear correlation between the derived extinction and the cluster age. The cluster mass, however, increases with an increasing extinction. This is expected since highly extinguished nuclear regions are reported to be potential birthsites of the very massive star cluster candidates (see Section 6.1).
|
|
4.2 The resulting properties of the star clusters
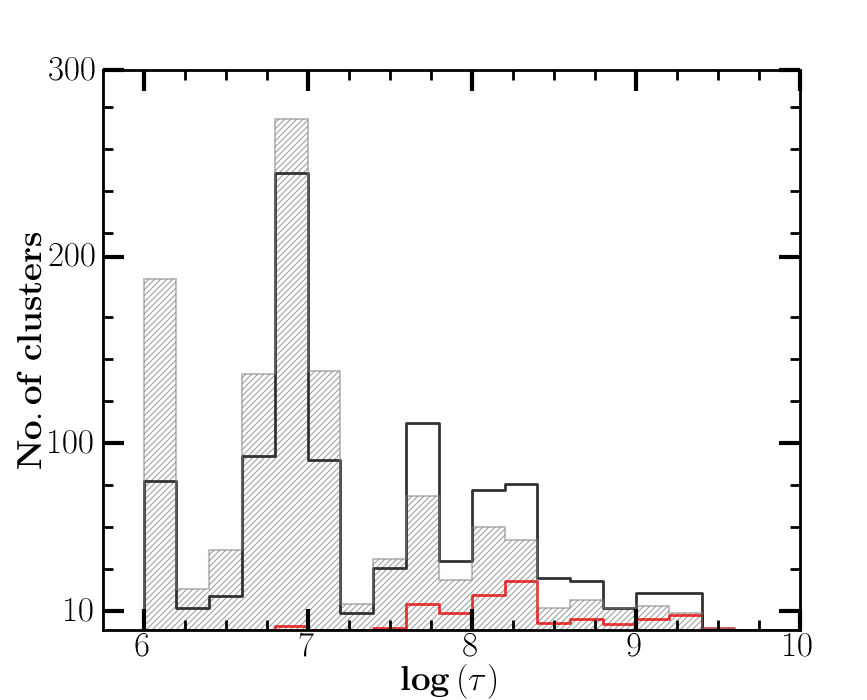
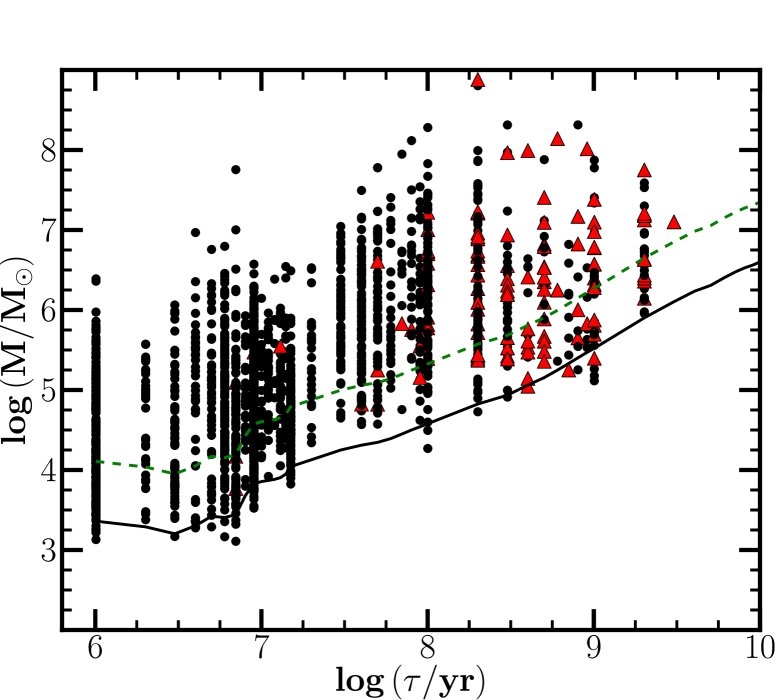
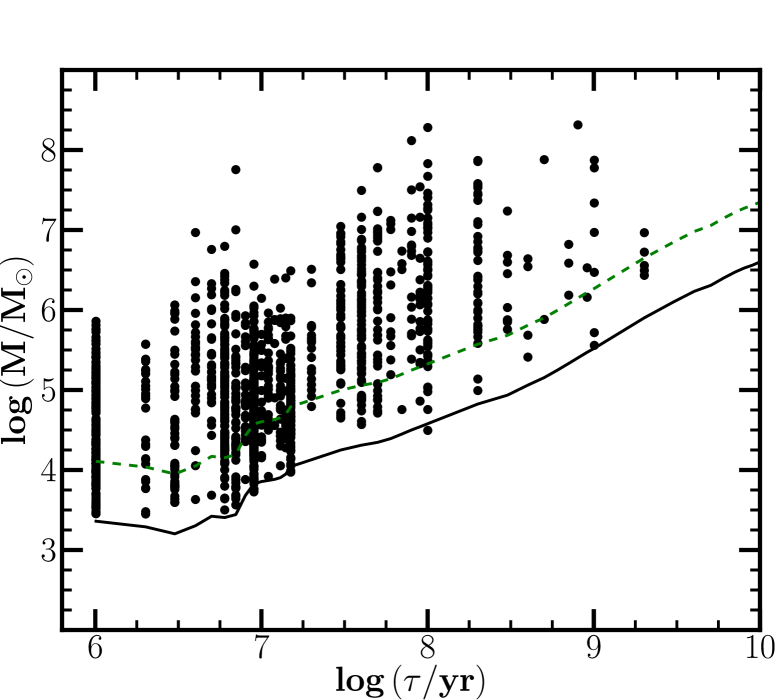
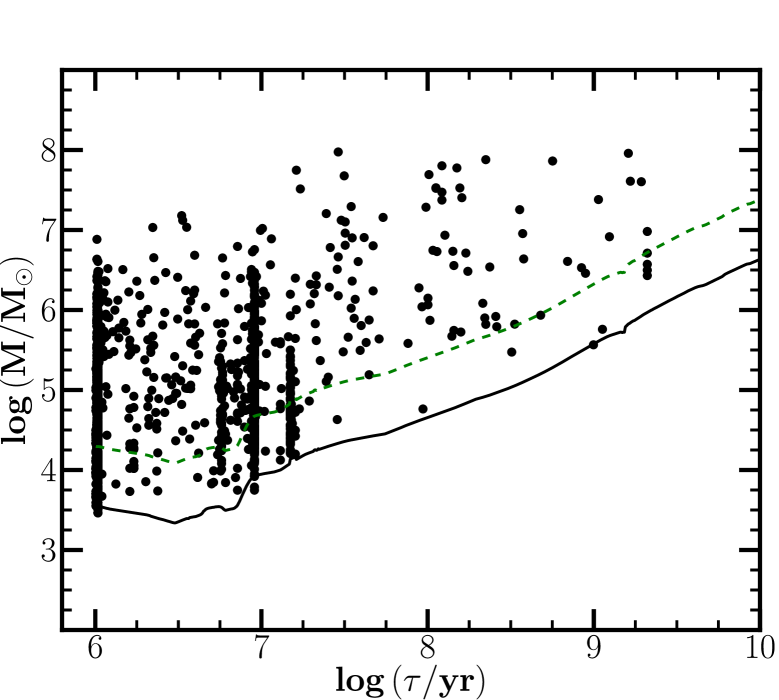
Outputs from our -fit indicate that Arp 299 hosts a very young population of star clusters: 62 percent of the SSCs have ages Myr old. The upper panel of Fig. 7 overplots the number of star clusters found per age bin in NGC 3690E (black solid line) and NGC 3690W (hatched) where 60 percent of the SSCs in the western component are younger than Myr old. Figure 8, on the other hand, shows the resulting distributions in the age-mass plane, considering all candidates (top panel) and those with high confidence photometry only (bottom). Clusters with 0.50 mag are labelled as red triangles. They are mostly old SSCs with Myr which are consistent with their -band magnitude errors. The solid and dashed lines represent the evolutionary fading of the SSP models associated with 80 percent completeness limits for the outer ( mag) and inner regions ( mag), respectively. Concentrations, referred to as ‟chimneys˝, are present at ages around 1, 10, 50 and 200 Myr. Poor fitting of the youngest star clusters explains the chimney at log 6 which corresponds to the lower age limit of the SSP models. Concentrations at log 7 and log 8.3 also exist because red super giants (RSGs) and asymptotic-giant branch stars of the star clusters become apparent at these ages, respectively (e.g Bastian et al., 2005; de Grijs et al., 2013). The real age-mass distribution is thus believed to spread into a wider range at these ages. The peak at log 7.7 for both components, however, should be investigated further. Could it be a signature of a past episode of intense star formation in the interacting system? Section 6.2.2 reports possible explanations of the trend.
SSC masses lie in the range of . Even though chimneys exist in age modelling, the mass of the clusters is much less affected by those uncertainties. Furthermore, the trends seen in Fig. 8 clearly demonstrate that the population of star clusters decrease with time because of various cluster disruption mechanisms (e.g. Bik et al., 2003). Nevertheless, SSCs with a derived mass below may be affected by stochastic effects while some datapoints with (red distributions in Fig. 7) could be complexes of star clusters and hence, are analysed separately in Section 6.4.1.
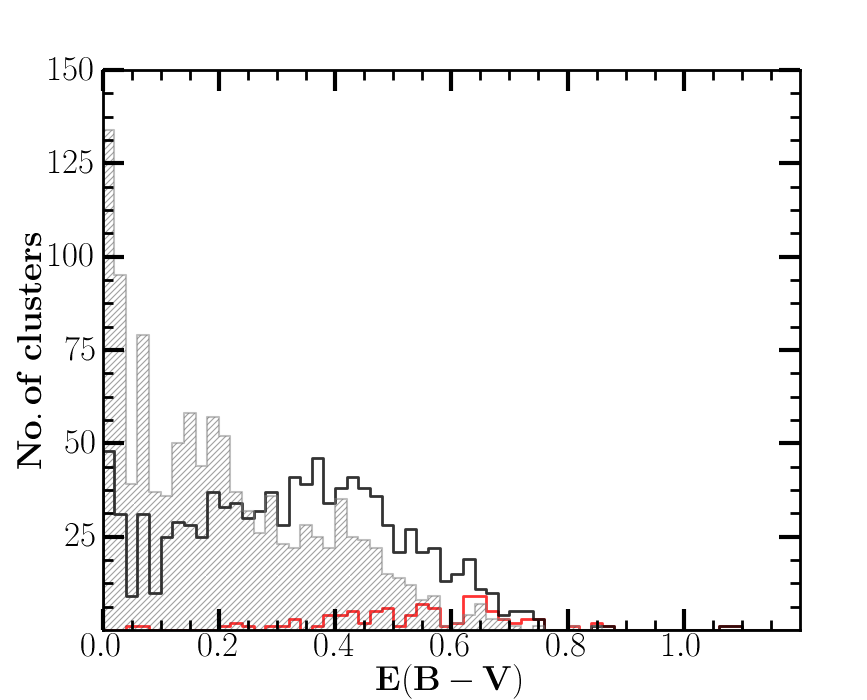
The lower panel of Fig. 7 shows the resulting extinction distributions: the visual extinction of the star clusters varies between 0 to 4.5 mag, i.e. . NGC 3690W (hatched) has a significant number of star clusters with a low extinction value of compared to the population of SSCs in NGC 3690E (black solid line). This is not surprising since Fig. 5 shows that NGC 3690W has a much larger white area (indicating ) than NGC 3690E.
4.3 Consistency checks
At least four filters, covering a large broad-band that includes Balmer lines, are usually to be considered to secure SED fitting results with a high precision (Anders et al., 2004). Nevertheless, minimization using three filters only should be reliable if an UV-filter is included to break the cluster age-extinction degeneracy, especially if constraints are applied on the extinction and metallicity. To assess the robustness of our results, various sanity checks were performed by only considering sources with low photometric uncertainties (i.e. mag).
4.3.1 SED fitting using SB99
We performed SED fitting of the observed data with SB99 for comparison: the SSP models tend to output clusters of younger ages (see Fig. A.1 in the Appendix). In fact, half of the population are younger than 5 Myr old while the number of clusters with ages between 10 and 100 Myr double-up when using Yggdrasil SSP models. The distribution in the age-mass plane is shown in Fig. 9: the resulting ages from SB99 mostly converge and form more pronounced chimneys at log and log . This is in contrast to the trend seen in Fig. 8 where the ages from Yggdrasil spread into a wider time interval (despite the presence of chimneys). One main reason of the discrepancies is that SB99 models do not account for the effects of nebular emission and hence do a poor fitting of the emission lines. We therefore chose not to use the results from SB99 but rather focused our analyses based on the physical properties derived with Yggdrasil.
4.3.2 Comparison with Linden age results
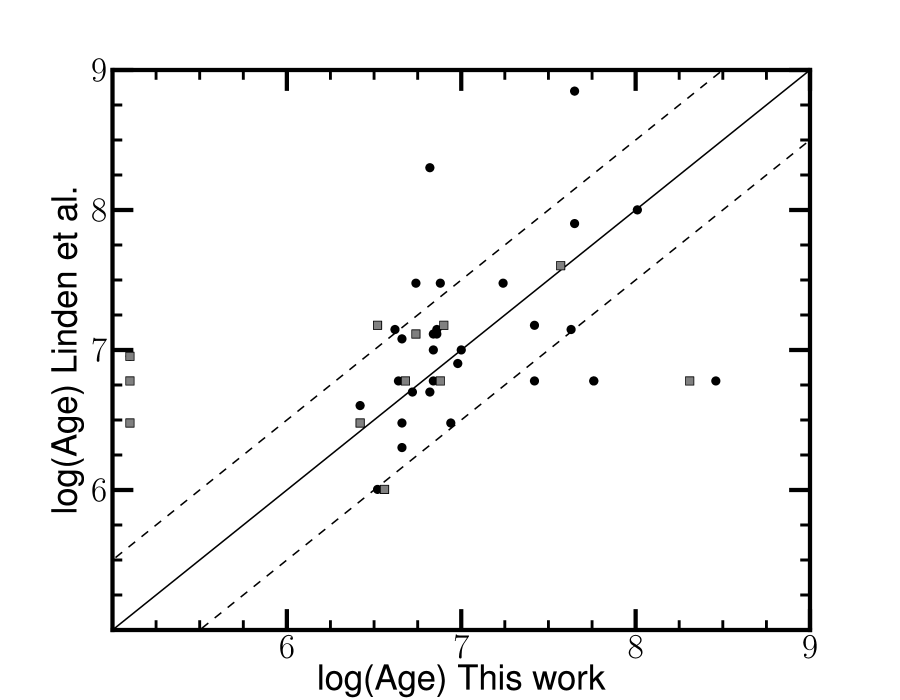
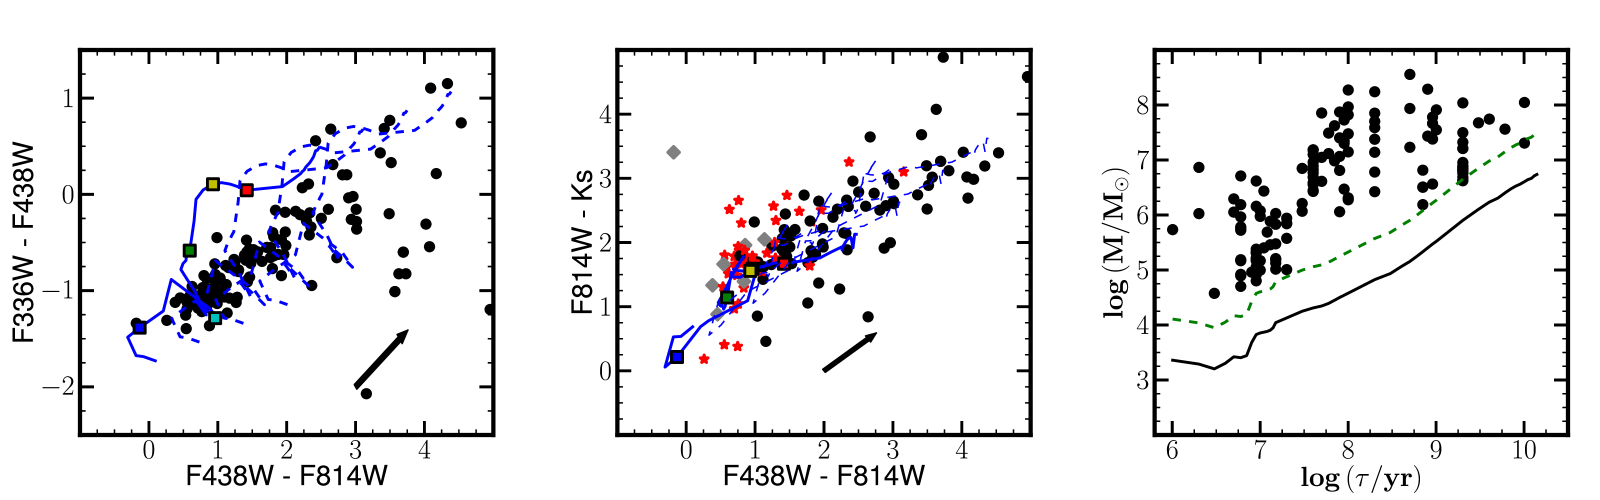
As already mentioned in Section 3.4, Linden et al. (2017) have studied the physical properties of 53 SSC candidates using WFC/ACS and far-UV images. Figure 10 compares the derived ages in this work with the ones from Linden et al. (2017) who considered GALAXEV555GALAXEV is a library of SSP models built from the isochrone synthesis code of Bruzual & Charlot (2003).. A match radius of 0.1 arcsec was adopted to recover 43 common sources: the black circles denote sources identified within 0.01 arcsec, whereas the other sources are labelled as grey squares. Our results are in agreement with the values found by Linden et al. (2017): approximately 72 percent of the matched sources are consistent in their ages within 0.5 dex. This work also generates less massive clusters (see Fig. A.2). Contamination is expected to affect more the Linden catalogue since it was drawn from WFC/ACS datasets with a slightly coarser pixel scale of 0.05 arcsec/pixel.
5 The color diagrams
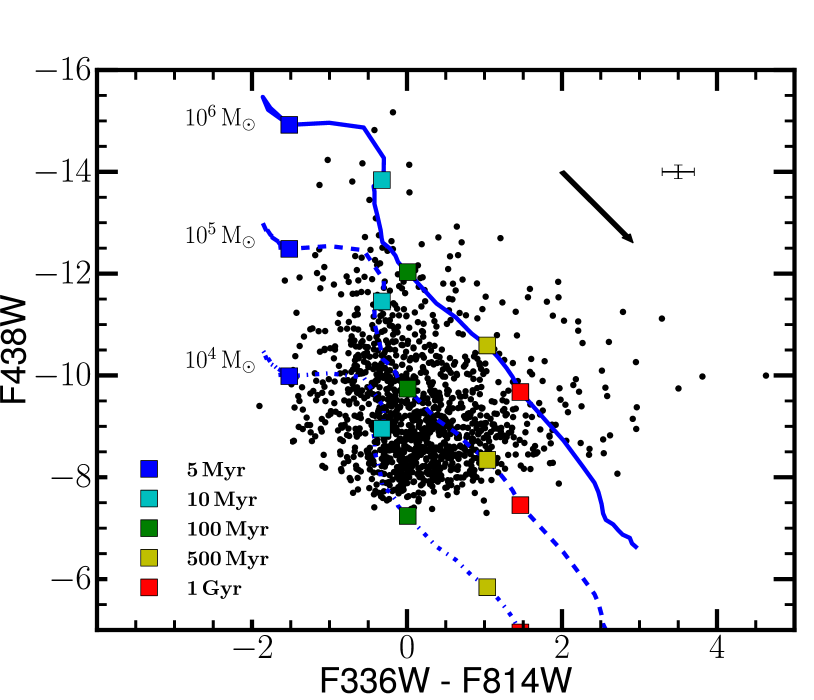
The color-magnitude diagram (CMD) and the color-color diagram (CCD) for SSCs with mag are respectively presented in the upper and lower panels of Fig. 11. The solid and dashed lines denote Yggdrasil models where different ages of the synthetic cluster are marked with multicolor squares in the evolutionary track. The distribution of the datapoints in the CMD indicates that a significant number of the SSCs are predicted to have masses between . This is in agreement with our results where 88 percent of the clusters have derived masses within that range.
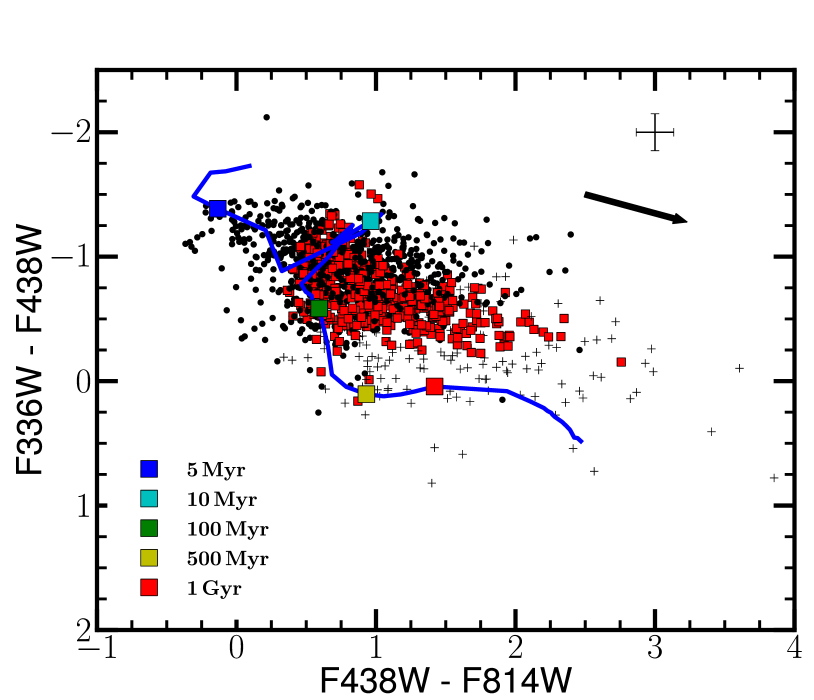
The CCD suggests that the merging system mainly hosts young SSCs. Since the cluster population is concentrated in the field that corresponds to Myr of the evolutionary track, most of the sources are likely to be associated with ages younger than 100 Myr old. Again, such predictions are consistent with the results reported in Section 4.2. The cluster age distribution in the CCD can clearly be seen by color-coding each datapoint as follows. Black circles, red squares and black crosses correspond to Myr, ages between Myr, and Myr, respectively.
|
|
6 Interpreting the YMC properties
6.1 Investigating the cluster spatial distributions
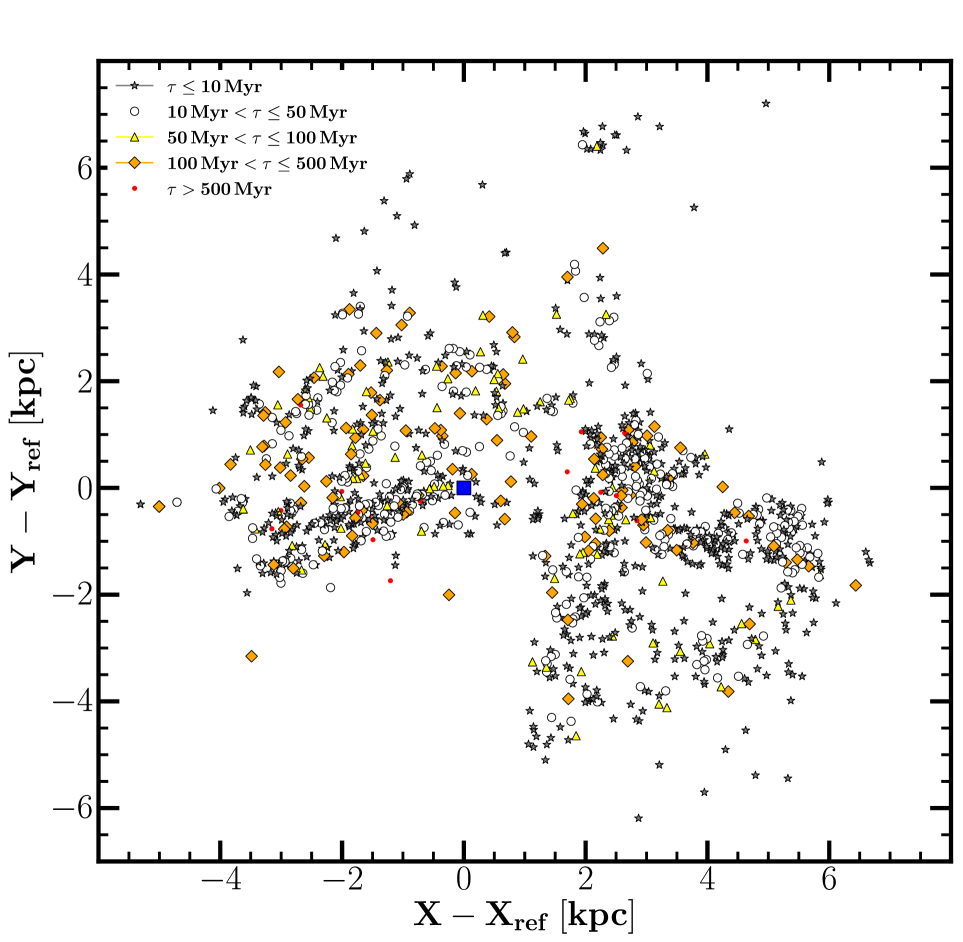
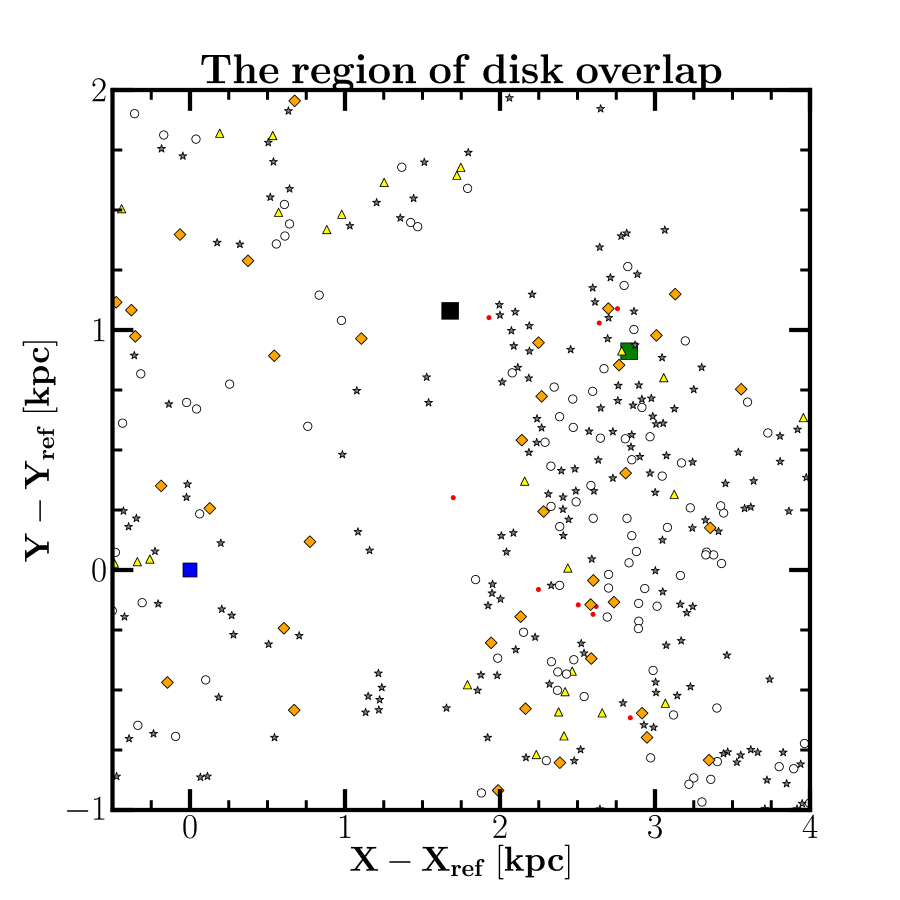
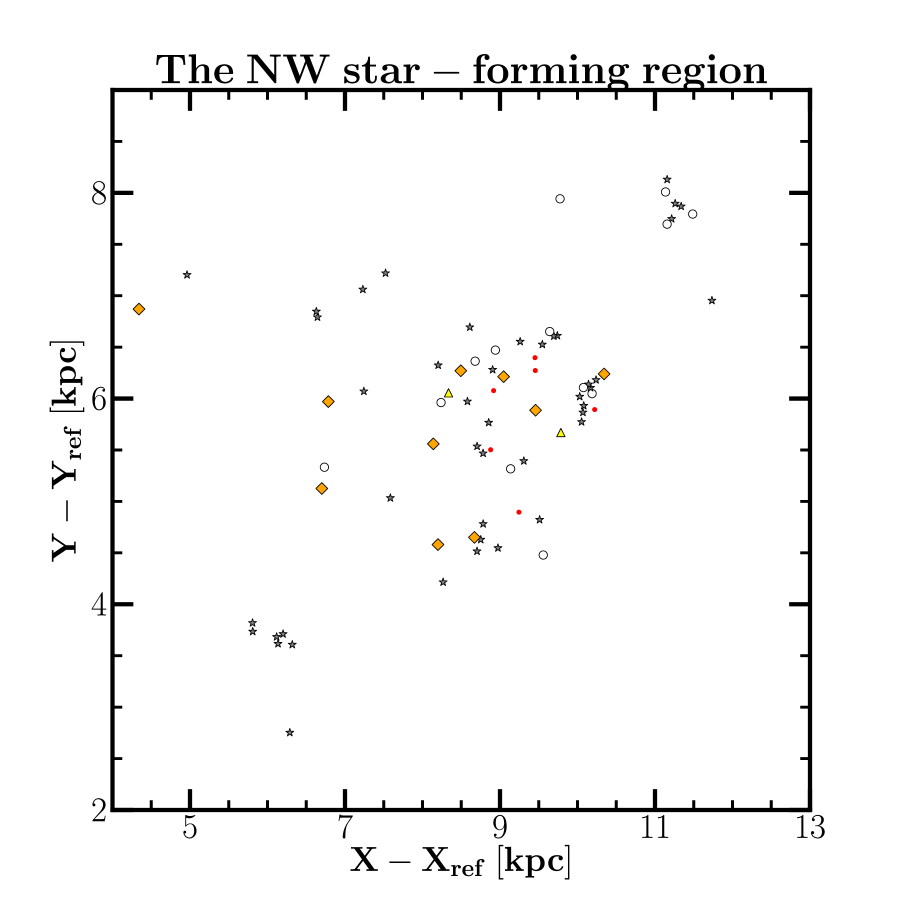
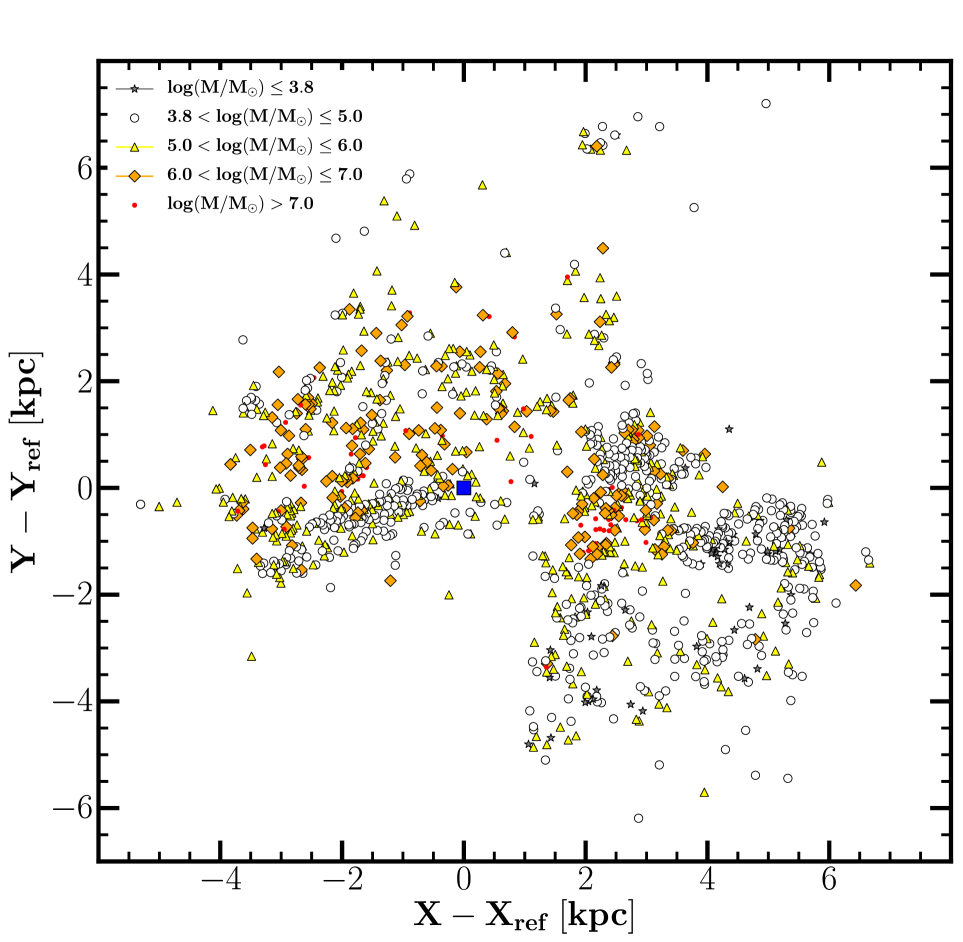
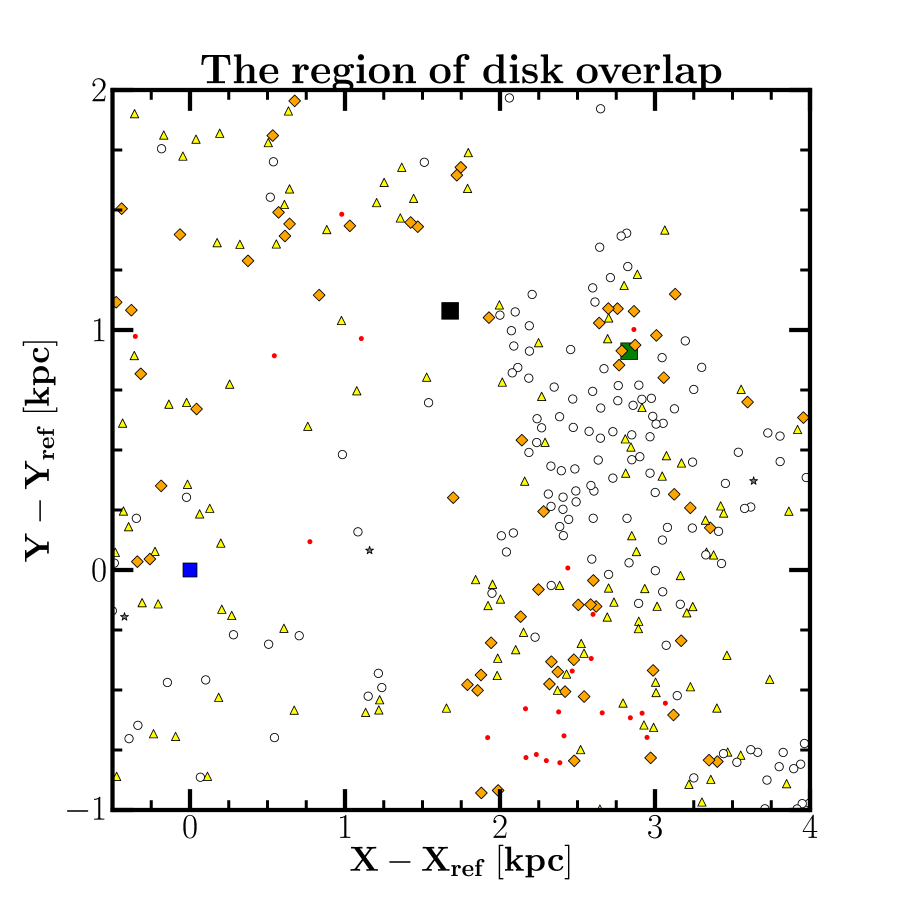
Figure 12, Fig. 13 and Fig. 14 display the spatial distributions of the SSCs split into different age, mass and extinction bins, respectively. Only clusters with high confidence photometry are included for clarity. The blue square denotes the intersection of the distance between the two galaxy nuclei with the boundary line used to separate their YMC catalogues. Insets in the lower panel zoom two regions of the interacting system: the disk overlap region (left) and the northwest star forming region (right). The latter is analysed further in Section 6.8.
|
|
|
|

|
|
In the case of Fig. 12, different age bins tend to overlap spatially. Such a random distribution may be an imprint of ongoing cluster migration due to the strong tidal shocks generated through the merging of NGC 3690E with NGC 3690W. Nevertheless, the region of disk overlap as well as the southern spiral arm of NGC 3690E host a siginificant number of clusters younger than 50 Myr, some of them as young as Myr. This is consistent with the mid-IR spectral features of these star-forming regions which also host supergiant HII regions (Alonso-Herrero et al., 2000; Alonso-Herrero et al., 2009).
In contrast, a clear pattern is observed in the spatial distribution of the cluster population with respect to their masses. YMCs with masses tend to be located near the galaxy nuclei but as we move away from the inner regions, we start to observe the less massive cluster candidates. Though detection of the faint and low-mass clusters is likely to be affected by the relatively high-background of the nuclear regions, such a pattern is also in agreement with Sargent & Scoville (1991) previous findings: they have recorded large quantities of dense molecular gas in the inner field of Arp 299. Such a concentration is reported to be an ideal birthsite of the very massive YMCs. Simulations by Barnes & Hernquist (1996) also predict that collisions between gas-rich galaxies displace significant amounts of molecular gas into the nuclear regions of the interacting Arp 299.
Finally, the southeast spiral arm of NGC 3690E, the disk overlap region as well as the HII regions northwest of NGC 3690W are populated by SSCs with relatively low visual extinction, i.e. . A significant number of these clusters have ages between Myr old. They survived the gas expulsion phase where the surrounding dust and ionized gas have been blown away, thus allowing them to become optically visible. The majority of the most extinguished star clusters, however, are within the obscured nuclear starburst regions. Such a distribution is consistent with the properties of the derived extinction map in Fig. 5.
|
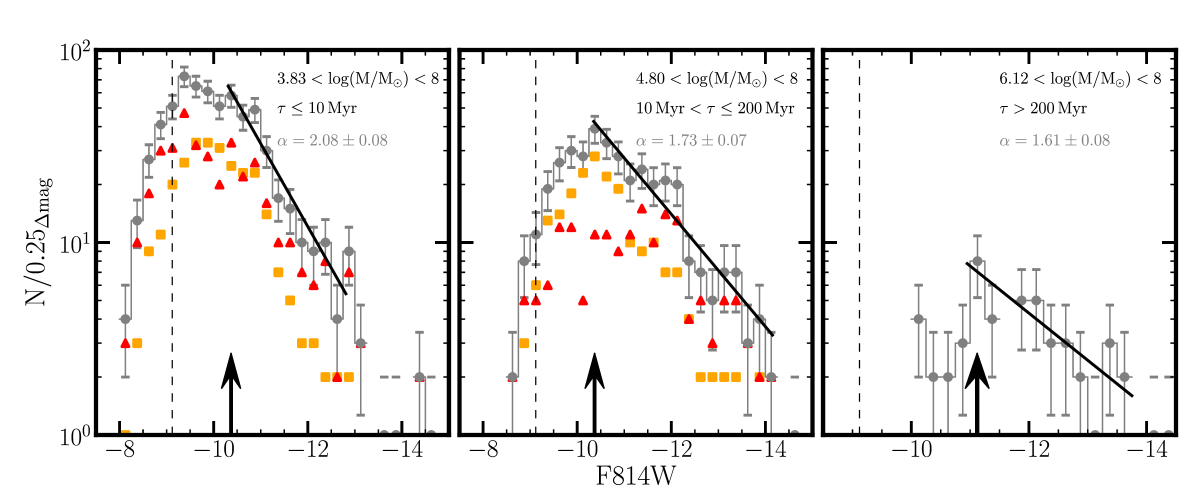
6.2 Age distributions of the star clusters
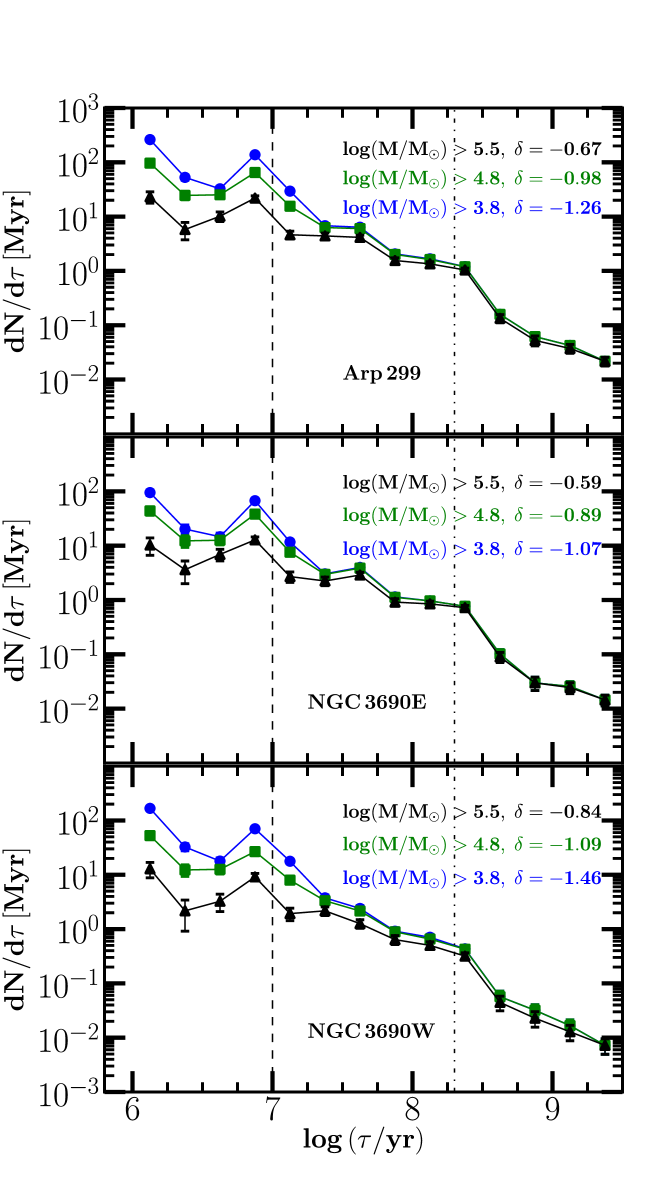
Figure 15 shows the number of clusters per time interval with the data binned by 0.25 in log. The upper panel depicts the dN/d shape for the entire system of Arp 299. The middle and bottom panels represent the age distributions for NGC 3690E and NGC 3690W, respectively. Lower mass limits of (blue circles), (green squares), and (black triangles) were adopted to establish cluster formation rates of three different mass-limited catalogues. Dashed and dotted-dashed vertical lines mark the timescale at 10 Myr and 200 Myr, respectively.
6.2.1 Star cluster evolution during the first 10 Myr
For clusters younger than log, the sample is complete down to a mass cutoff of . By omitting the peak around log , the age distribution rapidly decreases by dex during this first 10 Myr of the cluster lifetime. This trend reflects the impact of gas expulsion (infant mortality, Lada & Lada 2003) combined with any contamination from gravitationally unbound associations (Gieles & Portegies Zwart, 2011). The bump is ignored as it is less likely to be real due to the appearance of RSGs around that timescale. We also notice that an increase in the value of the lower mass limit results in a flatter distribution of the CFR. Mass-limited catalogues should be interpreted carefully since there is a trade-off between excluding less massive clusters and analysing a complete sample for a certain age range. Nevertheless, the flat distribution may also indicate that SSCs with masses are less affected by the early disruption mechanisms of the embedded phase.
Figure 15 also suggests that the CFR has increased continuously over the last Myr. With a current high SFR of 86 (Herrero-Illana et al., 2017), the merging process between NGC 3690E and NGC 3690W keeps inducing violent and extreme starburst episodes. It is thus highly probable that both cluster and star formation rates will gradually increase as the two galaxies collide (Bastian et al., 2009).
6.2.2 dN/d analysis of the 10 - 200 Myr age range
We have a complete sample between by applying a mass cutoff of to the catalogue. There is a weak peak around log ( Myr) that persists even when we vary the logarithmic age-binning or we use variable-size bins recommended by Maíz Apellániz & Úbeda (2005) to draw the age distributions. The upper panel of Fig. 7 exhibits the same trend around that age. The bump is mostly prominent in the dN/d distribution of NGC 3690E and could be the imprint of an intense starburst activity that may have occured 50 Myr ago. Such a value is consistent with the starburst ages derived by Mattila et al. (2012) from the SED fits for Arp 299: 45 Myr and 55 Myr for NGC 3690E and NGC 3690W, respectively. A close encounter between the galaxy pairs of the merging system could have displaced/disturbed a large amount of gas and dust and thus had favored the formation of YMCs. Nevertheless, Bastian et al. (2005) cautioned that SED fitting models adopted to output the cluster ages can also introduce artefacts in the age distributions of the clusters. We should therefore consider studying the kinematics of gas and dust of Arp 299 over its lifetime to further investigate the origin of such a peak.
The sample is likely to be free of gravitationally unbound systems above 10 Myr (Adamo et al. 2015). Hence, a power-law fit should help in accurately deriving the cluster dissolution rate. The values of as a function of the mass-limited samples are given in the legend of each panel in Fig.15. We focus our analysis using the high mass cutoff of to avoid completeness bias introduced by SSCs from the inner regions (see the dashed line in Fig. 8). The slopes are respectively equal to and in the case of NGC 3690E and NGC 3690W. By adopting a variable binning, the values of are and , respectively. We record by considering the whole system. Such values are consistent with those of Silva-Villa & Larsen (2011) and Silva-Villa et al. (2014) who also considered mass-limited samples but with a slightly longer time interval (). The steeper age distribution of the western component suggests that its cluster population endures stronger disruption mechanisms than the YMCs hosted by NGC 3690E. Studies of the CLFs/CMFs will be used for consistency checks.
6.2.3 A rapid decline after 200 Myr
Apart from the significant evolutionary fading of old clusters, observational incompleteness becomes an issue at older ages (e.g. Baumgardt et al., 2013; Adamo & Bastian, 2018). The rapid decline just after 200 Myr is thus not surprising and most probably independent of the environment. This is the reason why we decided not to fit a power-law to the overall age distribution but rather restricted our analysis to the Myr time interval.
6.3 -band cluster luminosity functions
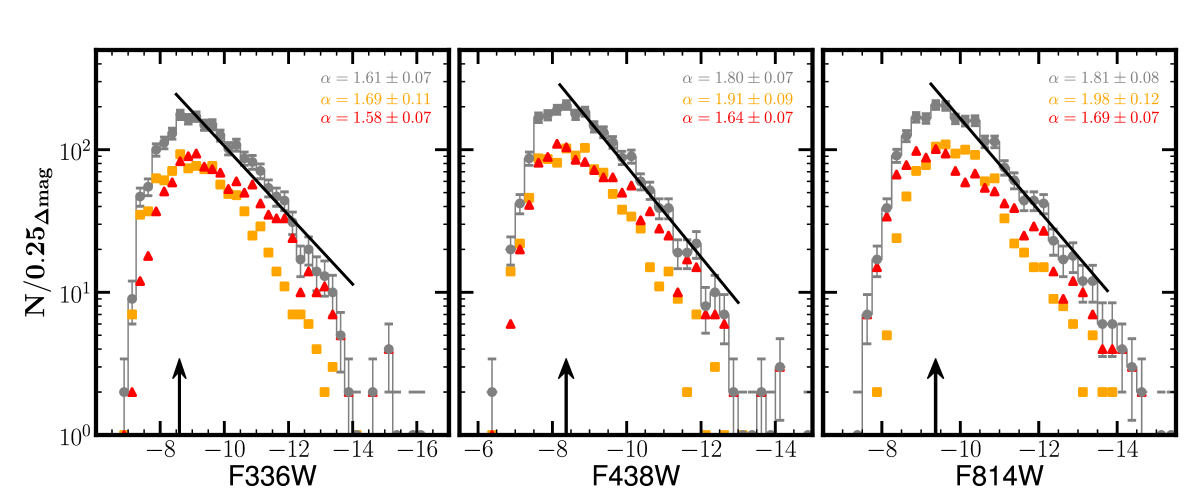
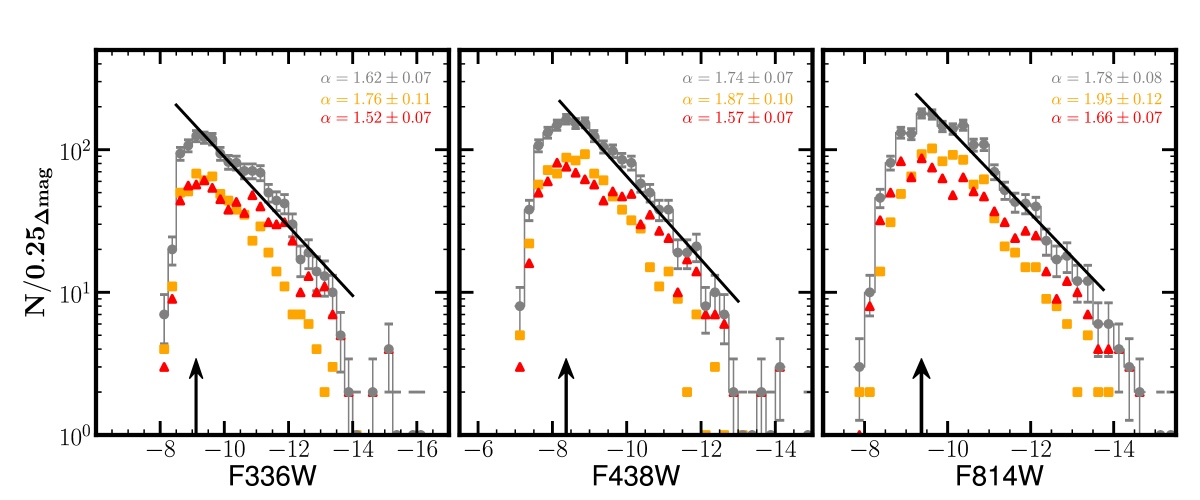
Before analysing the CMFs, we first derive the associated -band CLFs using a constant bin size. We fit a power-law function of the form to the data, where is the power-law slope. Figure 16 plots the derived -band (left), -band (middle) and -band (right) CLFs of Arp 299. Top panels use all candidates in the cross-matched catalogue (i.e. 2182 sources), whereas the bottom ones consider 1318 (), 1680 (), 1763 () selected sources with mag and masses in each filter. With such robust criteria, photometric biases and stochastic fluctuations should not affect the second set of the luminosity functions. Grey circles, orange squares, and red triangles were used to draw the CLFs of Arp 299, NGC 3690E and NGC 3690W, respectively. The vertical arrows indicate a certain magnitude limit referred to as critical magnitude or where we only fit the clusters with bright luminosities up to that magnitude. Such a parameter corresponds to the bin before which the faint-end of the CLF starts to flatten or to exhibit a steep drop. The fitted power-law functions of the interacting system are represented by the black solid lines.
In all three filters, the CLFs of Arp 299 generally follow a single power-law distribution with slopes below , ranging between . Using a variable bin size, such a range becomes which implies that the choice of binning does not introduce bias. By investigating the effect of binning, we also recorded different values of the critical magnitudes. A variation in the values of only changes the slope by . In addition, the values of from the two sets of CLFs (top vs. bottom panel of Fig. 16) are similar within their uncertainties: e.g. (cross-matched sources) vs. (-band selected SSCs) in the -band. The interacting LIRG thus has flatter indices than the average slope associated with normal spiral galaxies (, see e.g. Whitmore et al., 2014). Randriamanakoto et al. (2013b) ruled out resolution effects for galaxies with distances below 100 Mpc. They suggested that a smaller value of the index could result from a mass and/or environment-dependent disruption hapenning within the galactic field of strongly star-forming galaxies such as LIRGs. Recent analyses by Cook et al. (2016) support such arguments; they reported a tight correlation between the galaxy environment and the power-law slopes of star-forming regions.
Comparisons between the CLFs of the two galaxy components indicate that:
- 1.
-
2.
regardless of the filter used, NGC 3690W CLFs exhibit either a bend/truncation or a flattening below . Such results are consistent with the steep age distribution in Section 6.2. Observational incompleteness alone cannot explain such a behaviour since the effects should be negligible on the data with magnitudes brighter than . Could it be an imprint of a mass/environment-dependent disruption?
-
3.
NGC 3690E is mostly fitted with a function of steeper slopes by in all filters. One cannot entirely associate a size-of-sample effect to the trends since there are relatively more YMCs in NGC 3690W than in the eastern component. Again, NGC 3690W may be enduring stronger disruption mechanisms than its companion (Haas et al., 2008).
Since clusters of different ages are binned together when constructing the LFs, analyses of the CMFs are crucial to investigate the possibility of mass/environment-dependent disruption events.
6.4 Cluster mass functions
6.4.1 Properties of the very massive SSC candidates
Both shape and slope of the CMF are governed by the cluster mass range. It is therefore crucial to determine whether most of the very massive SSC candidates are complexes or that the environment of the interacting system favors their formation. In the case of Arp 299, around 4 percent of the cluster population have masses . They are mainly located in the nuclear regions with more than half of the population hosted by NGC 3690E. Their positions in the CMD are consistent with the results from SED fitting; their ages are estimated to be older than 100 Myr with an age median of Myr. As already discussed in Section 6.1, Arp 299 has the potential to form massive SSCs in regions where dense molecular clouds are concentrated such as in the galaxy centers. Bastian et al. (2006) and Linden et al. (2017) also recorded star clusters with the same mass range. They suggested that the extreme star-forming environment offered by (interacting) LIRGs is the most likely interpretation. This is consistent with the results from recent simulations of the formation of massive star clusters in major mergers by Maji et al. (2017).
We conclude that the concentration of very massive star clusters in the nuclear regions of Arp 299 is evidence for environmental dependence of the cluster formation and that most of these YMCs are less likely to be complexes. They could evolve to become present day globular clusters. Nevertheless, we apply an upper mass cutoff of to derive robust CMFs that should be free from blending effects. Three cluster candidates are excluded by setting the above criteria.
6.4.2 Constructing the CMFs
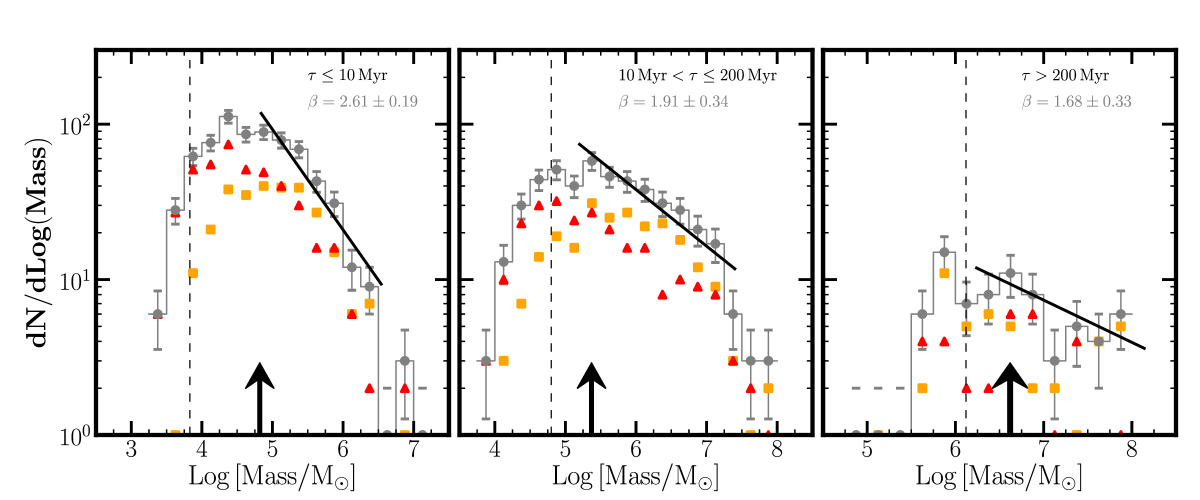
Figure 17 shows the resulting CMFs of Arp 299 (black points), NGC 3690E (blue squares), and NGC 3690W (green triangles) by considering only datapoints with mag and . The SSC catalogue was split in subsets as a function of the cluster ages for an optimal assessment of the mass distribution and hence a better understanding of the cluster disruption mechanisms. The age ranges are: Myr (left panel), Myr (middle), and Myr (right). The vertical lines mark approximate values of the cluster mass completeness limits using the age-mass diagram in Fig. 8. A power-law distribution of the form was fit to the CMF high-mass end until a critical mass , which is determined in a similar way as the critical magnitude in Section 6.3. The binning method defines the parameter and its value varies between log as we adopt different bin sizes or apply a variable binning when constructing the CMF with . The completeness limit, the values of and the slope at each time interval are listed in Table 5.
The mass distribution as well as the critical mass shift toward higher masses as we move to older age ranges because of evolutionary fading and size-of-sample effect (Hunter et al., 2003). As for the power-law slopes, they become flatter with an increasing time interval: from , and in the case of Arp 299. Since is always more massive than the completeness limit, the flattening in the slope cannot be entirely associated with observational incompleteness; rapid dissolution of the less massive clusters () could be another reason (Boutloukos & Lamers, 2003; Lamers et al., 2005).
Finally, CMFs of Myr are suggestive of an underlying truncation/turnover at high mass end and could be potentially fit by a broken power-law or a Schechter function. The mass distribution of NGC 3690W mostly deviates from a pure power-law function. In fact, the corresponding -band CLFs (i.e. splitting the catalogue as a function of the cluster ages) in Fig. A.3 show similar trends well above the detection limit at . The slopes also decrease with older ages: from . These results support the idea that a CLF is a mere reflection of the CMF (Gieles et al., 2006).
| Age range | Comp.lim | Nb.SSCs | |||||
|---|---|---|---|---|---|---|---|
| (Myr) | log() | () | log() | log() | |||
| (1) | (2) | (3) | (4) | (5) | (6) | (7) | (8) |
| 3.83 | 650 | 4.87 | 5.47 | 2.61 | 2.31 | 2.45 | |
| 4.80 | 377 | 5.37 | 6.19 | 1.91 | 1.84 | 1.97 | |
| 6.12 | 49 | 6.62 | - | 1.68 | 1.19 | 2.21 | |
| Notes. Column 1: SSC age range to construct the CMF; Column 2: completeness mass limit estimated from the age-mass diagram; Column 3: number of SSCs with a magnitude error mag within the time interval and above the mass limit; Column 4: critical cluster mass until which we performed the power-law fit; Column 5: Schechter characheristic/truncation mass; Columns : single power-law slopes of Arp 299, NGC 3690E and NGC 3690W, respectively. | |||||||
Further analyses of the CMFs for the Myr age range are done in Section 6.4.3 to check whether the truncation is a mere result of a size-of-sample effect or does involve any physical explanation. This time interval is very critical because the star cluster’s chance for a long-term survival after escaping infant mortality will be at play during this period. Moreover, MFs of the younger ages () could be contaminated by unresolved unbound stellar associations (Gieles & Portegies Zwart, 2011) while the ones with ages above 200 Myr are likely affected by fading and evaporation (Hunter et al., 2003).
6.4.3 Applying a Schechter fit to the MF
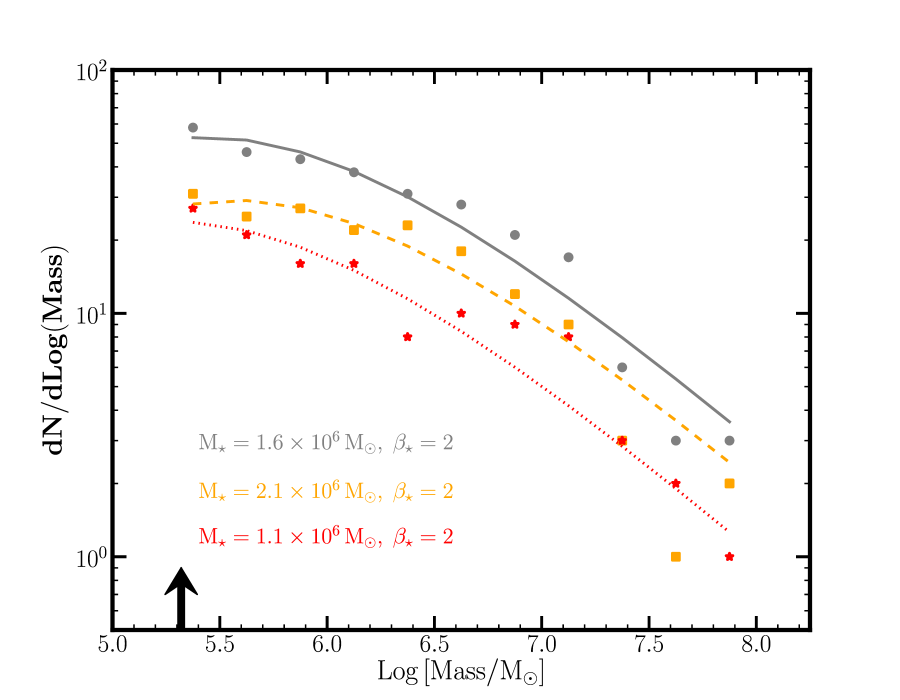
We also fit a Schechter distribution of faint-end slope to the CMF with ages between Myr old and masses above the critical mass of . Figure 18 shows the resulted fits overplotted on top of the datapoints. While the bend of a Schechter function occurs around for normal spiral galaxies (Larsen, 2009), a more massive truncation mass close to is required for starbursts and merger galaxies such as LIRGs (e.g. Bastian, 2008; Linden et al., 2017). This is consistent with the values we record for Arp 299 (solid line) where . The varying truncation mass is thought to be governed by the local properties of the host environment and it has been reported to be directly linked with the SFR surface density (Adamo et al., 2015; Johnson et al., 2017). Schechter characteristic masses are and for NGC 3690E (dashed) and NGC 3690W (dotted), respectively. The relatively high of NGC 3690E compared to that of the western component is consistent with this galaxy hosting more than half of the very massive clusters of the system, although it may also result from the large concentration of high gas pressures in the environment of NGC 3690E.
6.4.4 Cluster mode of disruption in Arp 299
Features of the derived CMFs are in agreement with the cluster mass spatial distribution, the age distribution, and the luminosity functions. These tools denote at least a strong signature of an environmental dependence of the cluster mode of disruption. Further investigations are reported in Section 6.6. A mild mass-dependent disruption is also suggested. Such physical effects are indeed combined with internal effects from the cluster evolutionary processes such as infant mortality, evolutionary fading and evaporation.
The value of the power-law slope decreases by moving from the youngest age range to the 10 - 200 Myr time interval. The corresponding slopes of the -band CLFs (Fig. A.3) also differ by . Gieles (2009) interprets this decrease in the value of with an increasing age range as a signature of a mass-dependent disruption mechanism. In addition, a mass-dependent disruption time could also be the reason of the bend occuring at low masses of the CMFs since incompleteness bias is to be excluded. In other words, the cluster initial mass function defines the disruption time and hence the cluster survival chance. If not destroyed during infant mortality at early ages, low mass star clusters are likely to be vulnerable by disrupting faster in such a scenario (e.g. Lamers et al., 2005).
6.5 The cluster formation efficiency
In this work, a time interval Myr was chosen over the Myr range to estimate reliable cluster formation rate and cluster formation efficiency of Arp 299 (see Eq. 1). The inclusion of star clusters with ages Myr old certainly underestimates the value of because the YMCs could have already been affected by evolutionary processes. In addition, the star formation history over the past 50 Myr is best represented by the current SFR, especially in the case of systems with ongoing starbursts such as LIRGs (Kruijssen & Bastian, 2016). Nonetheless, we also estimated by adopting Myr for comparison. Only clusters with masses were considered when computing the total mass of clusters with ages within .
Apart from the difficulty to accurately define regions that belong to each galaxy component of Arp 299, it is also not trivial to estimate their SFR without introducing non-negligible uncertainties. Therefore, we decided to only derive the CFE of the whole system by considering a retrieved from the galaxy SED fitting performed by Herrero-Illana et al. (2017). For Myr, the value of percent. We did not use the SFR based on the galaxy infrared luminosity since both AGN and starburst activity contribute toward the total infrared luminosity and hence lead to an overestimate of the derived SFR. Such a bias is however taken into account during the SED modelling which output a SFR averaged over the past 50 Myr. Had we considered Myr, the value of becomes percent. This slightly lower percentage arises because of the disruption effects endured by the 50 - 100 Myr old clusters. Nevertheless, both values of are expected to slightly increase after correcting for biases such as incompleteness due to the missing mass from low mass star clusters.
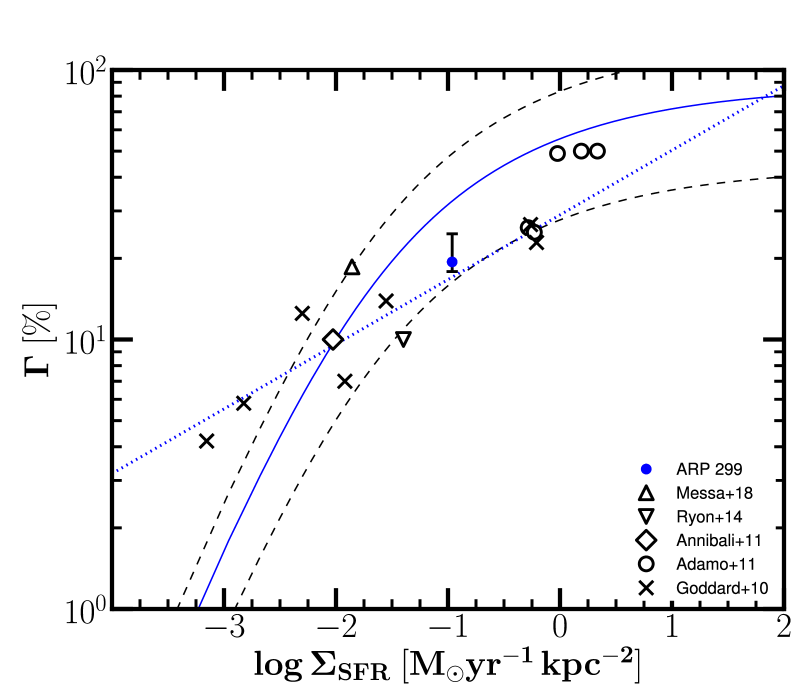
We also derived the SFR density as a function of the galaxy SFR being used and we get . A similar approach to Adamo et al. (2011) was adopted (plotting the galactic luminosity distribution as a function of the galactocentric radius) to estimate the projected area of the starburst regions enclosed within a 16 kpc radius. A version of the CFE - relation is presented in Fig. 19 where we plot results from this work (blue filled marker using ) with data taken from the literature (open markers). Our results agree with the power-law model suggested by Goddard et al. (2010). The blue point also lies within the 3 fiducial model of Kruijssen (2012).
In the case of Arp 299, the fiducial model predicts a theoretical cluster formation efficiency percent for the given value of . The incompleteness in the total mass contributes toward the discrepancy between the observed vs. theoretical results. Nevertheless, the observed CFE of Arp 299 is already times higher than the typical value of in gas-poor spiral galaxies such as NGC 2997 (Ryon et al., 2014) and NGC 4395 (Silva-Villa & Larsen, 2011). In fact, it is comparable with the mean CFE percent of the LIRG NGC 3256 and two blue compact galaxies with slightly higher (Goddard et al., 2010; Adamo et al., 2011). These are not surprising since extreme conditions necessary to form dense GMCs are easily met in the star-forming regions of interacting systems such as Arp 299 (e.g. Maji et al., 2017). Their high-pressure environments favor star formation to happen in bound stellar clusters. Our results thus provide further evidence that the CFE is a parameter dependent on the galactic environments (Goddard et al., 2010; Kruijssen, 2012; Adamo & Bastian, 2018).
6.6 Further analyses on the star cluster formation and disruption mechanisms
6.6.1 SSC properties in inner vs. outer field
Figure 20 shows different properties of the SSCs hosted by the inner (upper panel, black circles) and outer regions (lower panel, green stars) of the interacting system Arp 299. The color-color diagram (first column), the age-mass plane (second), the cluster age distribution (third) as well as the cluster mass function for the Myr age range (fourth column) are plotted for each field. We notice that the distributions are not the same but (slightly) change as a function of the varying background, especially in the case of the age-mass plane and the CMF:
-
1.
the color diagrams: the ranges of the and colors are generally similar for both regions. The median color labelled as a red square only shifts by 0.13 mag. Based on the CCDs, we cannot conclude whether the two regions exhibit a different age distribution over the past few tens of Myr as observed by Konstantopoulos et al. (2013).
-
2.
the age-mass diagrams: the applied mass cutoff to draw a mass-limited sample for clusters younger than 200 Myr changes by 1 dex, i.e. from down to , when moving away from the nuclear regions. This is because of the relatively high-luminosity background of the inner field which challenges the detection of faint low-mass clusters or highly-extinguished sources in that region. The inner field hosts 68 massive star clusters with log (8 percent of its population) against 31 (2 percent) candidates in the outer regions. There are however similar numbers of young and old populations in both regions: around 65 percent of the SSCs are younger than 30 Myr and 14 percent older than 200 Myr.
-
3.
the age distributions: the dN/d shapes generally look similar for both regions. The age distributions of the Myr time interval are consistent with the ones plotted in Fig. 15: an increase of the cluster formation rate (though bias from unbound systems and the chimney around 10 Myr should be accounted for). A peak is also seen around log 7.7 ( 50 Myr) which may indicate a past starburst activity. A power-law fit for the 10 - 200 Myr age range results to and for the inner and outer regions, respectively. We do not interpret these values since we applied different mass limits to draw the two age distributions (see the horizontal line in the age-mass plane).
-
4.
the mass functions: we get slopes (inner) and (outer) by fitting a single power-law to the high end of the mass distributions. Alternatively, Schechter or broken power-law fits can also represent the CMF of the nuclear regions with an underlying truncation around .
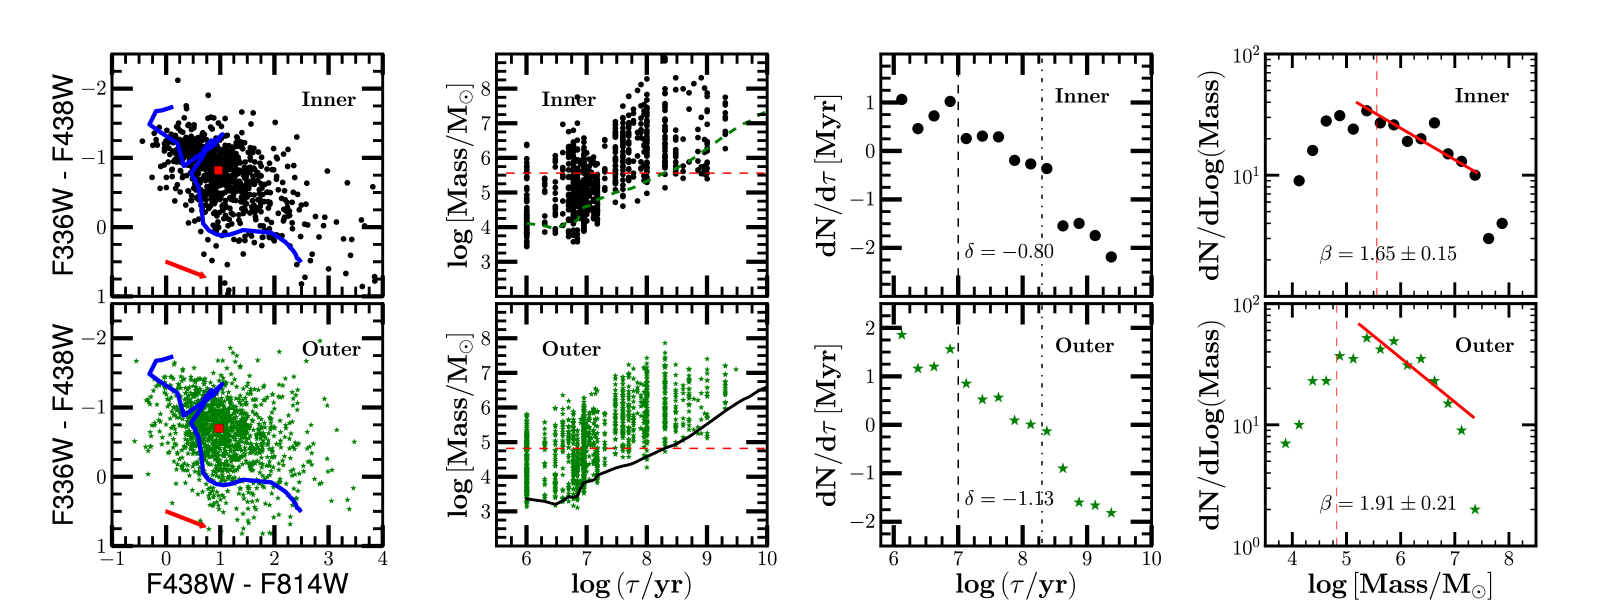
The outer field hosts more YMCs than the nuclear regions: 1272 against 836 candidates. A size-of-sample effect is therefore a possibility to explain the discrepancies in the distributions. However, the truncation at the high mass end and the relatively shallower slope of the inner field CMF can also be an evidence for environmentally-dependent cluster disruption. This could confirm the previously suggested scenario in the field of e.g. M83 (Bastian et al., 2011; Bastian et al., 2012) or NGC 4041 (Konstantopoulos et al., 2013). Nevertheless, results from other works emphasize a quasi-universal disruption mechanism independent of the galaxy host environment (e.g. Mulia et al., 2016).
| Region name | Annulus | Nb.SSCs | Nb.SSCs | Nb.SSCs | Nb.SSCs | Nb.SSCs | |||
| (kpc) | () | ( Myr) | ( Myr) | ( Myr) | () | log() | |||
| (1) | (2) | (3) | (4) | (5) | (6) | (7) | (8) | (9) | (10) |
| R1 | 329 | 45 % (147) | 58 % (191) | 19 % (64) | 4 % (14) | 8.88, 8.14, 7.99 | 1.59 | ||
| R2 | 331 | 50 % (164) | 59 % (194) | 18 % (60) | 1 % (3) | 7.58, 7.27, 7.17 | 1.79 | ||
| R3 | 328 | 42 % (137) | 50 % (163) | 18 % (60) | 2 % (6) | 7.44, 7.24, 7.23 | 2.03 | ||
| Notes. Columns 1 & 2: name and size of the radial bin; Column 3: number of SSCs hosted by the region within the radial bin; Columns 4 & 5: number of SSCs younger than 10 Myr and 30 Myr; Column 6: number of SSCs older than 200 Myr; Column 7: number of SSCs more massive than ; Column 8: masses of the first, the third and the fifth most massive star clusters; Columns 9 & 10: power-law slopes of the age distribution and the CMF. | |||||||||
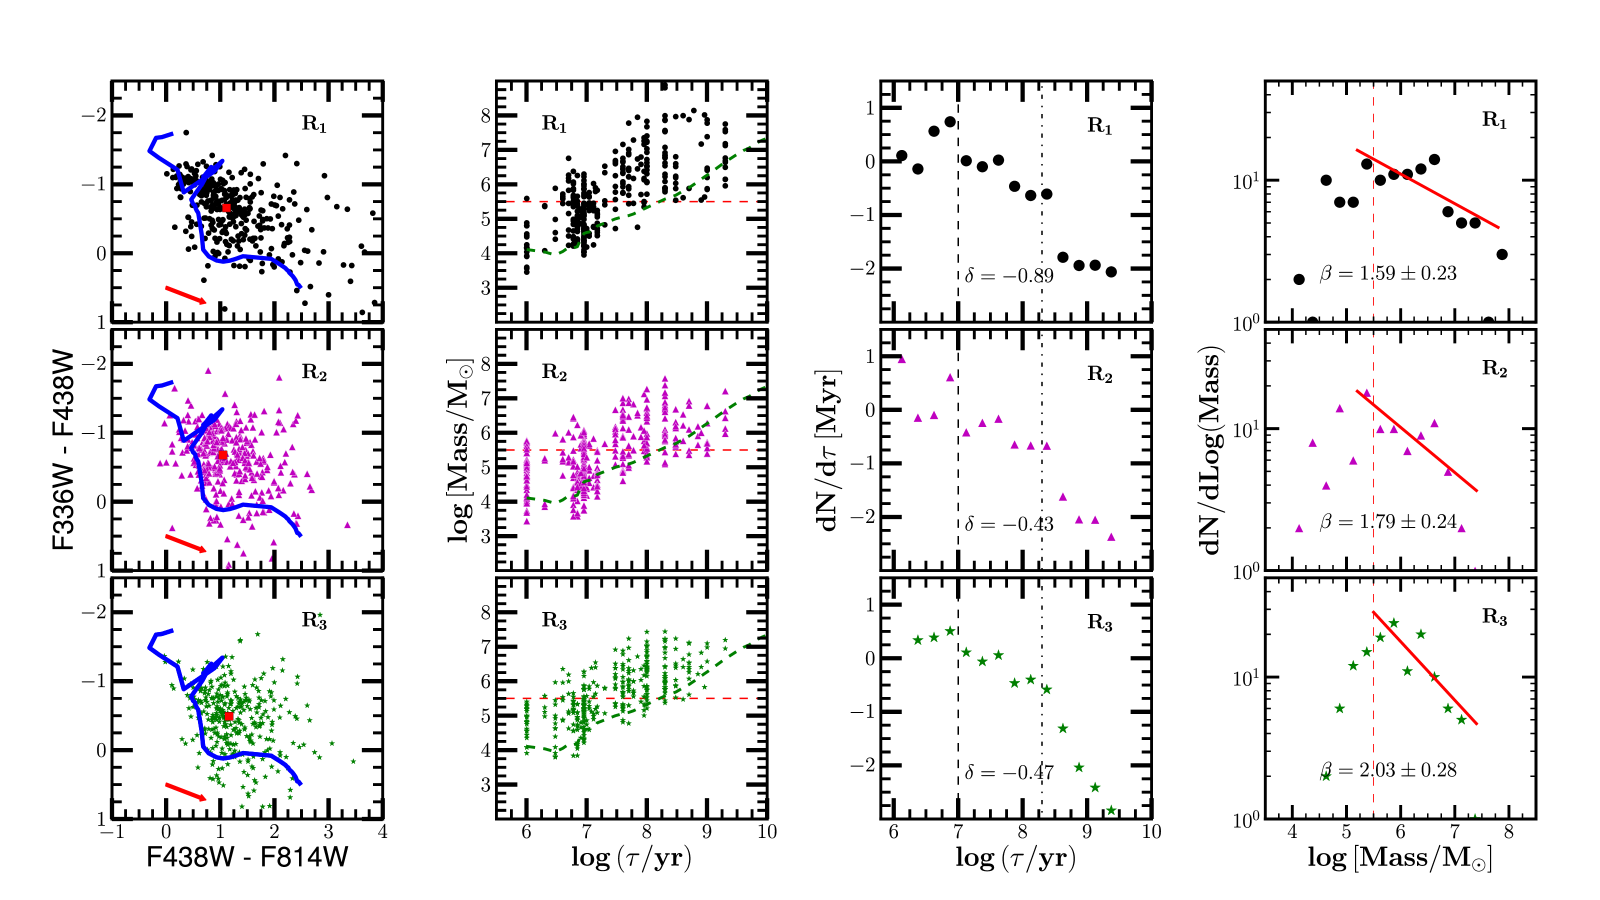
6.6.2 Radial binning of the clusters hosted by NGC 3690E
Three radial bins were defined in the field of NGC 3690E to split its SSC catalogue into three equal numbers (see Section 3.2). The same distributions as shown in Fig. 20 were also plotted for each subpopulation in Fig. 21: SSCs within the innermost bin R1 labelled as black points (top panel), those hosted by the middle annulus R2 as purple triangles (middle), and the ones located in the outermost bin R3 as green stars (bottom). Table 6 summarizes the star cluster properties of each radial bin derived from the different distributions. There is no obvious difference in the color-color diagrams and each radial bin hosts approximately the same amount of old clusters ( 18 percent for Myr). A peak is also observed around log( 7.7 in all three age distributions. However, we record a variation as a function of galactocentric distance in the properties of the massive cluster candidates, the cluster age distributions and the CMFs, especially by comparing the SSC physical paramaters of R1 to those of R2 or R3: i) a relatively high percentage of massive star clusters in the innermost regions compared to those of the other annuli ( times higher); ii) masses of the first, the third, and the fifth most massive SSC candidates generally decrease with an increasing distance as listed in the 8th column of Table 6. Pflamm-Altenburg et al. (2013) and Sun et al. (2016) also reported a similar trend in their work. Because the masses of the most massive star clusters are less likely to endure strong stochastic IMF sampling effects, interpreting such a correlation helps in establishing the properties of the CIMF; iii) the power-law index of the Myr age range declines with an increasing radius (9th column, a fixed lower mass limit of was applied to all three functions); iv) the power-law slope flattens as we approach the galaxy centre (from 2.03 going down to 1.79 and then 1.59) and a truncation at high masses is observed in the CMFs of the two inner annuli. Note, however, that a power-law function does not seem to best represent the CMFs of R1 and R2. One should thus be careful when interpreting such results. Nevertheless, given that there are equal SSC numbers in each bin, the above results support the theory of an environmentally-dependent cluster formation and disruption as already suggested earlier in this work and the literature (e.g. Fouesneau et al., 2014; Adamo et al., 2015; Hollyhead et al., 2016).
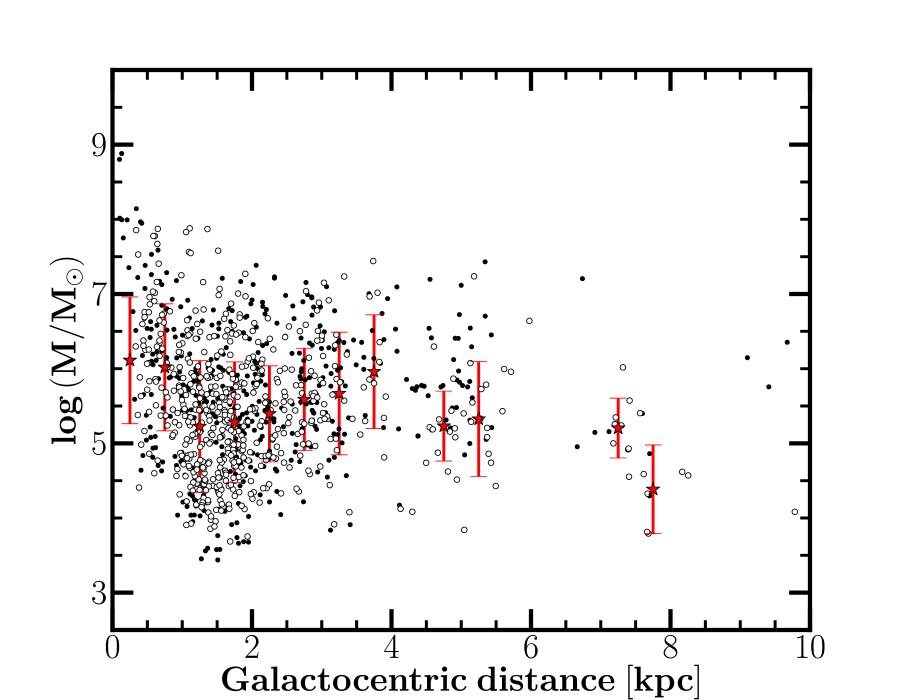
6.6.3 The cluster mass-galactocentric radius relation
Because of its symmetrical morphological feature, the star cluster population of NGC 3690E was also used to check the tightness of the cluster mass-galactocentric radius relation. Does it only apply to the first, the third, and the fifth most massive clusters of each radial bin? Figure 22 shows the star cluster mass plotted against its galactocentric distance. The cluster mass decreases with an increasing galactocentric radius up to kpc away from the galaxy nucleus, but after which it slowly increases until kpc. While the high gas density in the nuclear regions of NGC 3690E likely explains the behaviour within 2 kpc, the steady increase beyond this point arises because of the extreme environments provided by the ongoing merging of the eastern component with its companion NGC 3690W. In fact, the merging point of the system is estimated to be located kpc away from the nucleus of NGC 3690E. The star cluster mass-galactocentric radius relation thus suggests that the formation of star clusters in Arp 299, especially in the eastern galaxy, is not only governed by stochastic sampling. Despite the possibility of any size-of-sample effect, the YMC birthsites should have played an important role (Adamo et al., 2015; Li et al., 2017). This is consistent with the results from our radial binning analyses. Note, however, that other studies such as Sun et al. (2016) rule out any environment-dependence scenario and favor a stochastic cluster formation process.
|
6.7 The -band selected SSC candidates
It is important to have a separate analysis of the NIR sources since datasets of the ongoing SUNBIRD survey are mainly based on -band observations only (e.g. Randriamanakoto et al., 2013a; Randriamanakoto, 2015). The WFC3/UVIS images were thus resampled using GEOTRAN and GEOMAP IRAF tasks to match spatially with the NIR AO data pixel scale and orientation. Photometry of bright non-saturated sources in the field of both original and resampled HST images were derived and the measurements indicated that the values of the visual magnitudes are similar within their photometric errors. Hence, we did not apply any correction from the resampling and any offset slightly higher than 0.5 pixels could simply be due to relative extinction effects. Not all the -selected sources were detected in the optical images of the system. Those located in the dust-obscured regions of the galaxy ( 25 percent of the NIR sources) were apparently being missed while running SExtractor in Section 3.1. Figure 23 overplots the Yggdrasil SSP models with the -band datapoints in vs. (left panel) and vs. (middle) color-color diagrams. Both distributions suggest that the NIR star clusters occupy a wide range of extinction and age. Their positions in the -band CCD generally follow the predicted colors of the SSP models. In other words, most of the -selected star cluster candidates of Arp 299 do not show any NIR excess.
We also combined the SSC -band magnitudes with the optical data to run two new sets of the minimization (using - and -filters) other than the adopted -band SED fitting. In all three sets, we find that the star cluster masses generally lie in the range of . Although some of the datapoints with a derived mass could be star cluster complexes or sources with strong NIR excess, the interacting system has also the potential to host very massive star clusters due to its extreme environment as already discussed in Section 6.4.1. Apart from an overestimate of the star cluster mass, outputs from -fit converge to an older age range compared with the resulting cluster ages of the other fits. This is expected because of the influence from the age-extinction degeneracy once excluding the UV-data. On the other hand, -fit performs better (with the smallest reduced values) than the two other sets. Such results confirm the reliability of using -fit outputs to investigate the star cluster properties of Arp 299 in this work. The resulting age-mass plane of the -band selected clusters (from -fit) is presented in the right panel of Fig. 23. The lower mass limits, in the order of , are higher than the ones of the optically-selected clusters. Such a difference cannot be associated with an overestimate in the NIR cluster mass since the -band filter was already excluded during the SED modelling.
|
|
The color-color plot has a few outliers that unexpectedly strech to redder colors. Such a dispersion cannot be associated to high photometric uncertainties as we have already excluded sources with 0.35 mag. These outliers appear to show a NIR excess in their fluxes. Apart from stochastic sampling effects and/or resolution effects, the inclusion of the surrounding nebular emission in the photometric measurements could be another reason behind such an excess (e.g. Adamo et al., 2010; de Grijs et al., 2013; Bastian et al., 2014). If there is stochasticity, massive SSCs are expected to follow the distribution of the SSP models in the CCD, whereas low mass star clusters () are distributed over a wide range of the color because of the dominant NIR flux of RSGs in their stellar population. This is not, however, the case when looking at the mass distribution of young clusters ( Myr) of the current dataset: no record of any significant scatter in the distribution of the low mass star clusters compared to that of the massive ones. Stochasticity is thus believed to only partly affect the data and other causes of the excess such as blending effects or nebular emission should also be considered. In fact, Bastian et al. (2014) recently reported that the intensity of the NIR excess strongly depends on the spatial resolution of the NIR data. Since we have applied a smaller aperture radius of 0.1 arcsec to derive the star cluster magnitudes and have already shown that blending effects are insignificant at distances below 100 Mpc (Randriamanakoto et al., 2013b), we conclude that NIR excess of the young clusters also arises due to the emission included inside the aperture measurements.
6.8 YMCs in the northwest star-forming regions
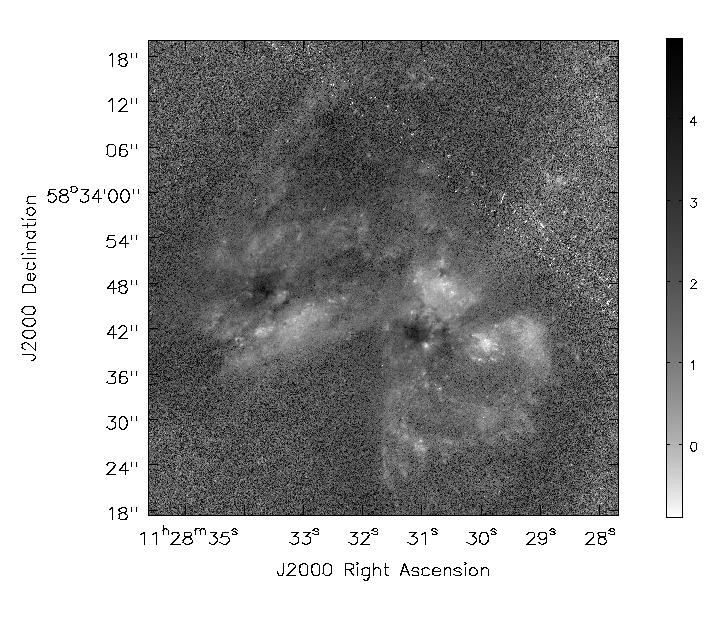
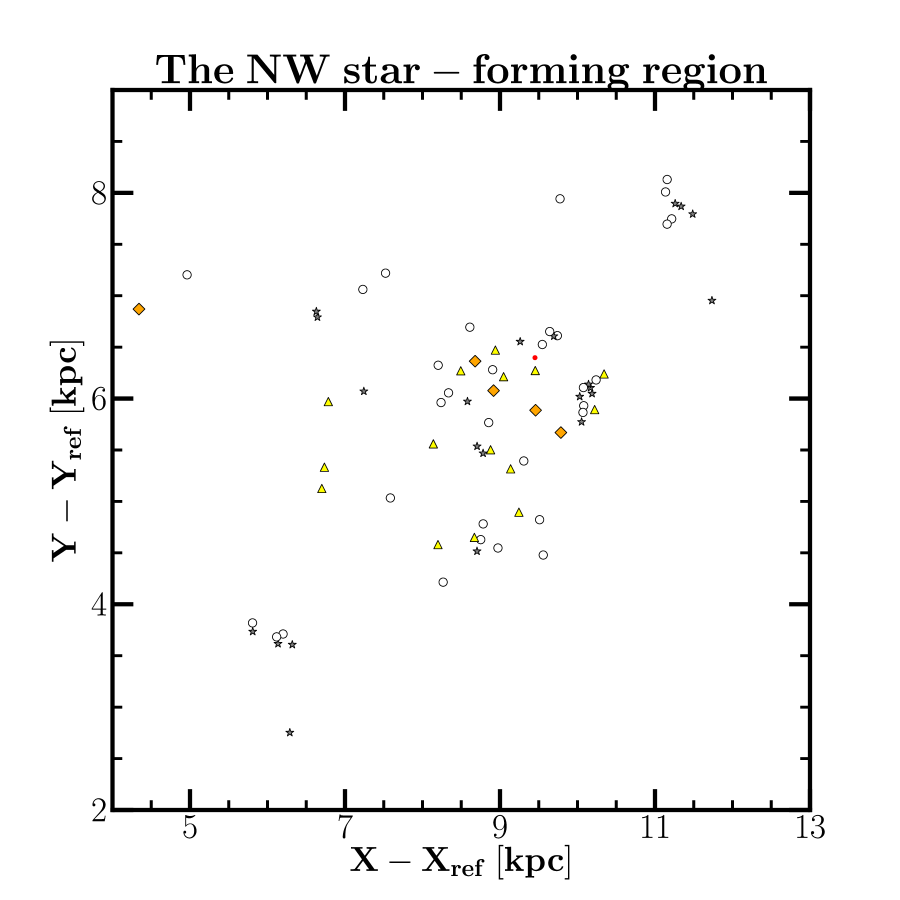
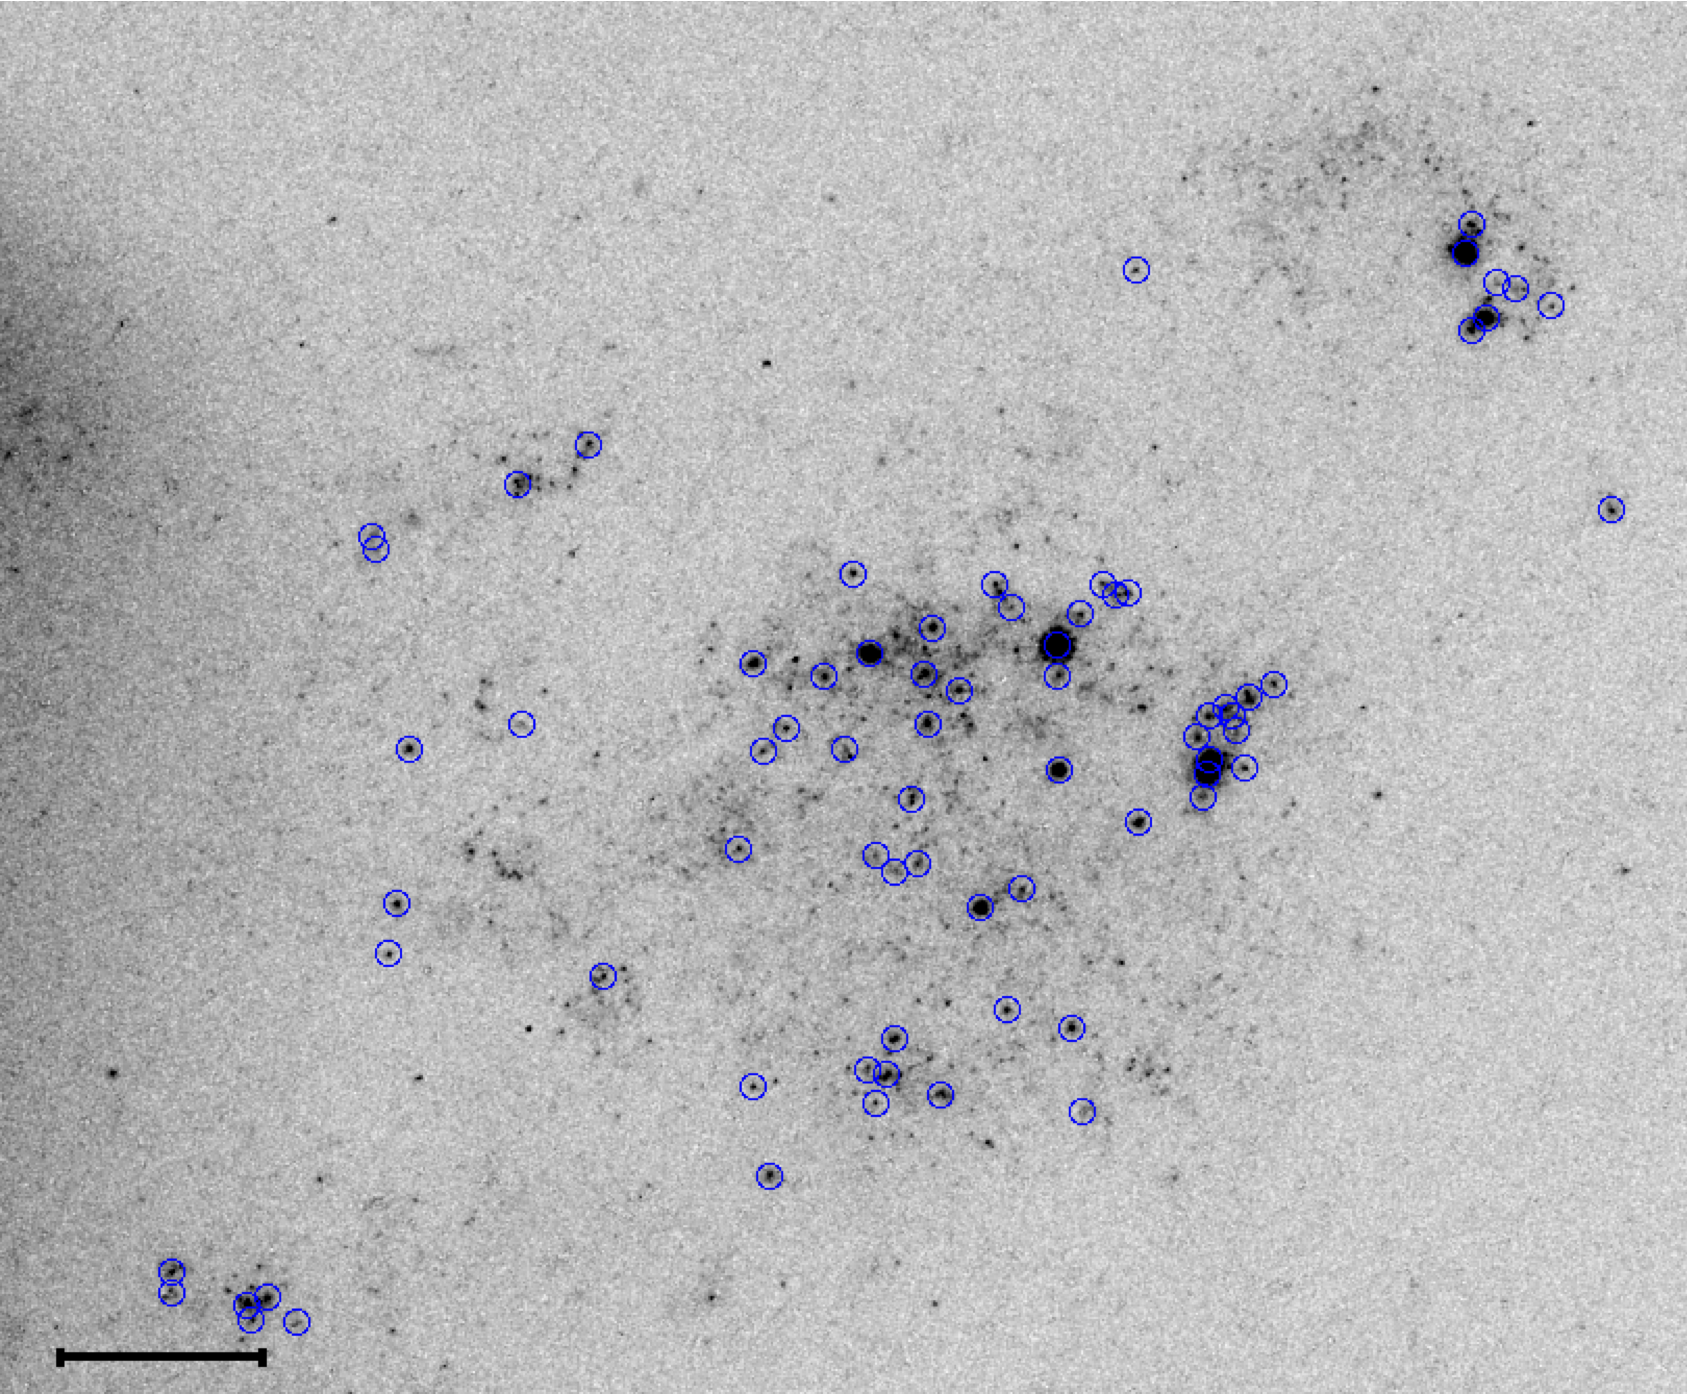
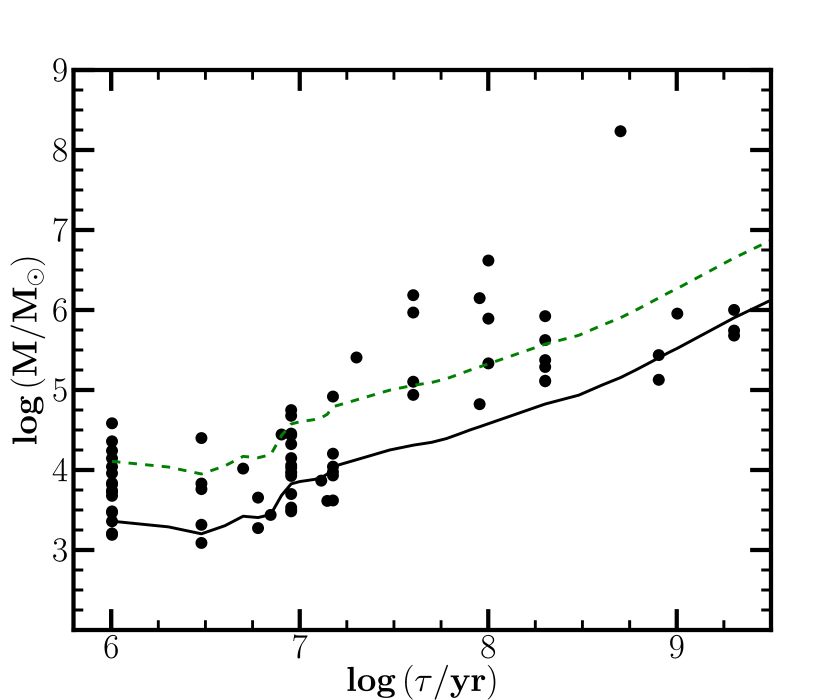
As can be seen in Fig. 1, a star-forming region 10 kpc northwest of the interacting system was also imaged by the HST/WFC3 camera. The region could either be a low-metallicity blue dwarf companion or a metal-rich tidal tail forming stars on its own after gas has been thrown out from the advanced merging galaxies. A snapshot of the region from the -band image clearly reveals that young massive clusters are present in the field (see top panel of Fig. 24). Object detection and selection followed the same procedures as those of Arp 299 and resulted in the extraction of 74 YMC candidates (labelled as open circles). Note, however, that visual inspection of the HST images suggests that there could be more YMCs than the recorded number in this region.
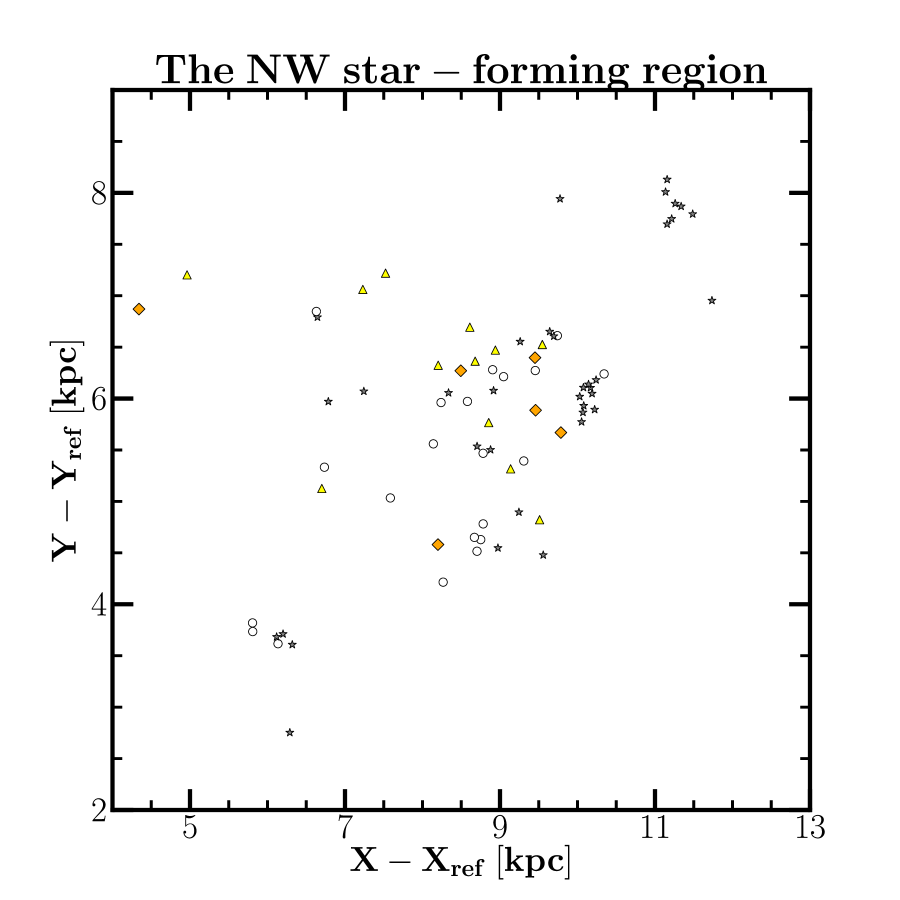
YMCs of the northwest star-forming region are mainly very young, relatively less massive, and with low extinction compared to the star cluster population hosted by Arp 299. The bottom panel of Fig. 24 presents the YMC age-mass diagram: 58 percent of the clusters have ages Myr with 23 candidates younger than 5 Myr. More than 70 percent of the clusters have masses and only one candidate that could also be identified as a supergiant star (an outlier in the CMD/CCD) is more massive than . In terms of visual extinction, the median value is mag and more than 75 percent of the star cluster population have mag. We did not see any trend in the spatial distribution plotted as a function of the cluster age and extinction (see bottom-right panels of Fig. 12 and Fig. 14, respectively). However, there seems to exist at least a weak pattern when labelling the YMC candidates with respect to their masses (bottom-right panel of Fig. 13). Regions with a relatively low-luminosity background are the ones to host the least massive star clusters (grey stars, ). Could it be related with the distribution of the gas reservoir in the field? Kinematic studies are required to trace the (star) cluster formation history of the region. These are relevant to check whether the extreme environments of Arp 299 affect the evolution of the neighbouring young star clusters in any way (e.g. could there be any gas outflow from the interaction?).
7 Summary and conclusions
We performed a photometric study of young massive star clusters in the LIRG system of Arp 299: an ongoing merger composed of NGC 3690E (east) and NGC 3690W (west). The work mainly used archival datasets from the HST WFC3/UVIS camera to understand the formation, evolution and disruption mechanisms of the star clusters. The final -band catalogue contains 2182 sources common to all three filters with magnitude errors below mag. This includes 1323 high confidence photometric sources and 74 SSCs hosted by a star-forming region 10 kpc to the northwest of the interacting system. Yggdrasil SSP models were used as a reference in deriving the age, mass and extinction of the cluster population. Each individual cluster had its own range of extinction that was constrained from an -based extinction map while performing the SED fitting. The use of -band data helped to optimally reduce the age-extinction degeneracy. The major findings of this work are outlined as follows:
-
1.
Arp 299 hosts a very young star cluster population with 62 percent of them having an age less than 15 Myr old. They are massive with a lower mass limit of for a subsample that is complete up to 10 Myr. Their visual extinctions range between 0 and 4.5 mag. Apart from hosting more luminous star clusters, a significant number of the YMC population of NGC 3690W have a low extinction value and ages younger than 10 Myr compared to the candidates hosted by NGC 3690E.
-
2.
The star clusters are generally randomly distributed in terms of their ages. Nevertheless, the disk overlap region and the southern spiral arm of NGC 3690E mainly host cluster candidates younger than 50 Myr old. There are supergiant HII regions located in those star-forming regions. On the other hand, the very massive clusters are spatially associated with the galaxy nuclear regions. Such a distribution could be an imprint of the displacement of large quantities of dense molecular gas toward the nuclear regions as the two gas-rich galaxies collide.
-
3.
The derived cluster age distribution suggests that the cluster formation rate has increased over the past 10 Myr and will still be increasing in the future. This is a highly probable scenario given the ubiquity of extreme starburst activities induced by the violent merging of the two galaxy components of Arp 299. The fitted age distribution of a mass-limited sample over the Myr time interval results in a power-law slope equals to . Such a value becomes and in the case of NGC 3690E and NGC 3690W, respectively. The difference in the slope suggests that YMCs of NGC 3690W undergo stronger disruption than those located in the eastern component. Finally, a bump observed around 50 Myr could possibly trace an intense starburst activity which is already reported by other studies.
-
4.
Fitting a single power-law distribution to the -band CLFs of Arp 299 results in slopes ranging between . Unlike normal spiral galaxies, intensely star-forming galaxies such as LIRGs are found to be associated with shallower slopes. The values of get steeper with redder filter because of cluster evolutionary fading. With indices shallower by dex than those of NGC 3690E, the CLFs of NGC 3690W also display clear truncations at high luminosities and a flat distribution in the faint end magnitudes. Such a trend is likely a signature of stronger dissolution of the star clusters hosted by this component compared to the disruption occuring in NGC 3690E.
-
5.
The final catalogue was split in three age bins to better analyse the cluster mass distribution. Apart from fitting a power-law function to the CMFs, a Schechter fit was also applied to the Myr mass-limited data. The value of the power-law slope decreases with an increasing age bin (from 2.61 down to 1.68). The critical mass until which we performed the power-law fit shifts toward higher masses. The mass functions at younger ages exhibit an underlying truncation at the high mass end. The Schechter characteristic mass is consistent with the values reported in the literature in the case of starbursts and merger galaxies. The eastern component has a more massive than its companion which is consistent with that galaxy hosting more than half of the very massive YMCs in Arp 299. Although statistical effects and/or incompleteness may contribute to these trends, they are not enough to fully explain the CMF peculiar behaviours. Both environmental and mass-dependence of the cluster mode of disruption should also be considered.
-
6.
Properties of the YMCs as a function of the varying background also provide evidence for environmentally-dependent cluster disruption. We found that the CMF associated with the nuclear regions has a relatively shallower slope and a distinct truncation at the high mass end. Furthemore, radial binning in equal number of the star clusters hosted by NGC 3690E strengthens the idea of some physical effects (partly) constraining the cluster formation and disruption. In particular, we found that, within 2 kpc radius of this galaxy nucleus, the cluster mass decreases with an increasing galactocentric radius.
-
7.
We considered the time interval of Myr to derive the cluster formation rate and the cluster formation efficiency percent. Such a value is underestimated because of incompleteness in low mass star clusters. Nevertheless, the extreme environments of Arp 299 enable the system to have times more star formation occuring in bound clusters than in the case of gas-poor spiral galaxies. With a SFR density of , Arp 299 generally follows the relation established from observational and theoretical predictions.
-
8.
YMCs of the -band catalogue are more massive than the optically-selected ones. They do not have specific age and mass ranges and they are uniformly distributed in the cluster age-mass plane. Only a few cases present NIR excess in their fluxes. Besides stochasticity, contamination from nebular emission encircled within the aperture photometry could also explain the excess.
-
9.
The star-forming region northwest of the interacting LIRG mainly hosts young and relatively less massive YMCs () of low visual extinction (with a median of ). The lack of spectroscopic data, however, limited our investigation on the effects of the ongoing merging toward the cluster formation history of the region.
In summary, the star clusters of NGC 3690W are more vulnerable to disruption while those hosted by the eastern component stand a higher chance to have masses . These results strongly indicate that the extreme environments of Arp 299 influence both formation and evolutionary processes of the star cluster population while a mass-dependent scenario is also a possibility. An upcoming paper will use the binary population synthesis model BPASS (Eldridge et al., 2008, 2017) to estimate the ages and masses of the young massive star clusters. The objectives of such analyses are: i) to evaluate the effects of the inclusion of binary stars into the chosen SSP models; ii) and to predict the total X-ray flux from high-mass X-ray binaries (HMXBs) after combining the derived star cluster properties with Chandra observations of Arp 299 (Anastasopoulou et al., 2016). HMXBs are believed to be progenitors of CCSNe.
Acknowledgements
We thank the referee for helpful comments and suggestions to improve this article. ZR acknowledges financial support from the South African Radio Astronomical Observatory, which is a facility of the National Research Foundation (NRF). PV is also grateful to the NRF. Based on observations made with the NASA/ESA Hubble Space Telescope, and obtained from the Hubble Legacy Archive, which is a collaboration between the Space Telescope Science Institute (STScI/NASA), the Space Telescope European Coordinating Facility (ST-ECF/ESA) and the Canadian Astronomy Data Centre (CADC/NRC/CSA). Based in part on observations obtained at the Gemini Observatory, which is operated by the Association of Universities for Research in Astronomy, Inc., under a cooperative agreement with the NSF on behalf of the Gemini partnership: the National Science Foundation (United States), the National Research Council (Canada), CONICYT (Chile), Ministerio de Ciencia, Tecnología e Innovación Productiva (Argentina), and Ministério da Ciência, Tecnologia e Inovação (Brazil).
References
- Adamo & Bastian (2018) Adamo, A. & Bastian, N. 2018, in Astrophysics and Space Science Library, Vol. 424, The Birth of Star Clusters, ed. S. Stahler, 91
- Adamo et al. (2015) Adamo, A., Kruijssen, J. M. D., Bastian, N., Silva-Villa, E., & Ryon, J. 2015, MNRAS, 452, 246
- Adamo et al. (2011) Adamo, A., Östlin, G., & Zackrisson, E. 2011, MNRAS, 417, 1904
- Adamo et al. (2010) Adamo, A., Östlin, G., Zackrisson, E., Hayes, M., Cumming, R. J., & Micheva, G. 2010, MNRAS, 407, 870
- Adamo et al. (2017) Adamo, A., Ryon, J. E., Messa, M., et al. 2017, ApJ, 841, 131
- Alonso-Herrero et al. (2009) Alonso-Herrero, A., et al. 2009, ApJ, 697, 660
- Alonso-Herrero et al. (2000) Alonso-Herrero, A., Rieke, G. H., Rieke, M. J., & Scoville, N. Z. 2000, ApJ, 532, 845
- Alonso-Herrero et al. (2002) —. 2002, AJ, 124, 166
- Alonso-Herrero et al. (2013) Alonso-Herrero, A., et al. 2013, ApJ, 779, L14
- Anastasopoulou et al. (2016) Anastasopoulou, K., Zezas, A., Ballo, L., & Della Ceca, R. 2016, MNRAS, 460, 3570
- Anders et al. (2004) Anders, P., Bissantz, N., Fritze-v. Alvensleben, U., & de Grijs, R. 2004, MNRAS, 347, 196
- Annibali et al. (2011) Annibali, F., Tosi, M., Aloisi, A., & van der Marel, R. P. 2011, AJ, 142, 129
- Barnes & Hernquist (1996) Barnes, J. E. & Hernquist, L. 1996, ApJ, 471, 115
- Bastian (2008) Bastian, N. 2008, MNRAS, 390, 759
- Bastian (2016) Bastian, N. 2016, in EAS Publications Series, Vol. 80, EAS Publications Series, ed. E. Moraux, Y. Lebreton, & C. Charbonnel, 5–37
- Bastian et al. (2011) Bastian, N., et al. 2011, MNRAS, 417, L6
- Bastian et al. (2012) Bastian, N., Adamo, A., Gieles, M., Silva-Villa, E., Lamers, H. J. G. L. M., Larsen, S. S., Smith, L. J., Konstantopoulos, I. S., & Zackrisson, E. 2012, MNRAS, 419, 2606
- Bastian et al. (2014) Bastian, N., Adamo, A., Schirmer, M., Hollyhead, K., Beletsky, Y., Carraro, G., Davies, B., Gieles, M., & Silva-Villa, E. 2014, MNRAS, 444, 3829
- Bastian et al. (2005) Bastian, N., Gieles, M., Lamers, H. J. G. L. M., Scheepmaker, R. A., & de Grijs, R. 2005, A&A, 431, 905
- Bastian et al. (2006) Bastian, N., Saglia, R. P., Goudfrooij, P., Kissler-Patig, M., Maraston, C., Schweizer, F., & Zoccali, M. 2006, A&A, 448, 881
- Bastian et al. (2009) Bastian, N., Trancho, G., Konstantopoulos, I. S., & Miller, B. W. 2009, ApJ, 701, 607
- Baumgardt et al. (2013) Baumgardt, H., Parmentier, G., Anders, P., & Grebel, E. K. 2013, MNRAS, 430, 676
- Bertin & Arnouts (1996) Bertin, E. & Arnouts, S. 1996, A&AS, 117, 393
- Bik et al. (2003) Bik, A., Lamers, H. J. G. L. M., Bastian, N., Panagia, N., & Romaniello, M. 2003, A&A, 397, 473
- Boily & Kroupa (2003) Boily, C. M. & Kroupa, P. 2003, MNRAS, 338, 665
- Bondi et al. (2012) Bondi, M., Pérez-Torres, M. A., Herrero-Illana, R., & Alberdi, A. 2012, A&A, 539, A134
- Boutloukos & Lamers (2003) Boutloukos, S. G. & Lamers, H. J. G. L. M. 2003, MNRAS, 338, 717
- Bruzual & Charlot (2003) Bruzual, G. & Charlot, S. 2003, MNRAS, 344, 1000
- Calzetti et al. (2000) Calzetti, D., Armus, L., Bohlin, R. C., Kinney, A. L., Koornneef, J., & Storchi-Bergmann, T. 2000, ApJ, 533, 682
- Chandar et al. (2015) Chandar, R., Fall, S. M., & Whitmore, B. C. 2015, ApJ, 810, 1
- Chandar et al. (2017) Chandar, R., Fall, S. M., Whitmore, B. C., & Mulia, A. J. 2017, ApJ, 849, 128
- Chandar et al. (2014) Chandar, R., Whitmore, B. C., Calzetti, D., & O’Connell, R. 2014, ApJ, 787, 17
- Cook et al. (2016) Cook, D. O., Dale, D. A., Lee, J. C., Thilker, D., Calzetti, D., & Kennicutt, R. C. 2016, MNRAS, 462, 3766
- de Grijs et al. (2013) de Grijs, R., Anders, P., Zackrisson, E., & Östlin, G. 2013, MNRAS, 431, 2917
- Eldridge et al. (2008) Eldridge, J. J., Izzard, R. G., & Tout, C. A. 2008, MNRAS, 384, 1109
- Eldridge et al. (2017) Eldridge, J. J., Stanway, E. R., Xiao, L., McClelland, L. A. S., Taylor, G., Ng, M., Greis, S. M. L., & Bray, J. C. 2017, PASA, 34, 58
- Fall & Chandar (2012) Fall, S. M. & Chandar, R. 2012, ApJ, 752, 96
- Fall et al. (2005) Fall, S. M., Chandar, R., & Whitmore, B. C. 2005, ApJ, 631, L133
- Fouesneau et al. (2014) Fouesneau, M., Johnson, L. C., Weisz, D. R., Dalcanton, J. J., Bell, E. F., Bianchi, L., Caldwell, N., Gouliermis, D. A., Guhathakurta, P., Kalirai, J., Larsen, S. S., Rix, H.-W., Seth, A. C., Skillman, E. D., & Williams, B. F. 2014, ApJ, 786, 117
- Gieles (2009) Gieles, M. 2009, MNRAS, 394, 2113
- Gieles (2010) Gieles, M. 2010, in Astronomical Society of the Pacific Conference Series, Vol. 423, Galaxy Wars: Stellar Populations and Star Formation in Interacting Galaxies, ed. B. Smith, J. Higdon, S. Higdon, & N. Bastian, 123
- Gieles & Bastian (2008) Gieles, M. & Bastian, N. 2008, A&A, 482, 165
- Gieles et al. (2006) Gieles, M., Larsen, S. S., Bastian, N., & Stein, I. T. 2006, A&A, 450, 129
- Gieles & Portegies Zwart (2011) Gieles, M. & Portegies Zwart, S. F. 2011, MNRAS, 410, L6
- Goddard et al. (2010) Goddard, Q. E., Bastian, N., & Kennicutt, R. C. 2010, MNRAS, 405, 857
- Haas et al. (2008) Haas, M. R., Gieles, M., Scheepmaker, R. A., Larsen, S. S., & Lamers, H. J. G. L. M. 2008, A&A, 487, 937
- Herrero-Illana et al. (2017) Herrero-Illana, R., Pérez-Torres, M. Á., Randriamanakoto, Z., Alberdi, A., Efstathiou, A., Väisänen, P., Kankare, E., Kool, E., Mattila, S., Ramphul, R., & Ryder, S. 2017, MNRAS, 471, 1634
- Hibbard & Yun (1999) Hibbard, J. E. & Yun, M. S. 1999, AJ, 118, 162
- Hollyhead et al. (2016) Hollyhead, K., Adamo, A., Bastian, N., Gieles, M., & Ryon, J. E. 2016, MNRAS, 460, 2087
- Hunter et al. (2003) Hunter, D. A., Elmegreen, B. G., Dupuy, T. J., & Mortonson, M. 2003, AJ, 126, 1836
- Johnson et al. (2016) Johnson, L. C., Seth, A. C., Dalcanton, J. J., Beerman, L. C., Fouesneau, M., Lewis, A. R., Weisz, D. R., Williams, B. F., Bell, E. F., Dolphin, A. E., Larsen, S. S., Sandstrom, K., & Skillman, E. D. 2016, ApJ, 827, 33
- Johnson et al. (2017) Johnson, L. C., Seth, A. C., Dalcanton, J. J., Beerman, L. C., Fouesneau, M., Weisz, D. R., Bell, T. A., Dolphin, A. E., Sandstrom, K., & Williams, B. F. 2017, ApJ, 839, 78
- Johnson et al. (2012) Johnson, L. C., et al. 2012, ApJ, 752, 95
- Kankare et al. (2014) Kankare, E., Mattila, S., Ryder, S., et al. 2014, MNRAS, 440, 1052
- Kinney et al. (1996) Kinney, A. L., Calzetti, D., Bohlin, R. C., McQuade, K., Storchi-Bergmann, T., & Schmitt, H. R. 1996, ApJ, 467, 38
- Konstantopoulos et al. (2013) Konstantopoulos, I. S., Smith, L. J., Adamo, A., et al. 2013, AJ, 145, 137
- Kool et al. (2018) Kool, E. C., Ryder, S., Kankare, E., et al. 2018, MNRAS, 473, 5641
- Kruijssen (2012) Kruijssen, J. M. D. 2012, MNRAS, 426, 3008
- Kruijssen & Bastian (2016) Kruijssen, J. M. D. & Bastian, N. 2016, MNRAS, 457, L24
- Lada & Lada (2003) Lada, C. J. & Lada, E. A. 2003, ARA&A, 41, 57
- Lai et al. (1999) Lai, O., Rouan, D., Rigaut, F., Doyon, R., & Lacombe, F. 1999, A&A, 351, 834
- Lamers & Gieles (2008) Lamers, H. J. G. L. M. & Gieles, M. 2008, in Astronomical Society of the Pacific Conference Series, Vol. 388, Mass Loss from Stars and the Evolution of Stellar Clusters, ed. A. de Koter, L. J. Smith, & L. B. F. M. Waters, 367
- Lamers et al. (2005) Lamers, H. J. G. L. M., Gieles, M., Bastian, N., Baumgardt, H., Kharchenko, N. V., & Portegies Zwart, S. 2005, A&A, 441, 117
- Larsen (2009) Larsen, S. S. 2009, A&A, 494, 539
- Larson et al. (2016) Larson, K. L., Sanders, D. B., Barnes, J. E., Ishida, C. M., Evans, A. S., U, V., Mazzarella, J. M., Kim, D.-C., Privon, G. C., Mirabel, I. F., & Flewelling, H. A. 2016, ApJ, 825, 128
- Leitherer et al. (2014) Leitherer, C., Ekström, S., Meynet, G., Schaerer, D., Agienko, K. B., & Levesque, E. M. 2014, ApJS, 212, 14
- Leitherer et al. (1999) Leitherer, C., Schaerer, D., Goldader, J. D., Delgado, R. M. G., Robert, C., Kune, D. F., de Mello, D. F., Devost, D., & Heckman, T. M. 1999, ApJS, 123, 3
- Li et al. (2017) Li, H., Gnedin, O. Y., Gnedin, N. Y., Meng, X., Semenov, V. A., & Kravtsov, A. V. 2017, ApJ, 834, 69
- Linden et al. (2017) Linden, S. T., Evans, A. S., Rich, J., et al. 2017, ApJ, 843, 91
- Maíz Apellániz & Úbeda (2005) Maíz Apellániz, J., & Úbeda, L. 2005, ApJ, 629, 873
- Maji et al. (2017) Maji, M., Zhu, Q., Li, Y., Charlton, J., Hernquist, L., & Knebe, A. 2017, ApJ, 844, 108
- Mattila et al. (2012) Mattila, S., Dahlen, T., Efstathiou, A., Kankare, E., Melinder, J., Alonso-Herrero, A., Pérez-Torres, M. Á., Ryder, S., Väisänen, P., & Östlin, G. 2012, ApJ, 756, 111
- Messa et al. (2018) Messa, M., et al. 2018, MNRAS, 473, 996
- Mok et al. (2018) Mok, A., Chandar, R., & Fall, S. M. 2018, ArXiv e-prints
- Mulia et al. (2016) Mulia, A. J., Chandar, R., & Whitmore, B. C. 2016, ApJ, 826, 32
- Neff et al. (2004) Neff, S. G., Ulvestad, J. S., & Teng, S. H. 2004, ApJ, 611, 186
- Pelupessy & Portegies Zwart (2012) Pelupessy, F. I. & Portegies Zwart, S. 2012, MNRAS, 420, 1503
- Pflamm-Altenburg et al. (2013) Pflamm-Altenburg, J., González-Lópezlira, R. A., & Kroupa, P. 2013, MNRAS, 435, 2604
- Portegies Zwart et al. (2010) Portegies Zwart, S. F., McMillan, S. L. W., & Gieles, M. 2010, ARA&A, 48, 431
- Randriamanakoto (2015) Randriamanakoto, Z. 2015, PhD thesis, Department of Astronomy, University of Cape Town, South Africa
- Randriamanakoto et al. (2013a) Randriamanakoto, Z., Escala, A., Väisänen, P., Kankare, E., Kotilainen, J., Mattila, S., & Ryder, S. 2013a, ApJ, 775, L38
- Randriamanakoto et al. (2013b) Randriamanakoto, Z., Väisänen, P., Ryder, S., Kankare, E., Kotilainen, J., & Mattila, S. 2013b, MNRAS, 431, 554
- Romero-Cañizales et al. (2011) Romero-Cañizales, C., Mattila, S., Alberdi, A., Pérez-Torres, M. A., Kankare, E., & Ryder, S. D. 2011, MNRAS, 415, 2688
- Ryon et al. (2014) Ryon, J. E., Adamo, A., Bastian, N., Smith, L. J., Gallagher, III, J. S., Konstantopoulos, I. S., Larsen, S., Silva-Villa, E., & Zackrisson, E. 2014, AJ, 148, 33
- Sanders et al. (2003) Sanders, D. B., Mazzarella, J. M., Kim, D.-C., Surace, J. A., & Soifer, B. T. 2003, AJ, 126, 1607
- Sargent & Scoville (1991) Sargent, A. & Scoville, N. 1991, ApJ, 366, L1
- Silva-Villa et al. (2014) Silva-Villa, E., Adamo, A., Bastian, N., Fouesneau, M., & Zackrisson, E. 2014, MNRAS, 440, L116
- Silva-Villa & Larsen (2011) Silva-Villa, E. & Larsen, S. S. 2011, A&A, 529, A25
- Sun et al. (2016) Sun, W., de Grijs, R., Fan, Z., & Cameron, E. 2016, ApJ, 816, 9
- Väisänen et al. (2014) Väisänen, P., Randriamanakoto, Z., Escala, A., et al. 2014, Massive Young Star Clusters Near and Far: From the Milky Way to Reionization, 185
- Vavilkin (2011) Vavilkin, T. 2011, PhD thesis, Department of Physics & Astronomy, Stony Brook University, Stony Brook, NY
- Whitmore et al. (2014) Whitmore, B. C., Chandar, R., Bowers, A. S., Larsen, S., Lindsay, K., Ansari, A., & Evans, J. 2014, AJ, 147, 78
- Whitmore et al. (2007) Whitmore, B. C., Chandar, R., & Fall, S. M. 2007, AJ, 133, 1067
- Whitmore et al. (2010) Whitmore, B. C., Chandar, R., Schweizer, F., Rothberg, B., Leitherer, C., Rieke, M., Rieke, G., Blair, W. P., Mengel, S., & Alonso-Herrero, A. 2010, AJ, 140, 75
- Zackrisson et al. (2011) Zackrisson, E., Rydberg, C.-E., Schaerer, D., Östlin, G., & Tuli, M. 2011, ApJ, 740, 13
Appendix A Appendix
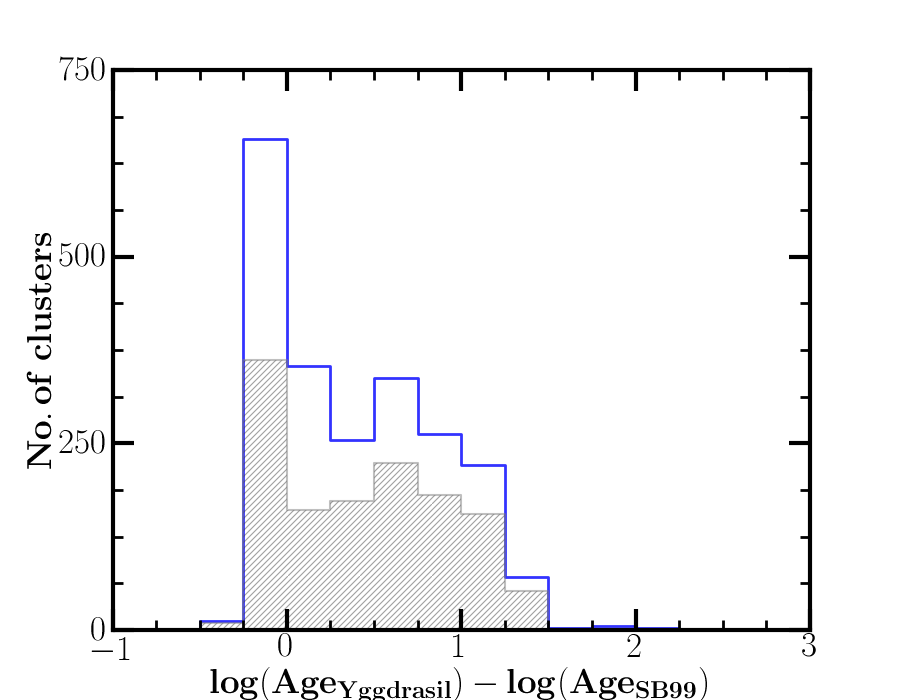
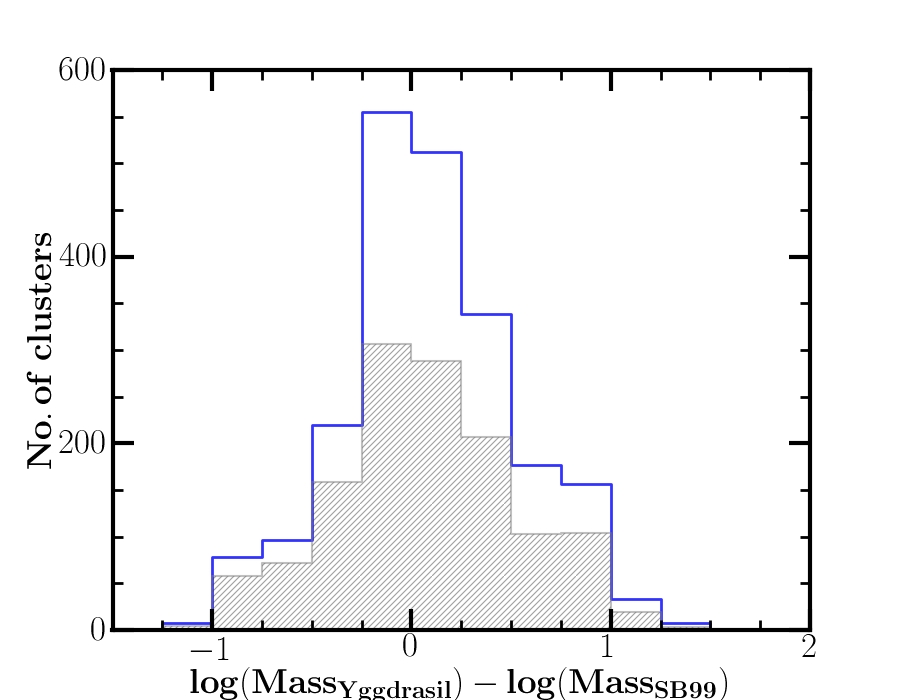
|
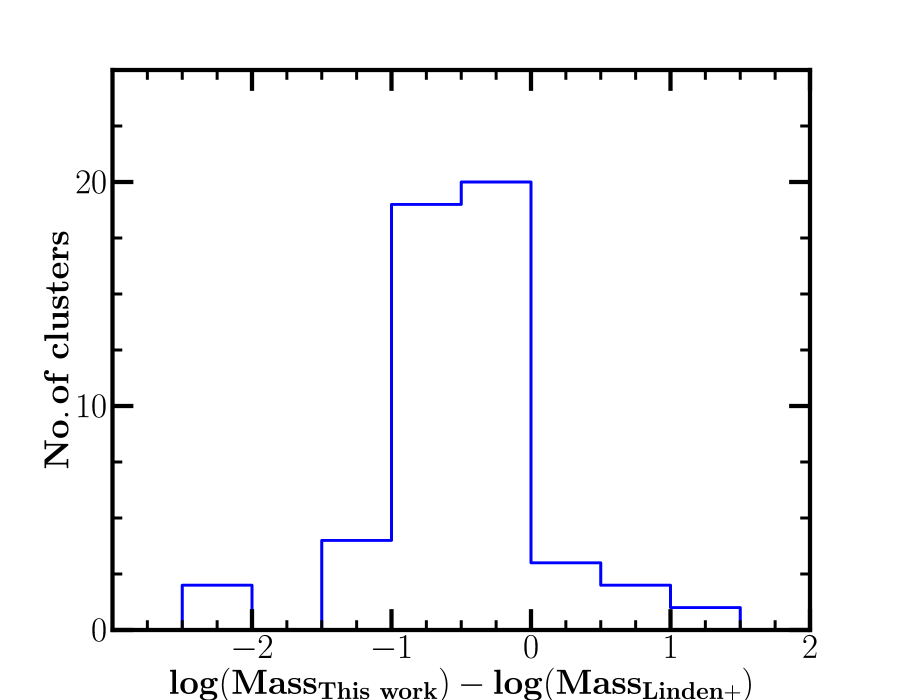
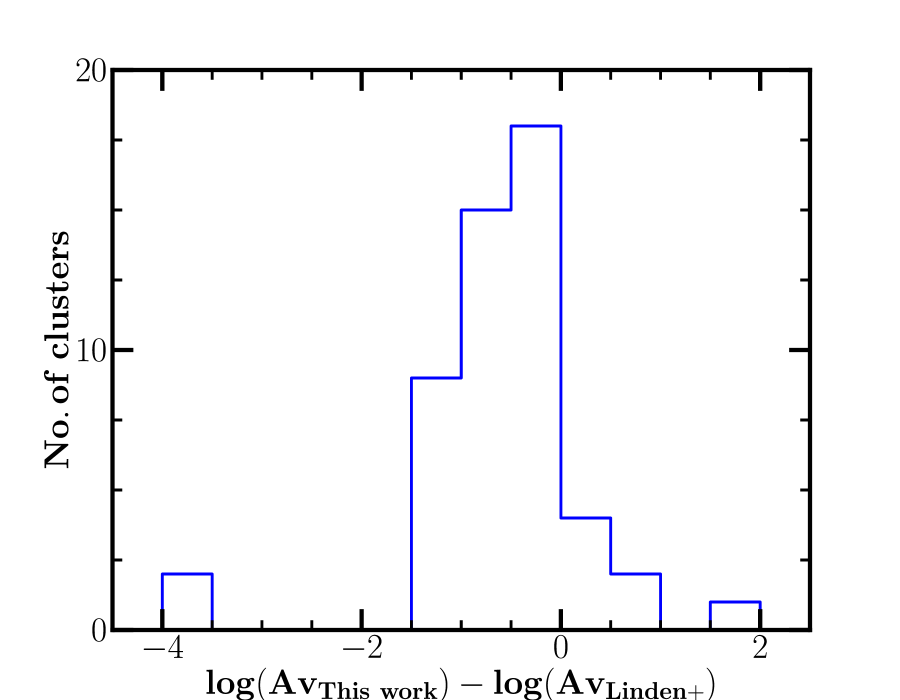
|