Simulation studies of and correlation functions in pp collisions with the PYTHIA and HERWIG models
Abstract
We report studies of charge-independent (CI) and charge-dependent (CD) two-particle differential-number correlation functions, , and transverse momentum () correlation functions, , of charged particles in = 2.76 TeV pp collisions with the PYTHIA and HERWIG models. Model predictions are presented for inclusive charged hadrons (), as well as pions (), kaons (K±), and (anti-)protons (/p) in the ranges , , and , with full azimuthal coverage in the range . We compare the model predictions for the strength and shape of the and correlators as these pertain to recent measurements by the ALICE collaboration. The and correlation functions estimated with PYTHIA and HERWIG exhibit qualitatively similar near-side and away-side correlation structures but feature important differences. Our analysis indicates that comparative studies of and correlation functions would provide valuable insight towards the understanding of particle production in pp collisions, and by extension, should also be useful in studies of heavy-ion collisions. Comparison of the dependence of and could contribute, in particular, to a better understanding and modeling of the angular ordering of particles produced by hadronization in jets, as well as a better description of jet fragmentation functions of identified species at low momentum fraction .
pacs:
25.75.Gz, 25.75.Ld, 24.60.Ky, 24.60.-kI Introduction
Measurements of integral and differential correlation functions constitute essential tools for the study of proton-proton (pp) and heavy-ion (A–A) collisions at relativistic energies. Two- and multi-particle azimuthal correlations functions have provided evidence for the existence of anisotropic flow in A–A collisions Adams et al. (2005a); Adcox et al. (2005); Aamodt et al. (2010, 2012); Chatrchyan et al. (2014); Adam et al. (2016a); Mohapatra (8 15), quark scaling (approximate) of flow coefficients in A–A collisions at RHIC and LHC Adare et al. (2007); Abelev et al. (2015a); Adam et al. (2016b); Aad et al. (2012). They were also used to investigate the presence of flow in smaller systems (e.g., p–A and high multiplicity pp collisions) Esumi (2018); Acharya et al. (2017a); Zhu (2013); Abelev et al. (2014); Bernardes (2017); Sirunyan et al. (2018). Differential two-particle (number) correlation functions additionally enabled the discovery of jet quenching at RHIC Adler et al. (2003); Adare et al. (2008a, a) and its detailed characterization in A–A collisions at both RHIC and LHC Chatrchyan et al. (2011). Several other correlation functions, including number and transverse momentum correlation functions Adams et al. (2005b); Agakishiev et al. (2011) have been measured and investigated both at RHIC and LHC to better understand the particle production dynamics and study the properties of the matter produced in pp and A–A collisions Bass et al. (2000); Pratt et al. (2015); Aggarwal et al. (2010); Adams et al. (2003); Abelev et al. (2013, 2013); Acharya et al. (2018). Among these, the recent measurements of number correlation, , and differential transverse momentum correlation, , defined in Sec. II, have enabled independent confirmation of the collective nature of the azimuthal correlations observed in Pb–Pb collisions Acharya et al. (2017b), as well as the identification of noticeable differences in the and dependence of these correlation functions Acharya et al. (2018). These measurements show that the near-side peak of both CI and CD correlations is significantly narrower, at any given A–A collision centrality in than in correlation functions. This confirms Sharma and Pruneau (2009) that comparative measurements of and correlation functions may provide additional sensitivity to the underlying particle production mechanisms in heavy-ion collisions. In this work, we seek to establish whether the difference observed in Acharya et al. (2018) can be readily explained by jet contributions. To this end, we examine predictions of the and correlation functions by the PYTHIA Sjostrand et al. (2006) and HERWIG Corcella et al. (2001) models that are known to quantitatively reproduce many jet related observables reported and compiled by RHIC and LHC experiments Seymour (1996); Estienne (2008); Abelev et al. (2015b). We examine the differential correlation functions and in pp collisions with a particular focus on particles produced in the range GeV/c reported by ALICE Acharya et al. (2017b, 2018) but also extend our study to include higher momentum ranges to further examine how the two observables behave for higher particle momenta expected to be dominated by jet production.
Particle production in high-energy nucleus-nucleus collisions is governed by several conservation laws including (electric) charge conservation, baryon number conservation, strangeness conservation, as well as energy-momentum conservation. At very large collision energy, the yield of anti-particles and particles are nearly equal. Limited information is thus gained by studying the yields, e.g., and individually. Additional insight may be provided, however, by comparative studies of like-sign (LS) and unlike-sign (US) particle pairs, e.g., and , or baryon-baryon and baryon-anti-baryon particle pairs. We thus study predictions of the models for both charge-independent (CI) and charge-dependent (CD) pair combinations.
This paper is organized as follows. Section II presents definitions of the and correlation functions studied in this work and describes how they are computed. The PYTHIA and HERWIG models, and the conditions under which they were used to generate pp events, are briefly described in Sec. III. Predictions by the models for and correlation functions are presented in Sec. IV and conclusions are summarized in Sec. V.
II Correlation functions definition
The and correlation functions are defined in terms of single- and two-particle densities expressed as functions of the particle pseudo-rapidity and azimuthal angle
| (1) | |||||
| (2) |
where and are single and two-particle cross-sections, respectively. The correlator is defined as a two-particle cumulant normalized by the product of single-particle densities (hereafter called normalized two-particle cumulant) according to
| (3) |
while the correlation function is defined in terms of the differential correlator normalized by the square of the average transverse momentum, , to make it dimensionless, as follows
| (4) |
The differential correlator Sharma and Pruneau (2009) is defined according to
| (5) |
where and is the inclusive mean transverse momentum
| (6) |
In addition to its sensitivity to the presence of particle correlations, is also determined by the momentum of the correlated particles Acharya et al. (2017b). It is positive whenever particle pairs emitted at specific azimuthal angle and pseudo-rapidity differences are more likely to both have transverse momenta higher (or lower) than the and negative when a high- particle () is more likely to be accompanied by a low- particle (). For instance, particles emitted within a jet typically have higher than the inclusive average. Jets, therefore, contribute a large positive value to . Hanbury-Brown and Twiss (HBT) correlations, determined by pairs of identical particles with should likewise contribute positively to this correlator. However, particle production involving a mix of low- and high-momenta correlated particles can contribute both positively and negatively. Based on this simple observation, one expects the internal structure of jets to influence the , dependence of the near-side peak of correlation functions.
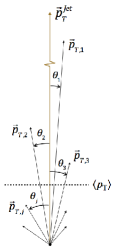
Within jets, as schematically illustrated in Fig. 1, high- particles are predominantly emitted at small polar angles relative to the jet axis, while lower particles span a larger angular range. This leads to an effective ordering of the particles (typical) relative to the polar angle . In turn, this also leads to an effective ordering in the vs. plane. For instance, one expects that for small , separations, high- particles (i.e., ) should dominate the correlation and contribute positive values. Likewise, at very large , separation, the correlation strength should be determined by particle pairs with thereby also yielding positive values. However, there shall also be an intermediate , range such that pairs consist of one high- particle and one low- particle yielding negative values on average. This should thus produce a narrowing and possibly a non-monotonic , dependence of the correlation strength. We shall demonstrate, in the following, that both PYTHIA and HERWIG do in fact exhibit such behavior.
In this work, the correlators and are reported as function of the differences and by averaging across the mean pseudo-rapidity and the mean azimuthal angle acceptance according to
| (7) | |||
where represents the width of the acceptance in at a given value of and angle differences are calculated modulo and shifted by for convenience of representation in the figures. The analysis of the and correlation functions are carried out for charge combination pairs , , , and separately. Like-sign pairs correlations are averaged to yield LS correlations, , and US correlators are obtained by averaging and correlations, . The LS and US correlations are then combined to yield charge-independent and charge-dependent correlation functions according to
| (8) | |||||
| (9) |
The CI correlation function measures the
average of all correlations between charged particles while the CD
correlation function is sensitive to the difference of US and
LS pairs and is largely driven, as such, by charge conservation
effects. The CD correlation function is proportional to the
charge balance function Bass et al. (2000) when the
yields of positive and negative particles are equal Pruneau et al. (2002).
We repeated the analysis and used the sub-sampling technique to obtain a more accurate estimation of statistical uncertainty. The Monte Carlo data sample was divided into 10 segments of equal size— e.g. equal number of events. Each sub-sample was analyzed independently. We then extracted the mean values and calculated the sample standard deviations () according to
| (10) |
where “N-1” used instead of “N” depending on Bessel’s correction and , where i= 1,2,…10. The error on the mean is calculated bin-by-bin using the general formula .
III Monte Carlo Models
The impact of jet production on and correlation functions in pp is studied with Monte Carlo simulations carried out with the event generators PYTHIA 6.425, tune Perugia-0 Sjostrand et al. (2006); Skands (2010); Sjöstrand and Skands (2005); Sandhoff and Skands (2006); Buckley et al. (2010), and HERWIG 6.5 Corcella et al. (2001). PYTHIA and HERWIG are both based on QCD at Leading Order (LO) but use different parton production and hadronization schemes. PYTHIA uses the Lund string fragmentation model for high- parton hadronization while the production of soft particles (i.e., the underlying event) is handled through fragmentation of mini-jets from initial and final state radiation, multiple parton interactions (MPI), and proton remnants Andersson et al. (1983). The kPyJets process responsible for jet production uses the CTEQ6l Pumplin et al. (2002) parametrization of the proton parton distribution function (PDF) tuned for LHC energies. HERWIG events were generated based on the jet generation process 1500 Corcella et al. (2001) and the CTEQ5L Lai et al. (2000) parametrization of the proton PDFs with hard color-singlet exchange between two partons Mueller and Tang (1992) using leading-logarithmic (LL) BFKL Salam (1999) calculations in ALICE environment. In HERWIG, the perturbative parton evolution ends with the production of clusters subsequently decayed into final-state hadrons.
In order to study the correlation functions with reliable statistical accuracy, and given the jet production cross-section falls steeply with increasing transverse momentum, we generated equal number of PYTHIA and HERWIG events in three hard QCD ( processes) bins: 5.0 - 10.0 GeV/c, 10.0 - 20.0GeV/c, and 20.0 - 30.0 GeV/c Diaz et al. (2011). A total of events were generated with PYTHIA and HERWIG events were produced in each bins. Single- and two-particle densities were calculated independently in each bin and averaged with weights corresponding to their respective fractional cross-sections.
Charge, baryon number, or strangeness balance function Bass et al. (2000) are of interest to study the role of conservation laws and the dynamics of particle transport in elementary and heavy-ion collisions. However, charge balance functions should be proportional and thus equivalent to the correlator provided the measured multiplicities of positively and negatively charged particles are equal. We verified the applicability of the equivalence by comparing the differential cross-sections of positively and negatively charged hadrons, , and found that the ratio of cross-sections is of order unity in the range of interest of this study. It is then legitimate to use the correlation function as a proxy for the balance function: balance functions are thus not explicitly reported in this study.
IV Model predictions
We begin with a discussion of unidentified charged hadron correlation functions in sec. IV.1. Correlation functions for identified particles, e.g., pions, kaons, and protons, are presented in sec. IV.3.
IV.1 Inclusive charged hadron correlations
We focus our discussion on CI and CD correlation functions. Associated balance functions, , can be obtained by multiplying correlation functions with integrals of the hadron cross-sections. Figure 2 illustrates the calculation of CI and CD correlation functions based on the correlators and . Panels (a,b) present examples of these correlation functions calculated with PYTHIA for particles in the transverse momentum range GeV/c and pseudo-rapidity range . The US and LS correlation functions are combined according to Eqs. (8) and (9) to obtain CI and CD correlation functions shown in panels (c,d) of the same figure.
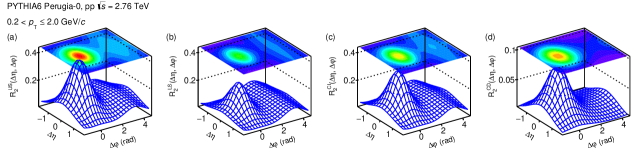
The US and LS correlation functions both feature a prominent near-side peak centered at . One notes, however, that the peak observed in US correlation functions is taller than that observed in LS correlation functions. This leads to a modest and narrow near-side peak in the CD correlation function shown in panel (d). The amplitude and shape of this peak are determined by the (charge) pair production and hadronization processes. We show in this article that PYTHIA and HERWIG make quantitatively different predictions of these features. Measurements of correlation functions shall thus provide a valuable basis to test the underlying mechanisms used in these models for pair creation and hadronization of partons into hadrons, .
IV.1.1 Charge Independent Correlations
We first compare the and correlation functions for CI charge combinations obtained in simulations of pp collisions with the PYTHIA and HERWIG generators. Figures 3 and 4 present the and correlation functions, respectively.
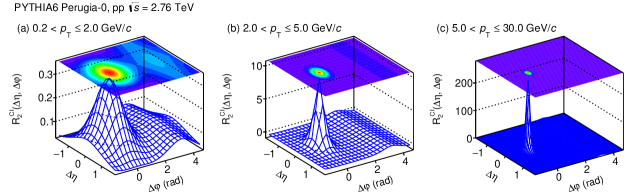
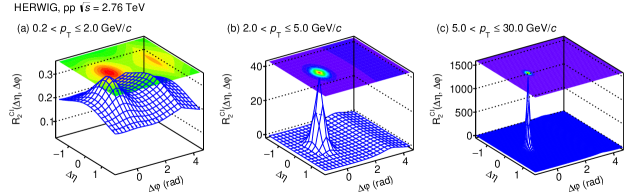
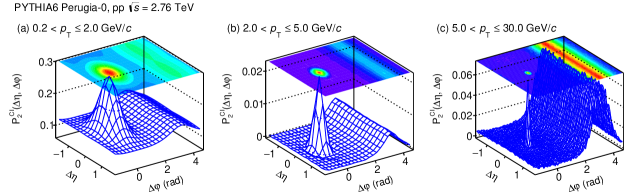
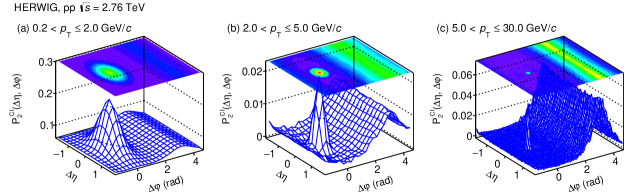
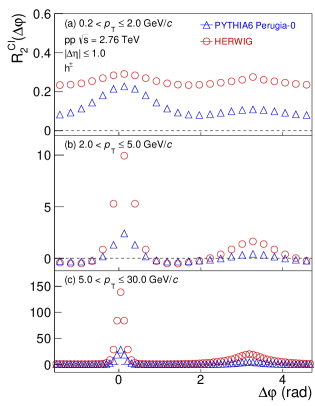
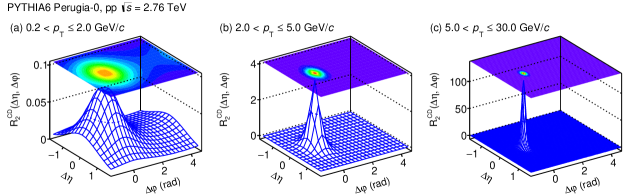
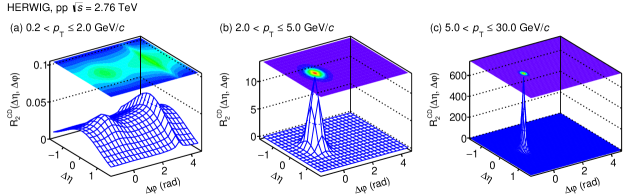
Correlation functions are presented for unidentified charged hadrons calculated in momentum ranges: (i) GeV/c, (ii) GeV/c, and (iii) GeV/c. In these and the following figures, the values used for the calculation of are the averages of particles produced in each of these three ranges, respectively. The first momentum range samples the underlying event in pp collisions and is relevant for comparisons with bulk particle production in A–A collisions. The second range corresponds to the coalescence range Csizmadia et al. (1999); Molnar and Voloshin (2003), while the third range shifts the focus on particles produced by jet fragmentation. We find calculations of the and correlation functions in these three ranges yield qualitatively similar results. However, they also exhibit interesting quantitative differences which we discuss in details, in the following, based on projections onto the and axes. The and correlation functions feature a prominent near-side peak centered at as well as an away-side structure, centered at , and extending across the range (truncated in the figure to avoid the fluctuations at larger ). Such near-side and away-side features have been observed in triggered and non-triggered correlation function measured in a variety of collision systems and beam energies Acharya et al. (2017b, 2018); Adare et al. (2008a); Zhu (2013); Adams et al. (2007); Abelev et al. (2009); Adare et al. (2008b). In this work, we study the predictions of the PYTHIA and HERWIG models relative to their dependence on the particle momenta, the particle species, and we focus, in particular, on the differences between and correlation functions.
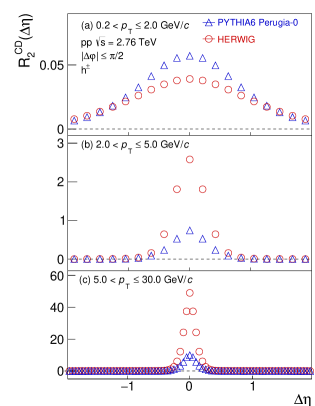
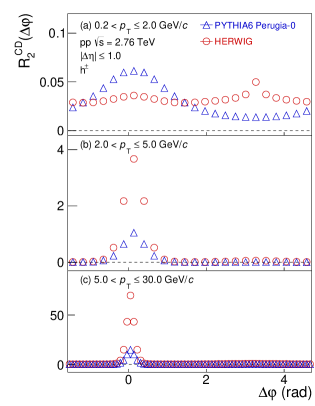
In Figs. 3 and 4, one observes the longitudinal and azimuthal widths of the near-side peak of the and correlation functions predicted by the two models decrease monotonically with the range of the particles. Additionally, the near-side peak of correlations are systematically narrower than those observed in the correlation functions, as reported by the ALICE collaboration Acharya et al. (2017b, 2018). These differences are studied quantitatively based on the projections of the correlation functions onto the and axes presented in Figs. 5 and 6.
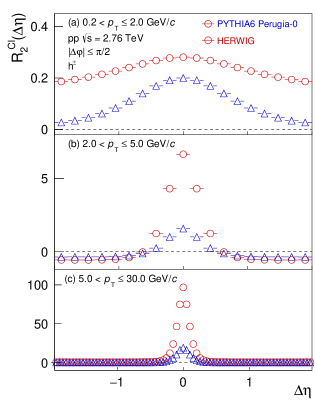
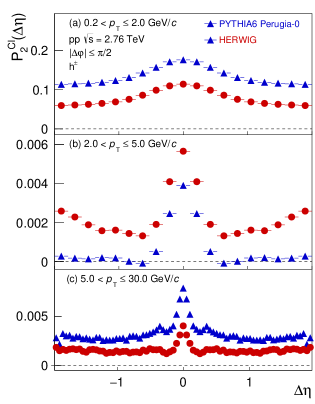
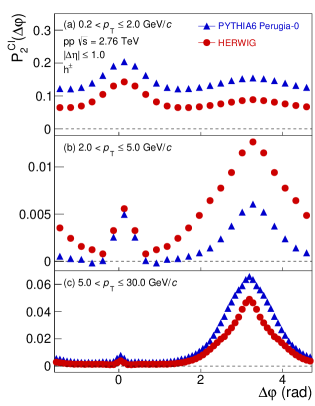
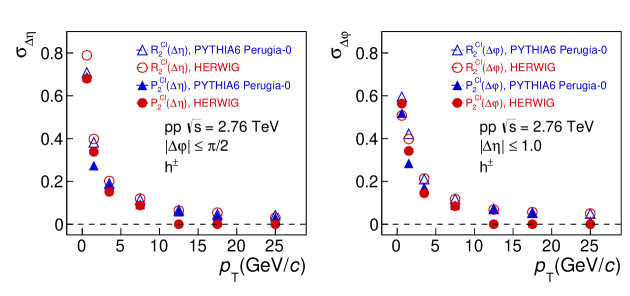
Projections of the and correlation functions onto the axis calculated with the PYTHIA and HERWIG models are presented in the left and right panels of Fig. 5, respectively, for the three ranges already considered. One observes that the models make quantitatively different predictions for both correlation functions in all three ranges. Indeed, both models yield peaks centered at ( but the shape and strength of these peaks differ markedly across models. The strengths and widths of the peaks also evolve differently with . One notes, additionally, that the calculations for exhibit quite noticeable differences with : they feature narrower peaks and different ordering in the strengths predicted by the models. The RMS widths of these projections are plotted in Fig. 12 and discussed in more details in sec. IV.2. It is clear at the outset, however, that measurements of both and in pp collisions with different ranges should in principle provide significant constraints on the models and their underlying particle production mechanisms.
Caution in the interpretation of the widths of the near-side peak of the correlation functions is needed, however, because of the complicated dependence of the correlation strength on the distance to the centroid of the peak. One observes, in particular, that the correlation strength of exhibits an undershoot, in both and projections, in the range 2.0 - 5.0 , and a longer range oscillatory behavior in projections of along in the range 5.0 - 30.0 , as expected from the angular ordering of particle discussed in sec. II. While difficult to resolve, a hint for the existence of such undershoot feature has already been reported in Acharya et al. (2018). The presence of this undershoot stems from the explicit dependence of the correlator on the particles’ transverse momentum deviation from the mean, i.e., . At short angular distance (both longitudinally and azimuthally), jet particles have momenta that tend to exceed the mean and thus contribute positively, on average, to the correlator. The presence of the undershoot indicates that there is an angular range within which the product is negative on average in PYTHIA events, but shifted in HERWIG events. The shift observed in HERWIG events likely results from larger event-by-event multiplicity fluctuations. At large angular separation, both particles tend to have below the and thus contribute positively to the correlator. The peak and oscillatory behavior are thus determined by the and angular ordering of the jet constituents. Given PYTHIA and HERWIG produce particles using a different ordering, they are expected and indeed observed to yield different shapes for the correlation function. By contrast, the correlation function receives positive definite contributions from all particle pairs of a jet and is thus not sensitive to the ordering of the particles of the pair but only the overall width of the jet. Measurements of and correlation functions in p–Pb and Pb–Pb collisions shall thus provide better discriminants of the parton splitting and hadronization mechanisms at play in jet fragmentation as well as in the generation of the underlying event.
The and correlations also exhibit stark differences on the away-side, i.e., at . Inspection of the away-side of the (Fig. 3) and correlation functions (Fig. 4), and their projections (Fig. 6) reveal the two correlators yield a rather different response to the away-side jet. Indeed, the away-side jet yields a relatively modest ridge-like structure at in correlation functions but produces a very large amplitude away-side in . One also finds that PYTHIA and HERWIG produce away-side ridges with different shapes and strengths as well as quantitatively different dependence. Comparative measurements of the and correlators in different particle momentum ranges in pp collisions should thus provide additional insight and constraints on the hadronization mechanisms implemented in these models.
IV.1.2 Charge Dependent Correlations


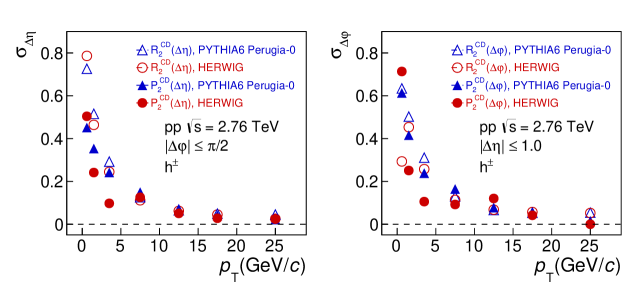
These were obtained by subtraction of the LS correlations from the US correlations according to Eq. (9). As such, they emphasize the role of charge conservation in particle production. Correlation functions (and similarly charge balance functions) indeed provide signatures of the charged particle pair production and transport in pp and A–A collisions. For instance, at momenta in excess of 2.0 GeV/c, as shown in Fig. 7 (b,c), one observes the correlator features an isolated peak centered at resulting from the fact that correlated charged particle production occurs almost exclusively within the confines of a single jet.
The width of the peak decreases monotonically with increasing particle momentum owing to the Schwinger mechanism and angular ordering discussed in sec. II. At lower momenta, however, correlated charged pair production may occur over a wider range of angles, even back-to-back, as illustrated by the very sharp and narrow away-side ridge predicted by HERWIG in the range GeV/c. The correlation functions obtained with PYTHIA (top panels) and HERWIG (bottom panels) for particles in the range GeV/c indeed feature a more complicated shape involving both a near-side peak and an away-side structure. In this case, one notes that PYTHIA and HERWIG produce very different predictions, owing most likely to their different implementation of the underlying event. Additionally note, as exemplified in Fig. 7, that the shape and strength of exhibit a strong dependence on the produced hadron multiplicity. Measurements of in pp collisions for various momentum and produced particle multiplicity ranges shall then provide very useful constraints in the tuning of these models.
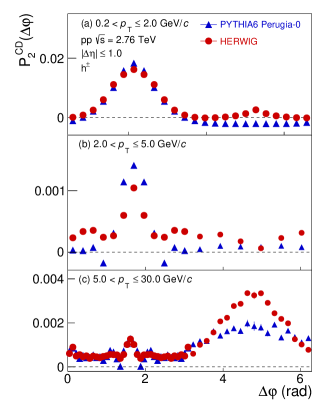
The PYTHIA and HERWIG predictions for correlation
functions, shown in Fig. 9, indicate this correlator is also of interest
to probe the internal structure of jets and the charge production
ordering. With PYTHIA, the near-side peak of the
correlation functions is significantly narrower than its counterpart in the
lowest range considered, but somewhat
wider at higher . By contrast, HERWIG’s predictions of
features a somewhat narrower near-side peak in all
three momentum ranges. One also notes that the near-side predicted by
PYTHIA and HERWIG have different shapes, widths, and a somewhat
complicated dependence on the of the particles. One finds
additionally that the away-side of correlation
functions feature a large amplitude for high- particles. This is
in stark contrast to the correlation functions that
feature an almost flat away-side yield. Such a small away-side yield is expected in owing to the fact that particle
production above GeV/c is dominated by jet
fragmentation.
Given charge is conserved locally in the jet
fragmentation process, one can expect, on general grounds, that charge
correlations between jets, if any, are driven primarily by the charge
of the parton that initiate the jets. Quark jets may be charge
correlated but jets initiated by gluons should not be, at least to
first order. Measurements of the away-side strength
thus provide an additional tool to probe the nature of the jets
measured in pp and A–A collisions. Indeed, back-to-back gluon jets should
yield no contributions to the away-side of
correlation functions but quark-quark jet pairs should have a finite
CD correlation. The measured away-side yield of
correlation functions may thus provide a new tool to determine the
origin and nature of jets measured in elementary collisions.
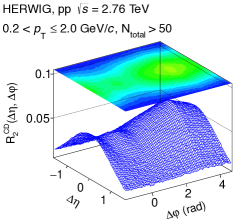
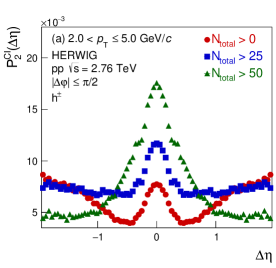
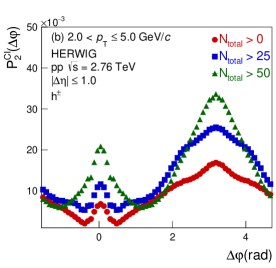
We note that the correlator computed with HERWIG in the range GeV/c, shown in Fig. 7, features a narrow elongated structure at . This structure likely corresponds to underlying event particle pairs emitted back-to-back in the laboratory frame and are likely produced in excess given such a structure is not observed in data reported by the ALICE collaboration Acharya et al. (2018). We find, however, that contributions of such pairs to the correlator are suppressed in HERWIG events featuring a total particle multiplicity > 50 in the fiducial acceptance, as shown in Fig. 8. An experimental investigation of and correlation functions as a function of pp collision multiplicity is thus of obvious interest to elucidate the role and interplay of underlying events and multi-jet production in these collisions.
IV.2 Transverse momentum dependence of the width of the CI and CD near-side peaks
We study the evolution of the RMS widths of the near-side peaks of the and correlation functions obtained with PYTHIA and HERWIG. The and RMS widths are calculated according to
| (11) | |||||
| (12) |
where represent the strength of the correlation functions in bins and and the sums on covers the acceptance of the simulation, whereas the sums on are limited to exclude the away-side ridge. Offsets are used to suppress negative correlation values and eliminate trivial width values determined by the breadth of the acceptance. They are obtained by taking the average of three bins at the edge of the acceptance, i.e., at = 2.0 for projections, and at the minimum of the correlations, near = -, for projections. The three-bin average technique is also used for calculating offsets whenever undershoots are present in correlators.
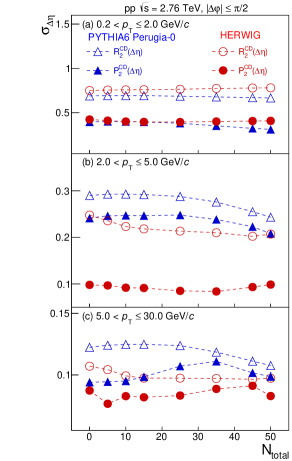
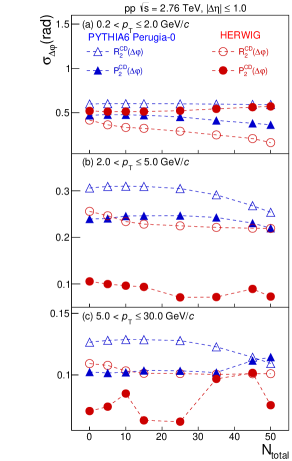
Figures 12 and 13 present plots of the evolution of the and widths of the near-side peak of CI and CD correlators as a function of . Overall, one finds the widths decrease with rising . However, widths obtained with PYTHIA exhibit a smooth and monotonic behavior with increasing particle whereas widths obtained from HERWIG exhibit a more complicated dependence. This study reveals an interesting case where the width is broader than that of in some ranges, in stark contrast with the results reported in Acharya et al. (2018).
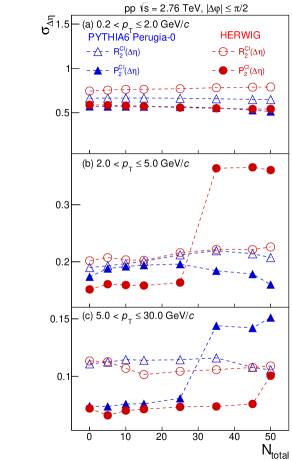
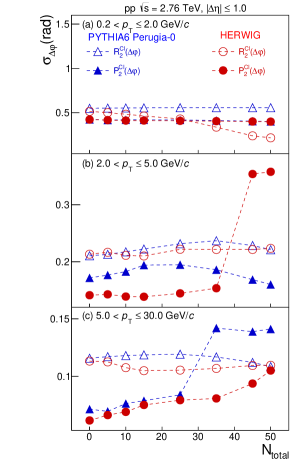
In order to further understand the structures observed in and correlation functions presented in Fig. 3 - 9, we study, in Figs. 14 and 15, the evolution of the near-side peak of the correlators as a function of the total particle multiplicity . We find that the longitudinal and azimuthal widths, and , of the , , and correlators are slowly varying functions of , with largest dependence observed for the width predicted by HERWIG for particles in the range GeV/c. The widths of the correlator, on the other hand, exhibit a more complicated dependence on . One observes, indeed, that the widths extracted both from PYTHIA and HERWIG exhibit a discontinuity near or above , thereby signaling a drastic change in the shape of these correlation functions between low and high multiplicity events. The shape dependence on is illustrated in Fig. 16. Events of low multiplicity feature correlator with a clear undershoot structure, yielding narrow widths in both the longitudinal and azimuthal directions. As argued above, the undershoot structure is associated with the production of pairs featuring but multiplicity fluctuations shift the correlator, globally, to positive values. The number of such pair combinations is manifestly reduced, however, for collisions with large . These consequently do not feature an undershoot behavior and thus produce a broad near-side peak. This behavior likely stems from the fact that high-multiplicity events favor gluon jets. These are less collimated than quark jets and feature softer particles on average Kim et al. (1989). Evidently, such variations are not possible with the correlators. We thus conclude that the correlator constitutes a more discriminating probe of the correlation structure of jets and their underlying events than the correlator.
IV.3 Identified charged hadron correlations
Experimental studies at the ISR, FNAL, and the LHC have shown that jet fragmentation functions of identified species vary appreciably between mesons and baryons as well as with their quark content (Tanabashi et al. (2018) and references therein). Unfortunately, measuring the fragmentation functions of identified hadron species within jets is a statistically onerous and difficult task, specially for high- particles in high-energy jets. Measuring the strength and shape of , , , and correlation functions of identified high- hadrons, however, may provide an invaluable proxy to such studies. We proceed to substantiate this hypothesis by studying the shape and strength of identified hadron correlation functions based on predictions by the PYTHIA and HERWIG models. Figures 17 and 18 respectively display and correlation functions calculated with PYTHIA for , and , in the range 0.2 < 2.0 .
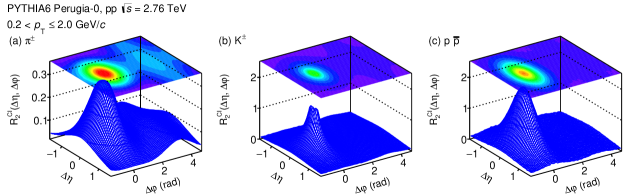
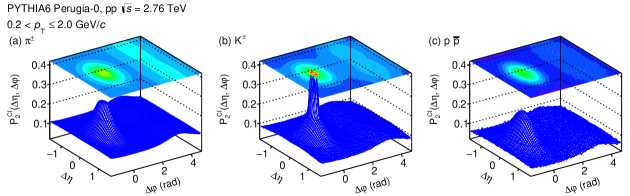
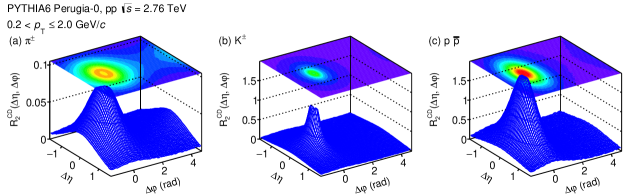
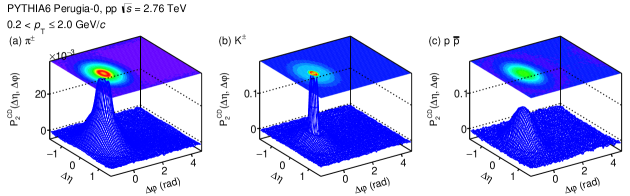
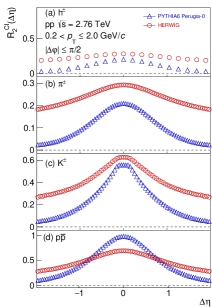
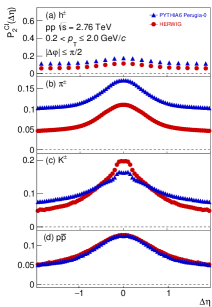
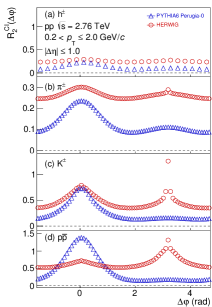
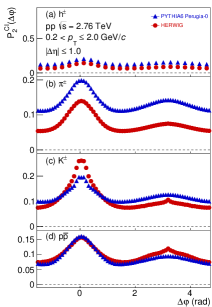
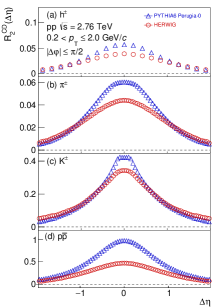
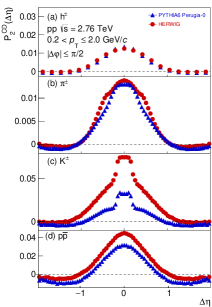
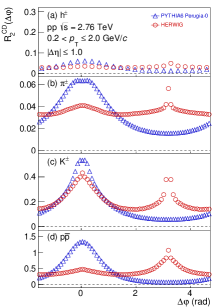
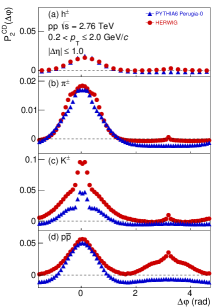
Again in the case of identified particles, one observes that the width of the near-side peak of the correlator is significantly narrower than its counterpart. However, the shape and width of these two correlators do not exhibit a monotonic dependence on the mass of the particles. For kaons, in particular, both and feature a near-side peak that might be perhaps best described by a superposition of a wide and a narrow Gaussian peak, which arises, in part, from a strong admixture of -meson decays. A similar situation arises for and shown in Figs. 19 and 20, respectively. One finds, for all three particle species, that the near-side peak of the correlators are markedly narrower than their counterparts. One also observes that the kaon near-side peaks are much narrower than those of pions and protons. It is also worth noticing that the pion correlator shows a rather large away-side amplitude (relative to its near-side peak amplitude) while kaons and protons feature much smaller relative away-side amplitudes for this correlator. By contrast, all three species have a flat and nearly vanishing away-side amplitude in within PYTHIA simulations (Fig. 20) for particles within 0.2 < 2.0 GeV/c. Qualitatively similar conclusions are obtained from calculations of the and correlators with HERWIG in this momentum range (2D plots not shown). Indeed, projections of the and correlation functions obtained with PYTHIA and HERWIG, shown in Figs. 21-24, illustrate that while the predictions of the two models are qualitatively similar, they differ quantitatively for the three particle species considered. It is very difficult to study this in other regions for RMS width calculation because of large oscillating behavior in in the range 2.0 - 5.0 . An actual measurement of such correlation functions (possible at the LHC with the ALICE detector) shall thus provide significant constraints to tune these models and achieve a better understanding of particle production processes in elementary particle collisions.
V Summary
We presented a study of charge-independent and charge-dependent two-particle differential- number correlation functions and transverse momentum correlation functions in pp collisions at = 2.76 TeV with the PYTHIA and HERWIG Monte Carlo models. Calculations were presented for unidentified hadrons as well as for , and individual species in selected ranges of transverse momentum. PYTHIA and HERWIG both qualitatively reproduce the near-side peak and away-side ridge correlation features reported by experiments. At low , both models produce narrower near-side peaks in correlations than in as reported by the ALICE collaboration in p–Pb and Pb–Pb collisions Acharya et al. (2018). This suggests that the narrower shape of the near-side peak is largely determined by the dependent angular ordering of hadrons produced in jets, as discussed in sec. II. We have provided detailed calculations of the longitudinal and azimuthal widths of the near-side peak as a reference to prospective experimental studies of these correlation functions. Both PYTHIA and HERWIG predict widths that decrease with increasing . Widths extracted for correlators are typically significantly narrower than those of the counterparts. We also showed that the models predict non-trivial dependence on the mass of identified particles arising in part from resonance decays.
We additionally find that the models produce large amplitude ridge structures at in correlation functions while yielding relatively modest ridges in . The amplitude of the ridge structure in is found to increase with the particle range considered reaching rather large amplitude for particles in the range. An away-side ridge is also observed in correlation functions. The magnitude of this ridge shall depend on jet-to-jet charge correlations. Measurements of correlation functions of high- particles in pp collisions might then be sensitive to the charge of the partons initiating the observed jets. Elucidation of this conjecture, however, requires further studies, with both PYTHIA and HERWIG, of the correlation functions obtained when jet production is restricted to gluon-gluon or quark-quark processes.
Acknowledgements
The authors thank Drs. Joern Putschke and Sidharth Prasad for fruitful discussions and their invaluable review of the manuscript. This work was supported in part by the United States Department of Energy, Office of Nuclear Physics (DOE NP), United States of America, under grant No. DE-FOA-0001664, and the Department of Science and Technology(DST), Government of India, under grants No. SR/MF/PS-01/2014-IITB and SR/MF/PS-02/2014-IITM, as well as the University Grants Commission(UGC), Government of India, under the Code No. BININ00401340.
References
- Adams et al. (2005a) J. Adams et al. (STAR Collaboration), Nucl. Phys. A757, 102 (2005a), arXiv:nucl-ex/0501009 [nucl-ex] .
- Adcox et al. (2005) K. Adcox et al. (PHENIX Collaboration), Nucl. Phys. A757, 184 (2005), arXiv:nucl-ex/0410003 [nucl-ex] .
- Aamodt et al. (2010) K. Aamodt et al. (ALICE Collaboration), Phys. Rev. Lett. 105, 252302 (2010), arXiv:1011.3914 [nucl-ex] .
- Aamodt et al. (2012) K. Aamodt et al. (ALICE Collaboration), Phys. Lett. B708, 249 (2012), arXiv:1109.2501 [nucl-ex] .
- Chatrchyan et al. (2014) S. Chatrchyan et al. (CMS Collaboration), JHEP 02, 088 (2014), arXiv:1312.1845 [nucl-ex] .
- Adam et al. (2016a) J. Adam et al. (ALICE Collaboration), Phys. Lett. B B762, 376 (2016a), arXiv:1605.02035 [nucl-ex] .
- Mohapatra (8 15) S. Mohapatra, Measurement of the azimuthal anisotropy for charged particle production in Pb–Pb collisions at =2.76 TeV and in p–Pb collisions at =5.02 TeV with the ATLAS detector at the LHC, Ph.D. thesis, SUNY, Stony Brook (2013-08-15).
- Adare et al. (2007) A. Adare et al. (PHENIX Collaboration), Phys. Rev. Lett. 98, 162301 (2007).
- Abelev et al. (2015a) B. B. Abelev et al. (ALICE Collaboration), JHEP 06, 190 (2015a), arXiv:1405.4632 [nucl-ex] .
- Adam et al. (2016b) J. Adam et al. (ALICE Collaboration), JHEP 09, 164 (2016b), arXiv:1606.06057 [nucl-ex] .
- Aad et al. (2012) G. Aad et al. (ATLAS Collaboration), Phys. Rev. C86, 014907 (2012), arXiv:1203.3087 [hep-ex] .
- Esumi (2018) S. Esumi (PHENIX Collaboration), Proceedings, 11th International Workshop on Critical Point and Onset of Deconfinement (CPOD 2017): Stony Brook, NY, USA, August 7-11, 2017, PoS CPOD2017, 018 (2018).
- Acharya et al. (2017a) S. Acharya et al. (ALICE Collaboration), Eur. Phys. J. C77, 569 (2017a), arXiv:1612.08975 [nucl-ex] .
- Zhu (2013) X. Zhu (ALICE), in Proceedings, Workshop on Hadron Nuclear Physics (HNP 2013): Zhangjiajie, China, July 18-22, 2013 (2013) arXiv:1311.2394 [hep-ex] .
- Abelev et al. (2014) B. B. Abelev et al. (ALICE Collaboration), Phys. Rev. C90, 054901 (2014), arXiv:1406.2474 [nucl-ex] .
- Bernardes (2017) C. Bernardes (CMS Collaboration), Proceedings, 2017 European Physical Society Conference on High Energy Physics (EPS-HEP 2017): Venice, Italy, July 5-12, 2017, PoS EPS-HEP2017, 155 (2017).
- Sirunyan et al. (2018) A. M. Sirunyan et al. (CMS Collaboration), Phys. Rev. Lett. 121, 082301 (2018), arXiv:1804.09767 [hep-ex] .
- Adler et al. (2003) C. Adler et al. (STAR Collaboration), Phys. Rev. Lett. 90, 082302 (2003), arXiv:nucl-ex/0210033 [nucl-ex] .
- Adare et al. (2008a) A. Adare et al. (PHENIX Collaboration), Phys. Rev. C 77, 011901 (2008a).
- Chatrchyan et al. (2011) S. Chatrchyan et al. (CMS Collaboration), Phys. Rev. C84, 024906 (2011), arXiv:1102.1957 [nucl-ex] .
- Adams et al. (2005b) J. Adams et al. (STAR Collaboration), Phys. Rev. C72, 044902 (2005b), arXiv:nucl-ex/0504031 [nucl-ex] .
- Agakishiev et al. (2011) H. Agakishiev et al. (STAR Collaboration), Phys. Lett. B704, 467 (2011), arXiv:1106.4334 [nucl-ex] .
- Bass et al. (2000) S. Bass, P. Danielewicz, and S. Pratt, Phys.Rev.Lett. 85, 2689 (2000), arXiv:0005044 [nucl-th] .
- Pratt et al. (2015) S. Pratt, W. P. McCormack, and C. Ratti, Phys. Rev. C 92, 064905 (2015).
- Aggarwal et al. (2010) M. M. Aggarwal et al. (STAR Collaboration), Phys. Rev. C82, 024905 (2010), arXiv:1005.2307 [nucl-ex] .
- Adams et al. (2003) J. Adams et al. (STAR Collaboration), Phys. Rev. Lett. 90, 172301 (2003), arXiv:nucl-ex/0301014 [nucl-ex] .
- Abelev et al. (2013) B. Abelev et al. (ALICE Collaboration), Phys. Lett. B723, 267 (2013), arXiv:1301.3756 [nucl-ex] .
- Acharya et al. (2018) S. Acharya et al. (ALICE Collaboration), “Two particle differential transverse momentum and number density correlations in p-Pb and Pb-Pb at the LHC,” (2018), arXiv:1805.04422 [nucl-ex] .
- Acharya et al. (2017b) S. Acharya et al. (ALICE Collaboration), Phys. Rev. Lett. 118, 162302 (2017b), arXiv:1702.02665 [nucl-ex] .
- Sharma and Pruneau (2009) M. Sharma and C. A. Pruneau, Phys. Rev. C79, 024905 (2009), arXiv:0810.0716 [nucl-ex] .
- Sjostrand et al. (2006) T. Sjostrand, S. Mrenna, and P. Skands, JHEP 05, 026 (2006), arXiv:0603175 [hep-ph] .
- Corcella et al. (2001) G. Corcella, I. Knowles, G. Marchesini, S. Moretti, K. Odagiri, P. Richardson, M. Seymour, and B. Webber, JHEP 0101, 010 (2001), arXiv:0011363 [hep-ph] .
- Seymour (1996) M. H. Seymour, AIP Conference Proceedings 357, 568 (1996), https://aip.scitation.org/doi/pdf/10.1063/1.49625 .
- Estienne (2008) M. Estienne, Phys.Atom.Nucl. 71, 1535 (2008), arXiv:0810.1698 [nucl-ex] .
- Abelev et al. (2015b) B. Abelev et al. (ALICE Collaboration), Phys. Rev. D91, 112012 (2015b).
- Pruneau et al. (2002) C. Pruneau, S. Gavin, and S. Voloshin, Phys. Rev. C66, 044904 (2002), arXiv:0204011 [nucl-ex] .
- Skands (2010) P. Z. Skands, Phys. Rev. D82, 074018 (2010), arXiv:1005.3457 [hep-ph] .
- Sjöstrand and Skands (2005) T. Sjöstrand and P. Skands, Eur. Phys. J. C39, 129 (2005), arXiv:0408302 [hep-ph] .
- Sandhoff and Skands (2006) M. Sandhoff and P. Skands, in Physics at TeV colliders. Proceedings, Workshop, Les Houches, France, May 2-20, 2005, 234 (2006) arXiv:hep-ph/0604120 [hep-ph] .
- Buckley et al. (2010) A. Buckley, H. Hoeth, H. Lacker, H. Schulz, and J. E. V. Seggern, Eur. Phys. J. C65, 331 (2010), arXiv:0907.2973 [hep-ph] .
- Andersson et al. (1983) B. Andersson, G. Gustafson, G. Ingelman, and T. Sjostrand, Phys. Rept. 97, 31 (1983).
- Pumplin et al. (2002) J. Pumplin, D. Stump, J. Huston, H. Lai, P. Nadolsky, and W. Tung, JHEP 0207, 012 (2002), arXiv:0201195 [hep-ph] .
- Lai et al. (2000) H. L. Lai, J. Huston, S. Kuhlmann, a. Morfin, F. Olness, J. F. Owens, J. Pumplin, and W. K. Tung, Eur. Phys. J. C12, 375 (2000), arXiv:9903282 [hep-ph] .
- Mueller and Tang (1992) A. Mueller and W.-K. Tang, Phys. Lett. B, 123 (1992).
- Salam (1999) G. P. Salam, Acta Phys.Polon. B30, 27 (1999), arXiv:9910492 [hep-ph] .
- Diaz et al. (2011) A. C. Diaz, G. C. Balbastre, and C. G. Trpaga, http://scielo.sld.cu/pdf/nuc/n50/nuc035011.pdf (2011).
- Csizmadia et al. (1999) P. Csizmadia, P. Lévai, S. E. Vance, T. S. Biró, M. Gyulassy, and J. Zimányi, Journal of Physics G: Nuclear and Particle Physics 25, 321 (1999).
- Molnar and Voloshin (2003) D. Molnar and S. A. Voloshin, Phys. Rev. Lett. 91, 092301 (2003), arXiv:nucl-th/0302014 [nucl-th] .
- Adams et al. (2007) J. Adams et al. (STAR), Phys. Rev. C75, 034901 (2007).
- Abelev et al. (2009) B. I. Abelev et al. (STAR Collaboration), Phys. Rev. C80, 064912 (2009), arXiv:0909.0191 [nucl-ex] .
- Adare et al. (2008b) A. Adare et al. (PHENIX Collaboration), Phys. Rev. C78, 014901 (2008b), arXiv:0801.4545 [nucl-ex] .
- Kim et al. (1989) Y. K. Kim et al., Phys.Rev.Lett. 63, 1772 (1989).
- Tanabashi et al. (2018) M. Tanabashi et al. (Particle Data Group), Phys. Rev. D 98, 030001 (2018).