A sharp increase in the density of states in PbTe approaching a saddle point in the band structure.
Abstract
PbTe is a leading mid-range thermoelectric material with a that has been enhanced by, amongst other methods, band engineering. Here we present an experimental study of the Hall effect, quantum oscillations, specific heat, and electron microprobe analysis that explores the evolution of the electronic structure of PbTe heavily doped with the ‘ideal’ acceptor Na up to the solubility limit. We identify two phenomenological changes that onset as the electronic structure deviates from a Kane-type dispersion at around 180 meV; a qualitative change in the field dependence of the Hall effect indicative of an increase in the high-field limit and a change in the Fermiology, and a sharp increase in the density of states as a function of energy. Following consideration of three possible origins for the observed phenomenology we conclude that the most likely source is non-ellipsoidicity of the -pocket upon approach to a saddle point in the band structure, which is evidenced directly by our quantum oscillation measurements. Comparison to density functional theory calculations imply that this evolution of the electronic structure may be a key contributor to the large thermopower in PbTe.
I Introduction
PbTe is a narrow band gap semiconductor that has provoked significant interest in both applications and fundamental science for several decades. It has recently received renewed attention in the context of thermoelectric power generation owing to a reported figure of merit, , greater than 2 acheived upon optimisation of the band structure and phonon scatteringPei et al. (2012); Biswas et al. (2012); Wu et al. (2014); Zhao et al. (2013), and of up 1.5 via the introduction of resonant impurity statesHeremans et al. (2008). From the perspective of fundamental science, PbTe exhibits a number of properties that are of current interest including strong phonon anharmonicity at low energiesDelaire et al. (2011), proximity to a topological phase transitionXu et al. (2012); Dziawa et al. (2012), anomalously high-temperature superconductivityChernik and Lykov (1981a); Matsushita et al. (2006); Giraldo-Gallo et al. (2017), and evidence for a charge-Kondo effectMatsushita et al. (2005). Central to understanding of these phenomena, and the ability to tune them for applications, is a detailed understanding of the electronic structure.
Both experimental investigations and calculations of the electronic structure in PbTe show some significant disagreement on the relative energies at which the valence band should deviate from a single-band Kane-type dispersion, whose key features are a constant anisotropy (ellipsoidicity) and a linear dependence of the electronic effective mass as a function of energy close to the band extrema. It also remains unclear whether the band structure generally deviates from Kane-type via the appearance of a second valence-band maximum, significant non-ellipsoidicity, or resonant impurity states at the Fermi level in PbTeSingh (2010); Giraldo-Gallo et al. (2016); Ahmad et al. (2006); Xiong et al. (2010); Ravich (1970); Nimtz et al. (1983); Allgaier and Houston (1966); Bilc et al. (2006). As each of these scenarios should increase the density of states, the Mott relation dictates that the distinction between these scenarios becomes important in engineering a high . The situation is further complicated by the temperature dependence of both the direct gap and the offset of the first and second valence band maxima (which are thought to converge at elevated temperatures)Gibbs et al. (2013); Zhao et al. (2014); Ravich (1970); Nimtz et al. (1983), and the sensitivity of the band edges to perturbations such as pressure, temperature, chemical composition and spin-orbit coupling Ravich (1970); Nimtz et al. (1983). While extensive experimental studies of the thermal and electrical properties of PbTe at elevated temperatures have indirectly inferred information about its band structure, there has been comparatively few studies directly characterising the electronic structure away from the band edge and in the groundstate.
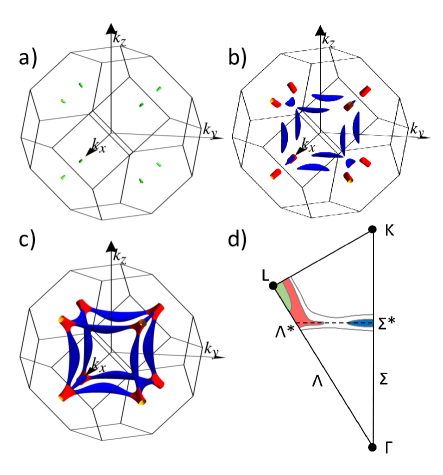
Recently, a detailed quantum oscillation study by Giraldo-Gallo et al.Giraldo-Gallo et al. (2016) extended previous worksJensen et al. (1978) to characterise the Fermi surface in Na-doped PbTe (Pb1-xNaxTe) down to 160 meV below the valence band edge. It was shown that the Fermi surface is fully described by ellipsoid of fixed ellipsoidicity located at the -point with its major semi-axis along the line, as shown in Figure 1a and illustrated in green in Figure 1d. The results were consistent with a Kane-type dispersion at all hole concentrations studied (91019 cm-3) Giraldo-Gallo et al. (2016, 2017). It has been known for some time from elevated temperature studies of hot electrons that the second band maximum is anisotropic, forming an elongated pocket oriented along the [100] direction and occuring along the line (at a point referred to here as and shown in blue in Figures 1b and 1d)Sitter et al. (1977); Nimtz et al. (1983), and this has been confirmed more recently by ARPES studies that probe states below the Fermi level, Zhao et al. (2014); Nakayama et al. (2008); Giraldo-Gallo et al. (2017). These two band maxima are connected by a saddle point in the band structure along the line connecting the points and as defined in Figure 1d that is expected to join the two band maxima to form a single cage-like Fermi surface (Figure 1c) at an energy not far below that of the second valence band maximumSingh (2010); Giraldo-Gallo et al. (2016). As such, at some energy the -pocket must become non-ellipsoidal in a manner highlighted in red in Figures 1b and 1d, deviating from the Kane model as it does so and enhancing the density of states. It is unclear from existing experiments in what order these deviations from the single-band Kane model occur and how influential each may be in enhancing the density of states and thus also the thermopower.
In this work we focus on heavily doped samples up to the highest reported Hall numbers acheived by Na doping in PbTe. Data is presented from a range of complimentary techniques (quantum oscillations, specific heat, Hall effect and electron microprobe analysis (EMPA)) from which it is robustly established that the band structure is no longer well described by a single-band Kane-type dispersion below 180 meV. The most striking feature of this deviation and the key result of this work is that the density of states increases sharply as a function of the Fermi energy. This occurs concurrently with an increase in the high-field threshold observed in the Hall effect which shows that the carrier density is in fact considerably lower than that estimated at generally accessible magnetic fields. This demonstrates that the use of the Hall effect in determining the carrier density and composition of doped PbTe is flawed at high dopings. Consistently with this increase in the high-field threshold, the quantum oscillation measurements cannot resolve the whole Fermi surface, but do seem to show a deviation from the fixed-ellipsoidicity found closer to the band edge. We discuss the relative merits of the electronic structures proposed above, and conclude that our data favours non-ellipsoidicity of the -pocket on approach to the saddle point in the band structure as the most likely source of the deviation from a Kane-type dispersion.
II Methods
Single crystals were grown via a self-flux technique in order to match the highest reported Hall numbers (a physical vapour transport technique was used in our previous studiesGiraldo-Gallo et al. (2016); Matsushita et al. (2006)). Crystals were grown in a Te-rich melt to avoid counter-doping by Te vacancies using a Te:(Pb+Na) molar ratio of 70:30. Alumina crucibles with a strainer component were used (ACP-CCS, LSP ceramics). The melt was held at 900∘C and then slow cooled to 550∘C over 3-4 days, with the flux then separated from the crystals by quenching in a centrifuge. The approximate ratio of nominal to actual dopant concentration was found to be around 10:1 below the solubility limit. The resultant single crystals varied in size as doping increased from several mm at low dopings down to around 500 m to a side at the highest sodium concentrations Yamini et al. (2013).
Quantum oscillations were measured in two crystals using a mutual inductance techniqueVan Degrift (1975) up to 65 T at the National High Magnetic Field Laboratory (NHMFL) in Los Alamos. High-field Hall effect measurements up to 30 T were performed at the NHMFL in Tallahassee, with the other Hall effect and quantum oscillation measurements taken in a commercially available 14 T PPMS from Quantum Design and a 16 T system from Cryogenic Ltd. A standard transverse contact geometry was used with the Hall component isolated by symmetrising between positive and negative fields applied in the [100] direction. Specific heat measurements were taken on a mosaic of single crystals sourced from the same batch in a commercially available dilution refrigerator option for the PPMS from Quantum Design. The lower temperature range was necessitated by the small values of the Sommerfeld coefficient and higher-order phonon terms observed to low temperature in PbTe which make extrapolations from He4 temperatures unreliable. EMPA was performed on the very same two crystals used in the quantum oscillation measurements (as well as two well characterised, physical vapour transport grown samples from our previous studyGiraldo-Gallo et al. (2016)) and found the crystals to be homogenous and single phase (see Appendix .5), ruling out the presence of precipitates that have been found previously in quenched solid solutionsYamini et al. (2013). EMPA was performed with a JEOL JXA-8230 SuperProbe Electron Probe Microanalyzer at the Stanford Microchemical Analysis Facility.
III Results
III.1 Hall Effect
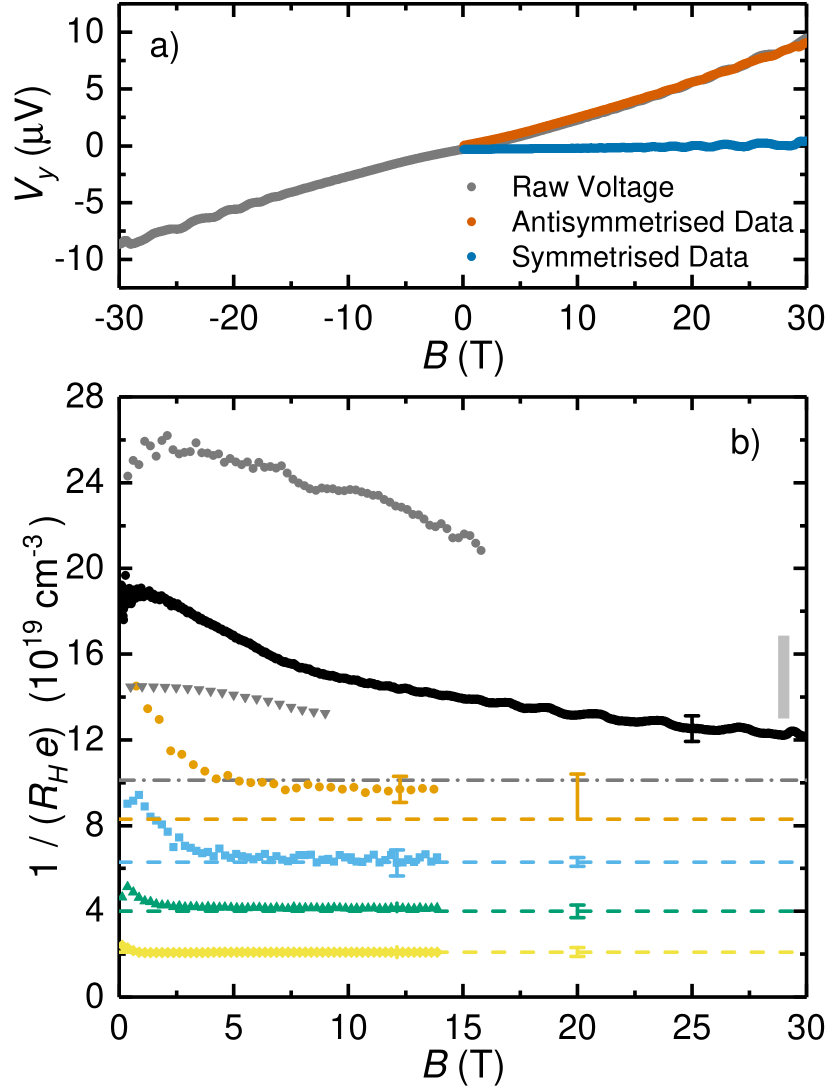
In order to clarify the categorisation of heavily doped samples we begin by discussing measurements of the Hall effect. In the high-field limit () the Hall number is a good measure of the net carrier density, but at lower fields it is acutely sensitive to anisotropy and the presence of multiple inequivalent Fermi-surface pockets. Figure 2a shows raw, symmetrised and anti-symmetrised data in magnetic fields up to 30 T for a heavily doped sample of Pb1-xNaxTe, with the component that is antisymmetric in representing the Hall effect. In Figure 2b this data is replotted as the Hall number () and compared to samples of lower doping that were characterised in the previous study by Giraldo-Gallo et al.Giraldo-Gallo et al. (2016). At lower dopings, the high field limit is clearly reached at accessible fields as the Hall number becomes a constant that matches the Luttinger volume as measured by quantum oscillations (shown by the dashed lines) in the same study. The Hall number in the present heavily doped sample (black points) however does not reach a constant value even at 30 T, implying that and therefore the Hall number is not a good measure of the carrier density in this doping range. With this in mind it is important that we make a clear distinction between the real hole density in our samples, , and the low-field Hall number, , that is used as a practical means to differentiate our samples and compare to published values. Furthermore, the qualitative evolution of the Hall number with field appears different in this regime which may be indicative of a change in the electronic structure. The grey points were taken from the same samples studied here by quantum oscillations, one of which (grey circles) appears to be at the solubility limit as the data matches the highest reported low-temperature Hall numbers for Pb1-xNaxTeCrocker (1967); Yamini et al. (2013). The grey bar in Figure 2b shows the Na density in the same sample as measured by EMPA, which is expected to match as Na is an ideal monovalent hole dopant in PbTe (see Appendix .5).
III.2 Quantum Oscillations
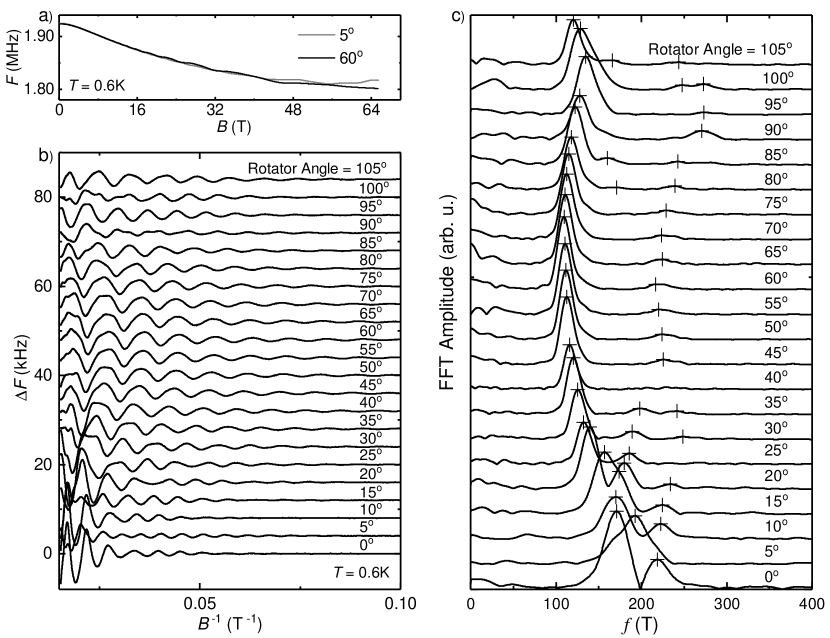
Representative mutual inductance data are shown in Figure 3a for the sample with =2.51020 cm-3 (grey circles, Figure 2b) at rotator angles of 5∘ and 60∘. The sample was nominally mounted with the crystallographic [110] direction parallel to the rotator axis such that the field sweeps through the high-symmetry points of the -pocket (and of the potential -pocket) upon rotation. A non-oscillating background was subtracted from the data via a manual spline-fit technique (polynomial fitting yields poor results for low frequencies), the results of which are shown for all measured rotator angles in Figure 3b where a clear periodicity in inverse field can be observed, indicative of quantum oscillations. The frequency spectrum is then obtained by Fast Fourier Transform (FFT) and allows the quantum oscillation frequencies to be identified as shown in Figure 3c with robustly identifiable peak positions identified with crosses. The temperature and field dependences of the amplitudes of and were also measured in order to determine the effective cyclotron masses, , and the Dingle temperatures, (these are presented and discussed in Appendices .1 and .2).

Firstly, note that no evidence for an additional Fermi surface pocket was observed in either this sample or the second sample with =1.451020 cm-3 (grey triangles, Fig. 2b), but also that this does not rule out its existence as the pocket is anticipated to have a lower mobility and thus a lower amplitude Ravich (1970). In Figure 4 we compare the extracted quantum oscillation frequencies with those expected from the Kane-type behaviour of the -pocket observed at lower dopings, i.e. an ellipsoid with a fixed ellipsoidicity of =15 (Appendix .3 describes how the model was constrained and sample misalignment was accounted for). The higher frequency orbits where the most pronounced changes in the shape of the -pocket may be expected upon approach to the saddle point in the band structure were not resolved in the data, and so the interpretation of the deviations from the ellipsoidal model are somewhat subtle and discussed further below. The ellipsoidal model gives a reliable lower bound for the -pocket Luttinger volume which is shown by the grey dot-dashed line in Figure 2b that falls considerably below in the same sample, and also a lesser but possibly significant amount below the Na density of the same sample from EMPA, but outside of the high field limit we cannot compare to a good value of directly. An unexpected result is that the two samples with =1.451020 cm-3 and =2.51020 cm-3 are found to have minimum quantum oscillation frequencies, , that are almost identical within the experimental uncertainty, implying that this region of the Fermi surface is essentially unchanged even as increases by a factor of around two.
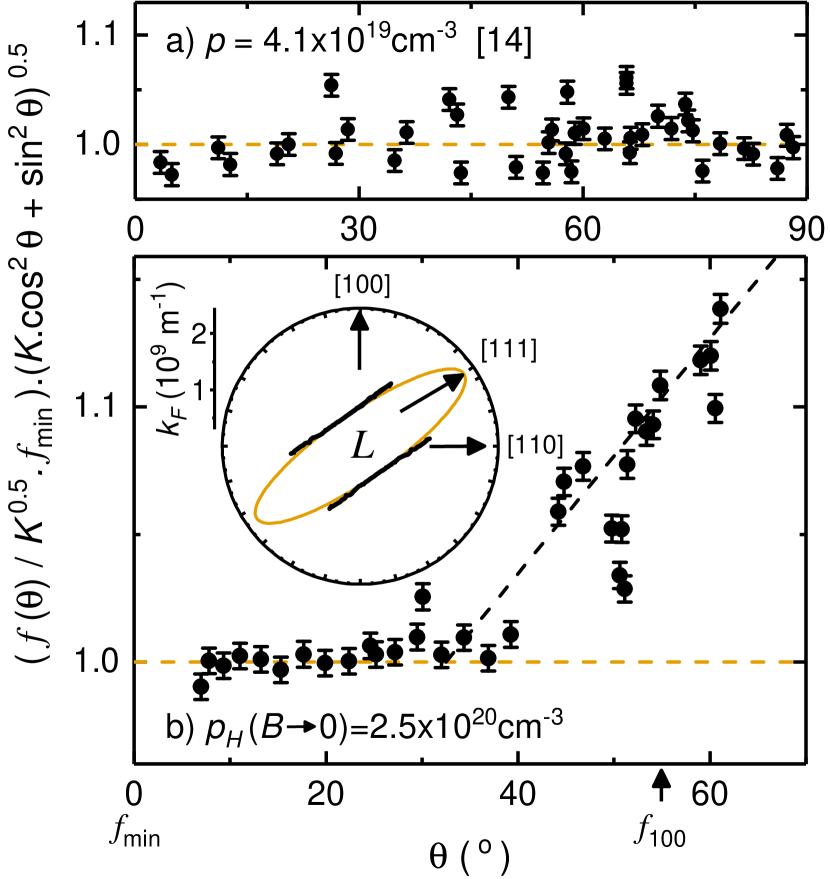
The deviation of the quantum oscillation frequencies from those expected from a Kane-type, energy independent ellipsoidicity (highlighted by the arrows in Figure 4) is shown more clearly in the main panel of Figure 5b by plotting the data and model as where is the angle of the applied field relative to the major semi-axis of the ellipsoid to which each frequency has been attributed, and is the minimum frequency corresponding to the ‘belly’ orbit of the -pocket (located at the zone boundary and well defined by the minimum of the [111] branch). In this form the orbits from the four -pockets collapse onto a single curve and the ellipsoidal model reduces to unity (orange dashed line). The validity of this analysis is confirmed in Figure 5a for a sample at lower doping (cm-3) using data reanalysed from Giraldo-Gallo et al.Giraldo-Gallo et al. (2016) where the Fermi surface is known to be ellipsoidal. Figure 5b shows that the present data follows the model up to 30∘ but deviates upwards at higher angles. It is important to note that simply increasing does not reconcile the model and the data for realistic values. The inset to Figure 5b shows the cross-section of the -pocket in -space deduced from this data via the Onsager relation and assuming ellipsoidal orbits (, ), and while this assumption may not be valid for based on the present data, this nonetheless provides a helpful illustration of the portion of the Fermi surface that has been measured and the magnitude of the apparent deviation from an ellipsoidal pocket (again shown in orange) towards something more like a tube. The excellent agreement of the harmonics in Figure 4 shows that this trend is not an artifact of the background subtraction, and errors in determining the misalignment of the sample would generally both increase and decrease frequencies relative to the model, whereas in Figure 5b we only see a monotonic increase within the spread of the data. This data is in qualitative agreement with the shape sketched in red in Figure 1d and calculated in Figure 1d for a non-ellipsoidal -pocket approaching a saddle point in the band structure, although data at larger where non-ellipsoidicity is more pronounced would add more weight to this conclusion.
III.3 Specific Heat
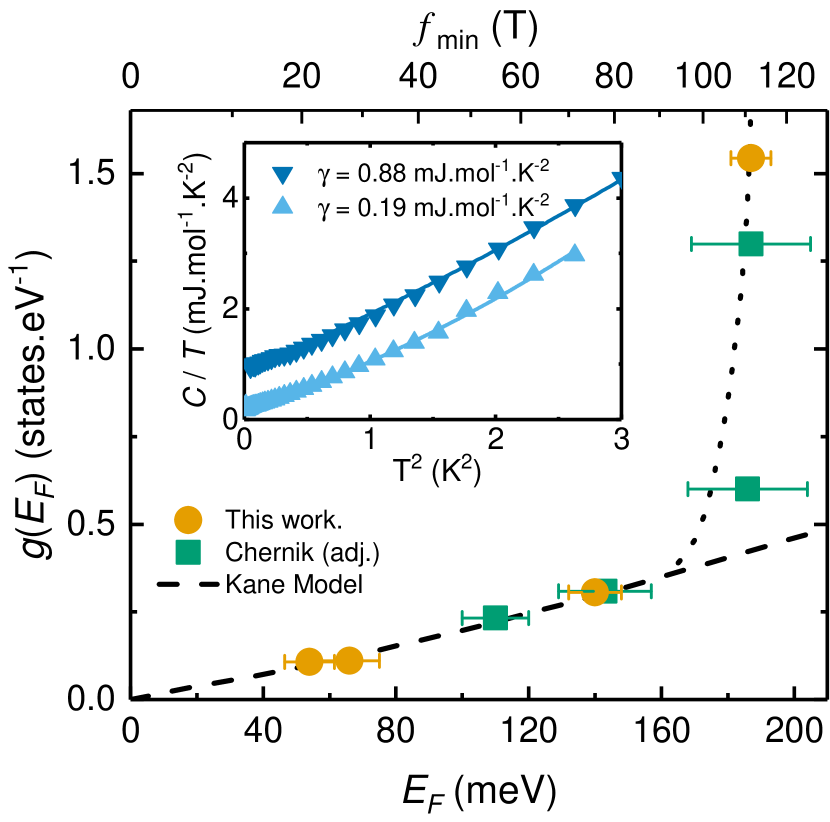
To learn more about the region of the Fermi surface that could not be observed by quantum oscillations we turn to specific heat measurements of the Sommerfeld coefficient, which yields the total electronic density of states at the Fermi level. Some representative data is shown in the inset to Figure 6 illustrating the fit used to determine the Sommerfeld coefficient, which requires a second-order polynomial in as a function of in this material owing to the anomalous low-energy phonon dispersion in this materialDelaire et al. (2011). Figure 6 shows the density of states as a function of the Fermi energy as determined from both the present and published dataGiraldo-Gallo et al. (2016); Chernik and Lykov (1981b), with the Fermi energy determined using at high dopings. The use of is important because the band structure at the Brillouin zone boundary where this orbit occcurs is expected to be unaffected by the approach to the saddle point in the band structure and so the dispersion in this direction should give a good estimate of by extending the Kane model, even if the same model were to break down near the tip of the -pocket. The process by which these values are combined to produce Figure 6 is described in detail in Appendix .4. The density of states is found to increase very rapidly as a function of energy at around 180 meV, and much more sharply than implied by published data relying on the Hall numberChernik and Lykov (1981b) (see also Figure 9) and calculationsSingh (2010). This is a key result of this work and provides a new insight into the origin of the high thermopower in this material. Futhermore this provides the clearest indication that a single-band Kane type dispersion does not describe the electronic structure of Pb1-xNaxTe at the highest dopant concentrations.
IV Discussion
The data presented here establish two important phenomenological differences imparted by the deviation from a Kane-type dispersion that occurs around 180 meV. Firstly, the carrier density is no longer well represented by the Hall effect at accessible magnetic fields. Secondly, the electronic density of states increases much faster as a function of energy than could be inferred from existing characterisations. The origin of this phenomenology is less immediately clear, and so here we consider the relative merits of the two Fermiological scenarios detailed in Figure 1 (non-ellipsoidicity of the -pocket and the presence of a pocket at ), as well as the possibility of a resonant impurity state in explaining the data.
The consideration of a resonant impurity state is motivated by how sharply the density of states seems to increase as a function of energy, which could be indicative of Fermi level pinning as has been observed previously for a number of impurities in PbTe Kaidanov and Yu (1985). Calculations that have been successful in reproducing other observed resonant impurity states in PbTe have predicted that the effect of sodium on the density of states is negligible, but also that Pb vacancies may produce a weakly interacting resonant state in this energy rangeAhmad et al. (2006). Experimentally however the absence of a signature in tunneling experiments on similarly Pb deficient crystals is notableKaidanov et al. (1989). Predictions of the Hall factor also suggest that the field dependence of the Hall number observed here is incompatible with a resonant impurity state as in that caseProkofieva et al. (2009), and the lack of a large increase in the Dingle temperature and residual resistivity ratio would also imply that any such state would need to be very highly localised.
It is generally accepted that there is a second valence band maximum at the point in PbTe, which appears 12 times in the Brillouin zone and has a much flatter dispersion than the first valence band maximum at the -point. The lack of any signatures of the pocket in the quantum oscillation data could be understood as the mobility is expected to be lower than on the -pocket, and intuitively the density of states must increase faster as a function of energy as the Fermi level is tuned below the second valence band maximum. But the two-band model of the Hall effect predicts that when both bands are hole-like111The low-field Hall coefficient modelled for two inequivalent hole-pockets is written as where and are the hole density and Hall factor of pocket respectively and the ratio of the mobilities of the pockets is . The limiting case reduces to , which is larger than the high-field value, provided is sufficiently close to unity. Remembering that we have defined , it is therefore the case that for the two-band model in the absence of large anisotropies., in opposition to the present dataRavich (1970); Hurd (1972). Elevated temperature studies of the Hall effect in PbTe confirm this intuition as is observed to fall with increasing temperature as the pocket becomes populated owing to the temperature dependent band offset and thermally excited carriersRavich (1970); Allgaier and Houston (1966). This suggests that even a two-band model that accounts for the anisotropy of the pocket cannot reconcile the field dependence of the Hall number in this scenario.
Non-ellipsoidicity of the -pocket provides the most natural mechanism by which to explain the field-dependence of the Hall number because it can yield by altering the anisotropy of the Fermi surface and the scattering rateOng (1991); Hurd (1972). Indeed the ellipsoidicity of the -pocket at lower dopings already demonstrates this with a qualitatively different field dependence in samples of lower doping, as evidenced in Figure 2b. The most direct piece of evidence in favour of this scenario comes from the measured deviation from ellipsoidicity seen in the angle-dependence of the quantum oscillations; although the whole -pocket is not resolved the effect appears to be significant in the data. The highly dependent loss of quantum oscillation amplitude relative to lower dopings in the absence of a significant increase in (see Appendix .2) is also suggestive of increased scattering in a localised region of -space around the tip of the -pocket owing to increased density of states and greater phase smearing from the increased band curvature, as oppose to a second pocket or impurity states that would be expected to scatter carriers more equally around the Fermi surface. The approach to a saddle point in the band structure which would lead to non-ellipsoidicity naturally implies an increase in the rate of change of the density of states, but as with the second band maximum scenario, the feature is somewhat sharper than that expected from calculationsSingh (2010) and prior dataKaidanov et al. (1989). This apparent discrepancy may be reconciled if the dispersion along the line defined in Figure 1d is flatter than anticipated, possibly due to a failure of the assumption of a rigid band shift upon Na doping or uncertainties in calculations of the quantitative details of the band structure of PbTe.
Regardless of its origin, the large increase in the density of states observed directly here is likely to be the one invoked when explaining the high thermopower in Pb1-xNaxTe Pei et al. (2012); Singh (2010); Airapetyants et al. (1966); Prokofieva et al. (2009), thus lending support to the argument that the high thermopower in -type PbTe is intrinsic and originates from a flat feature in the valence band. The energy at which the density of states begins to increase agrees well with calculations by Singh Singh (2010) that also invoke non-ellipsoidicity of the -pocket as the source of the increase with the second band maximum occuring slightly lower in energy. As the same calculations have also captured the magnitude of the thermopower accurately, this seems to form a consistent picture that the phenomenology of heavily doped Pb1-xNaxTe is strongly influenced by non-ellipsoidicity of the -pocket on approach to a saddle-point in the band structure.
V Conclusion
In this work we have explored the electronic structure of heavily holed-doped PbTe single crystals in the ground state using the complementary probes of the Hall effect, quantum oscillations, specific heat, and EMPA, from which we identify and characterise a significant deviation from the Kane model that onsets around 180 meV. The data show that the density of states grows sharply as a function of concurrently with a significant increase in the threshold at which the system enters the high-field limit as seen by the Hall effect. This leads to two important new phenomenological conclusions; firstly that the carrier density is significantly overestimated by the Hall effect at accessible fields in this regime, and secondly, that the density of states increases more rapidly with energy than previously inferred. We consider three possible sources of this phenomenology, a resonant impurity state, a second valence band maximum at the Fermi level, and non-ellipsoidicity of the -pocket. By comparing the angle-dependence of the quantum oscillation measurements to an ellipsoidal model and considering the field dependence of the Hall number we propose that non-ellipsoidicity of the -pocket is the most likely origin of this phenomenology, and this scenario is also most consistent with density functional theory. In order to reconcile this scenario with the rapid increase in the density of states, the band dispersion along the line (defined in Figure 1d) must be flatter than anticipated from calculations. These results contribute to a consistent picture of the origin of the high thermopower of Pb1-xNaxTe, as well as calling for a reassessment of the real carrier densities in heavily doped PbTe.
VI Acknowledgements
The authors would like to thank Johanna Palmstrom and Scott Hannahs for experimental support at the NHMFL in Tallahassee and Filip Ronning for assistance with additional sample characterisation at Los Alamos. We thank Dale Burns for assistance with EMPA measurements at the Stanford Mineral and Microchemical Analysis Facility, and Heike Pfau for pursuing additional characterisation. Calculated band structures were kindly provided by Nicola Spaldin and Boris Sangiorgio. P.W. and I.R.F. were supported by AFOSR Grant No. FA9550-09-1-0583. PW acknowledges partial support from the Gordon and Betty Moore Foundations EPiQS Initiative through grant GBMF4414. The National High Magnetic Field Laboratory is supported by the National Science Foundation through NSF/DMR-1644779 and DMR-1157490, and the State of Florida. The Pulsed Field Facility at Los Alamos National Labratory was additionally supported by the the U.S. Department of Energy.
VII Appendices
.1 Temperature depence of quantum oscillations and estimates of
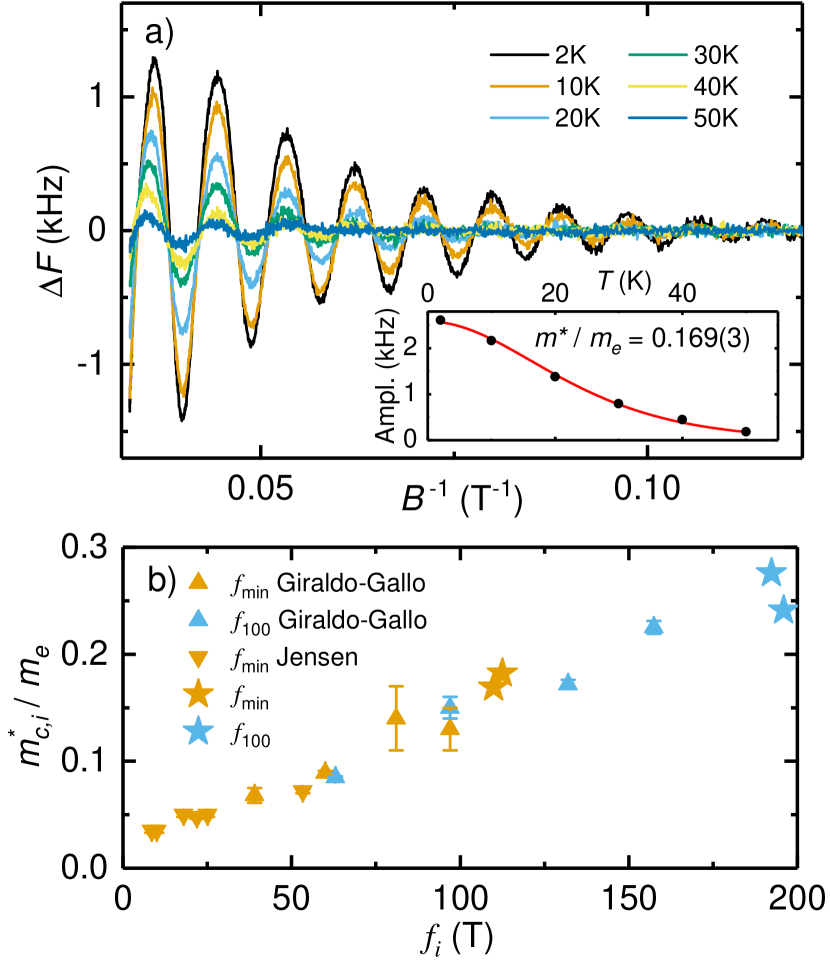
The temperature dependence of the amplitude of the orbit () is shown in Figure 7a for the sample with =2.51020 cm-3. By fitting the amplitude of the oscillation as a function of temperature to the temperature dependent term of the Lifshitz-Kosevitch formula, as shown in the inset to Figure 7a, we obtain the cyclotron effective mass, =0.169(3) for the orbit. Similar data was taken for and also in sample with =1.451020 cm-3, and these results are compared to data from Giraldo-Gallo et al.Giraldo-Gallo et al. (2016) in Figure 7b as function of the orbit frequency. This yields a linear trend as expected from the Kane model where , with the and data collapsing onto the same curve because the cross sectional area of the Fermi surface and the cyclotron mass share the same angular dependenceRavich (1970). Given the apparent deviation from ellipsoidicity highlighted in Figure 5b one may expect an increase in the effective mass in the present samples for the (100) orbit, however represents an average of around the completed orbit, and so is expected to see a smaller enhancement than is present in the portion of the orbit with the most band curvature. Furthermore, any increase would in part be cancelled out by the concurrent increase in the frequency when presented as in this plot, and so it is not clear that constitutes a particularly sensitive probe of non-ellipsoidicity in this context. The close adherence of the data to the Kane model justifies the use of in determining the Fermi energy as discussed below in Appendix .4.
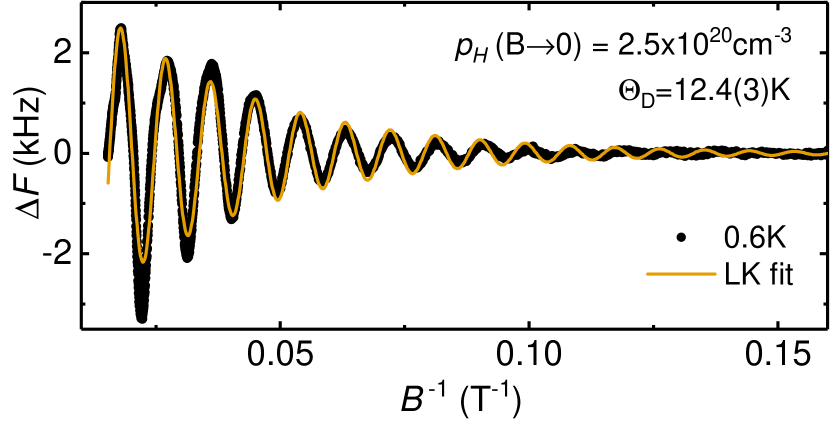
.2 Field dependence of quantum oscillations and the Dingle temperature
The magnetic field dependence of a quantum oscillation amplitude is related by the Dingle temperature, , to the mean free path. It is curious that Giraldo-Gallo et al.Giraldo-Gallo et al. (2016) found that is independent of doping in Pb1-xNaxTe, when the mean free path might be expected to fall as more dopants are introduced, which may reflect the very strong screening effect in PbTe. Figure 8 shows a fit of the Lifshitz-Kosevitch formula which determines to be 12.4(3) K for the orbit, slightly larger but comparable to that at lower dopings. This comparison is complicated slightly as the samples used here are grown by a melt-growth method that is likely to be less structurally perfect than the vapor-transport method used at lower dopings by Giraldo-Gallo et al. Kokhlov (2003). It is notable however that a resonant impurity state might be expected to have a larger effect on than this, as observed in the strong suppression of the quantum oscillation amplitude when doping with Tl beyond 0.3% Giraldo-Gallo et al. (2017).
.3 Constraining the Ellipsoidal Model
The model shown in in Figure 4 was constrained in the following ways; the ellipsoidicity was held as for comparison to lower carrier concentrations, noting that the fit is largely insensitive to realistic changes of this value for the observed frequencies; the minimum quantum oscillation frequency, , corresponding to the cross-sectional area of the -pocket at the zone boundary, was taken as accurate because this value changes very little with misalignment; the misalignment and the uncertainty in the misalignment were estimated by optical measurements of the experimental setup; the quality of fit of the model was assessed within the constraints of the uncertainty in the misalignment by a least-squares type analysis, the conclusion of which was that there was no realistic combination of parameters by which the ellipsoidal model could fit all of the data simultaneously. The displayed model is that determined by the optically estimated misalignments, and, as discussed in the main text, is consistent with how the -pocket may be expected to deviate from ellipsoidicity. Two empirical statements support the validity of the final parameters of the model and the resulting comparison to the analysed data, firstly the harmonics seem to fit very well at low implying that any deviation is as a function of , not a function of the measured as may be expected from a systematic error. Also, in order to improve the fit to either of the [11] and [1] branches, the fit to the other must be compromised. Put differently, the non-misaligned [11] and [1] branches would be approximately an average of the two misaligned branches, and it can be seen that the average of the two measured branches is significantly higher than those of the model. The effect of a badly estimated misalignment would produce values both above and below unity in Figure 5, and indeed this may contribute to some of the additional scatter in Figure 5a, but cannot explain the behaviour observed in Figure 5b.
.4 Determination of
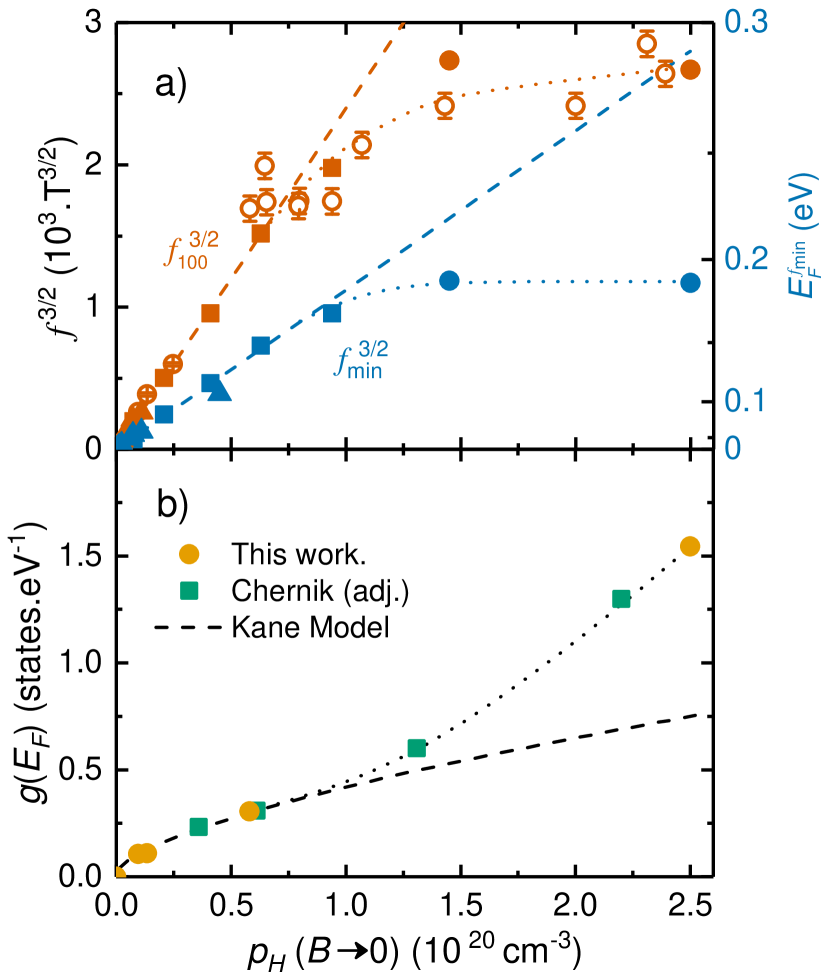
Given that the Hall number cannot be taken as a good estimate of the carrier density in the heavily doped regime, we turn to the quantum oscillation frequencies to determine . is not expected to deviate markedly from the Kane model until much larger values of , and Figures 5b and 7b show that this is true for all orbits up to even in our most heavily doped sample. Figure 9a demonstrates the expected (dashed line) for the lower doping regime where the Kane model holds and , as well as the strong deviation from this trend above cm-3. The right-hand scale shows how the data points (blue) then translate to (non-linear scale) according to a Kane model that should remain valid for the orbit. Figure 9b also includes data including melt-grown samples that were only measured to lower fields (14T) in a single orientation. This serves to highlight the general phenomenology with a higher data density as the data is quite broadly spaced (the samples naturally cleave in the (100) plane so this is the alignment used for basic characterisation, whereas a rotator is required to access ).
The total electronic density of states, , is determined from the Sommerfeld coefficient of the specific heat, and in Figure 9b we again compare to which is available for all of our samples and also published data by Chernik et al. The difficulty with measuring the Sommerfeld coefficient in PbTe is both the small density of states and the low-energy non-linearity of the acoustic phonon branch Delaire et al. (2011) that make traditional extrpolations of the type unsuitable. The methodology used by Chernik et al. differs slightly from that used here but the two are complementary. Here we used lower temperatures to limit the extrapolation error and allowed a contribution to in the fit, as shown in the inset of Figure 6. Chernik et al. instead used a nominally undoped PbTe as a background and subtracted this data from that of their doped samples on the assumption that only the term changes. However PbTe doesn’t form without some carriers due to vacancies, stated by Chernik et al. to be of order 1018 cm-3 in their reference sample, meaning that is underestimated in their data. From the Kane model we can estimate the missing due to their imperfect background subtraction to be approximately 0.04 mJ.mol-1.K-2, which, as expected, brings both datasets into perfect agreement. With both and now on a common axis, , they can be correlated to produce Figure 6. Whilst there is some interpolation involved in this process, the qualitative behaviour is absolutely clear: as , and hence , stops increasing, rises significantly.
.5 Electron Microprobe Analysis
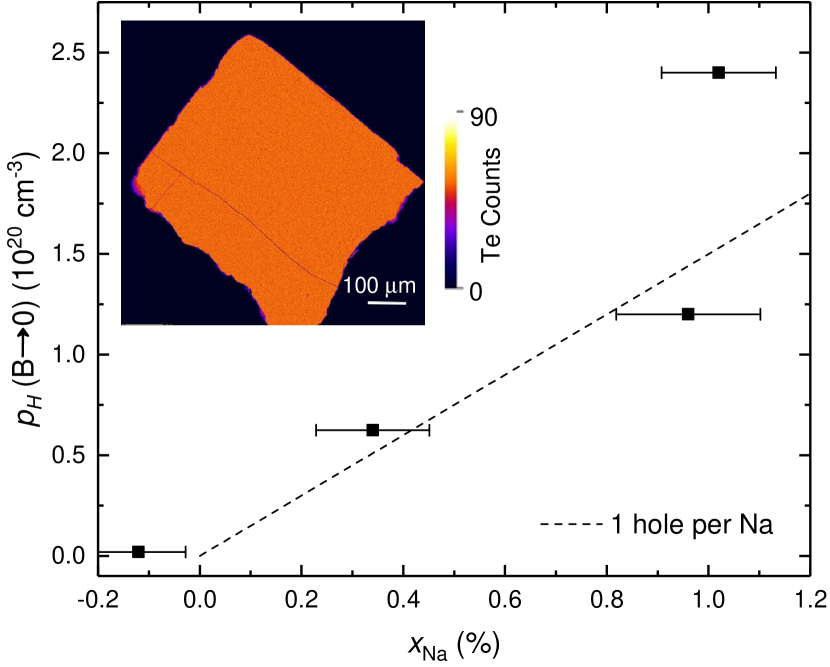
As a cross-check for our conclusion that we performed a direct chemical analysis by EMPA. Na is known to contribute a single hole to PbTe and as a member of group 1 it is not disposed to alternative valences, and so we can assume that this behaviour does not change (unlike say, Tl which has been shown to change valence in PbTe as a function of )Nemov and Ravich (1998); Giraldo-Gallo et al. (2017); Walmsley et al. (2018). Hence the real carrier density should be close to the real dopant density provided that as expected here. Figure 10 confirms that and (plotted as ) agree well at lower dopings but then deviate for the highest dopings, with the solubility limit (highest doping) seen to be approximately 1%, corresponding to an implied carrier density of around 1.5(2)1020 cm-3. This number and uncertainty are contextualised against the Hall number and lower-bound of the -pocket Luttinger volume in Figure 2b, shown as the grey bar. The inset to Figure 10 shows a typical composition map, chosen here for Te to demonstrate the absence of NaTe2, illustrating that there are no resolvable impurity phases in these single crystals. The Pb and Na maps look essentially identical to the Te map shown. Note that the apparently negative value of for one data point in Figure 10 is an artifact of the background subtraction (the sample was undoped, i.e. ).
References
- Pei et al. (2012) Y. Pei, H. Wang, and G. J. Snyder, Advanced Materials 24, 6125 (2012).
- Biswas et al. (2012) K. Biswas, J. He, I. D. Blum, C. I. Wu, T. P. Hogan, D. N. Seidman, V. P. Dravid, and M. G. Kanatzidis, Nature 489, 414 (2012).
- Wu et al. (2014) H. J. Wu, L. D. Zhao, F. S. Zheng, D. Wu, Y. L. Pei, X. Tong, M. G. Kanatzidis, and J. Q. He, Nature Communications 5, 4515 (2014).
- Zhao et al. (2013) L. D. Zhao, H. J. Wu, S. Q. Hao, C. I. Wu, X. Y. Zhou, K. Biswas, J. Q. He, T. P. Hogan, C. Uher, C. Wolverton, V. P. Dravid, and M. G. Kanatzidis, Energy and Environmental Science 6, 3346 (2013).
- Heremans et al. (2008) J. P. Heremans, V. Jovovic, E. S. Toberer, A. Saramat, K. Kurosaki, A. Charoenphakdee, S. Yamanaka, and G. J. Snyder, Science 321, 554 (2008).
- Delaire et al. (2011) O. Delaire, J. Ma, K. Marty, A. F. May, M. A. McGuire, M.-H. Du, D. J. Singh, A. Podlesnyak, G. Ehlers, M. D. Lumsden, and B. C. Sales, Nature Materials 10, 614 (2011).
- Xu et al. (2012) S. Y. Xu, C. Liu, N. Alidoust, M. Neupane, D. Qian, I. Belopolski, J. D. Denlinger, Y. J. Wang, H. Lin, L. A. Wray, G. Landolt, B. Slomski, J. H. Dil, A. Marcinkova, E. Morosan, Q. Gibson, R. Sankar, F. C. Chou, R. J. Cava, A. Bansil, and M. Z. Hasan, Nature Communications 3, 1192 (2012).
- Dziawa et al. (2012) P. Dziawa, B. J. Kowalski, K. Dybko, R. Buczko, A. Szczerbakow, M. Szot, E. Łusakowska, T. Balasubramanian, B. M. Wojek, M. H. Berntsen, O. Tjernberg, and T. Story, Nature Materials 11, 1023 (2012).
- Chernik and Lykov (1981a) I. Chernik and S. Lykov, Soviet Physics, Solid State 23, 817 (1981a).
- Matsushita et al. (2006) Y. Matsushita, P. A. Wianecki, A. T. Sommer, T. H. Geballe, and I. R. Fisher, Physical Review B 74, 134512 (2006).
- Giraldo-Gallo et al. (2017) P. Giraldo-Gallo, P. Walmsley, B. Sangiorgio, S. C. Riggs, R. D. McDonald, L. Buchauer, B. Fauque, C. Liu, N. A. Spaldin, A. Kaminski, K. Behnia, and I. R. Fisher, (2017), arXiv:1711.05723 .
- Matsushita et al. (2005) Y. Matsushita, H. Bluhm, T. H. Geballe, and I. R. Fisher, Physical Review Letters 94, 157002 (2005), 0409174 .
- Singh (2010) D. J. Singh, Physical Review B 81, 195217 (2010).
- Giraldo-Gallo et al. (2016) P. Giraldo-Gallo, B. Sangiorgio, P. Walmsley, H. J. Silverstein, M. Fechner, S. C. Riggs, T. H. Geballe, N. A. Spaldin, and I. R. Fisher, Physical Review B 94, 195141 (2016).
- Ahmad et al. (2006) S. Ahmad, S. D. Mahanti, K. Hoang, and M. G. Kanatzidis, Physical Review B 74, 155205 (2006).
- Xiong et al. (2010) K. Xiong, G. Lee, R. P. Gupta, W. Wang, B. E. Gnade, and K. Cho, Journal of Physics D: Applied Physics 43, 405403 (2010).
- Ravich (1970) Y. Ravich, Semiconducting Lead Chalcogenides (Plenum Press, 1970).
- Nimtz et al. (1983) G. Nimtz, B. Schlicht, and R. Dornhaus, Narrow-Gap Semiconductors (Springer-Verlag, 1983).
- Allgaier and Houston (1966) R. S. Allgaier and B. B. Houston, Journal of Applied Physics 37, 302 (1966).
- Bilc et al. (2006) D. I. Bilc, S. D. Mahanti, and M. G. Kanatzidis, Physical Review B 74, 125202 (2006).
- Gibbs et al. (2013) Z. M. Gibbs, H. Kim, H. Wang, R. L. White, F. Drymiotis, M. Kaviany, and G. Jeffrey Snyder, Applied Physics Letters 103, 262109 (2013).
- Zhao et al. (2014) J. Zhao, C. D. Malliakas, N. Appathurai, V. Karlapati, D. Y. Chung, S. Rosenkranz, M. G. Kanatzidis, and U. Chatterjee, (2014), arXiv:1404.1807 .
- Jensen et al. (1978) J. D. Jensen, B. Houston, and J. R. Burke, Physical Review B 18, 5567 (1978).
- Sitter et al. (1977) H. Sitter, K. Lischka, and H. Heinrich, Physical Review B 16, 680 (1977).
- Nakayama et al. (2008) K. Nakayama, T. Sato, T. Takahashi, and H. Murakami, Physical Review Letters 100, 227004 (2008).
- Yamini et al. (2013) S. A. Yamini, T. Ikeda, A. Lalonde, Y. Pei, S. X. Dou, and G. J. Snyder, Journal of Materials Chemistry A 1, 8725 (2013).
- Van Degrift (1975) C. T. Van Degrift, Review of Scientific Instruments 46, 599 (1975).
- Crocker (1967) A. Crocker, Journal of Physics and Chemistry of Solids 28, 1903 (1967).
- Chernik and Lykov (1981b) I. Chernik and S. Lykov, Soviet Physics, Solid State 23, 1724 (1981b).
- Kaidanov and Yu (1985) V. I. Kaidanov and I. R. Yu, Soviet Physics Uspekhi 28, 31 (1985).
- Kaidanov et al. (1989) V. Kaidanov, S. Rykov, and M. Rykova, Soviet Physics, Solid State 31, 1316 (1989).
- Prokofieva et al. (2009) L. V. Prokofieva, D. A. Pshenay-Severin, P. P. Konstantinov, and A. A. Shabaldin, Semiconductors 43, 1155 (2009).
- Note (1) The low-field Hall coefficient modelled for two inequivalent hole-pockets is written as where and are the hole density and Hall factor of pocket respectively and the ratio of the mobilities of the pockets is . The limiting case reduces to , which is larger than the high-field value, provided is sufficiently close to unity. Remembering that we have defined , it is therefore the case that for the two-band model in the absence of large anisotropies.
- Hurd (1972) C. M. Hurd, The Hall effect in metals and alloys (Plenum Press, 1972).
- Ong (1991) N. P. Ong, Physical Review B 43, 193 (1991).
- Airapetyants et al. (1966) S. V. Airapetyants, M. N. Vinogradova, I. N. Dubrovskaya, N. V. Kolomoets, and I. M. Rudnik, Soviet Physics: Solid State 8, 1069 (1966).
- Kokhlov (2003) D. Kokhlov, Lead Chalcogenides: Physics and Applications (Taylor and Francis, 2003).
- Nemov and Ravich (1998) S. Nemov and Y. Ravich, Uspekhi Fizicheskih Nauk 168, 817 (1998).
- Walmsley et al. (2018) P. Walmsley, C. Liu, A. D. Palczewski, P. Giraldo-Gallo, C. G. Olson, I. R. Fisher, and A. Kaminski, (2018), arXiv:1808.07213 .