The Multi-Scale Impact of the Alzheimer’s Disease in the Topology Diversity of Astrocytes Molecular Communications Nanonetworks
Abstract
The Internet of Bio-Nano-Things is a new paradigm that can bring novel remotely controlled actuation and sensing techniques inside the human body. Towards precise bionano sensing techniques in the brain, we investigate the challenges of modelling spatial distribution of astrocyte networks in developing a mathematical framework that lay the groundwork for future early-detection techniques of neurodegenerative disease. In this paper, we investigate the effect of the -amyloid plaques in astrocytes with the Alzheimer’s disease. We developed a computation model of healthy and Alzheimer’s diseases astrocytes networks from the state of the art models and results that account for the intracellular pathways, IP3 dynamics, gap junctions, voltage-gated calcium channels and astrocytes volumes. We also implemented different types of astrocytes network topologies including shortcut networks, regular degree networks, Erdös Rényi networks and link radius networks. A proposed multi-scale stochastic computational model captures the relationship between the intracellular and intercellular scales. Lastly, we designed and evaluated a single-hop communication system with frequency modulation using metrics such as propagation extend, molecular delay and channel gain. The results show that the more unstable but at the same time lower level oscillations of Alzheimer’s astrocyte networks can create a multi-scale effect on communication between astrocytes with increased molecular delay and lower channel gain compared to healthy astrocytes, with an elevated impact on Erdös Rényi networks and link radius networks topologies.
I Introduction
Molecular bionano devices is an exciting new technology that enables future integration of biological systems with the internet, termed the Internet of Bio-Nano-Things, towards minimally invasive high-resolution cellular interfaces [1]. Implantable bionano devices will then allow the remote real-time monitoring and treatment of diseases [2, 3]. The molecular mechanisms that regulate any biological system homoeostasis are essential to be completely understood within a mathematical framework, which leads to a complete description of the signal propagation inside a biological communication network. The recent area of molecular communication has focused their efforts in the past decade in providing this framework for the analysis of communication system in living tissues even with different molecular information carriers, for example, DNA, Ca2+, hormones, or even blood cells [4]. However, there has been very little efforts in understanding these systems when they are found with a disease or any mechanism that lead to such.
Neurodegenerative diseases, as a whole, affect hundreds of millions of people around the world with an annual treatment cost of billions of dollars, and in particular the case of the Alzheimer’s disease (AD), there is need of constant nurse care due to detrimental life symptoms [5]. Both the genesis and the cure of Alzheimer’s are far away from being completely established, plus the complexity of this challenging research issue has attracted multidisciplinary methods in the past recent years. Now, research in Alzheimer’s disease achieved increased progress by integrating neuroscience with computer science, nanotechnology, synthetic biology and communication engineering areas. Most recently, researchers are concentrating in two exciting new approaches to AD: i) trying to understand how AD affects the loss of neuronal information in the brain, and ii) developing cell-free disease models that potentially allow the progress of drug discovery research and testing with accurate computational models.
The molecular information propagation inside the brain, in particular, involves different types of cells (neuronal and non-neuronal), which comprise different types of communication systems altogether. The organisation of astrocytes within a variety of networks is now being studied towards the detailed characterisation of the propagation of information signals[6]. Neurodegeneration will also affect the signal propagation since they directly interfere with the multi-scale brain organisation, including the intracellular signal pathways, intercellular communications and higher hierarchical network topologies. Since the molecular communication signal propagation of neurodegenerative diseases is an interesting approach to understanding neurodegeneration at the cellular level, mixing its intracellular, intercellular and network modelling is a step further to more detailed information of its physiology using a computational multi-scale approach. Molecular communication analysis of neurodegenerative disease can unlock discoveries by augmenting the existing models for intracellular activity towards the quantification of higher brain levels.
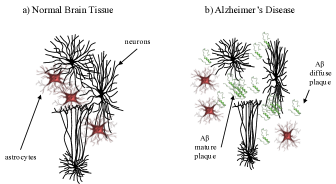
In AD, the intracellular calcium information propagation inside non-neuronal cells like astrocytes, impact on the tripartite synapses propagation in neuronal cells causing loss of connection, what is known in neuroscience as the synapse plasticity. The amyloid hypothesis suggests that the accumulation of -amyloid in the brain is the primary driving force of AD pathogenesis and change of the synapses behaviour [7, 8, 9, 10], 1. In this hypothesis, the formation of -amyloid (which is a self-aggregating 40-42 amino acid protein) plaques and fibrils as a result of an underlying imbalance process cause a slow accumulation these peptides that can alter calcium signalling processes leading to synaptic failure and neuronal death. Although the linkage between -amyloid and intracellular calcium homeostasis remains unclear, several studies provide growing pieces of evidences that -amyloid directly interferes with the inositol triphosphate (IP3) [11, 12], the gap Junctions [13, 5], the voltage-gated channels with the cellular membrane [14], and the cellular volume [15].
In this paper, our main goal is to quantify the effects of the intracellular calcium signalling signal propagation under -amyloid influence, as a way to compute the AD affect inside astrocyte nanonetworks. We use the results of experiments and computational biology approaches to make simplifying assumptions for how -amyloid affects the intracellular calcium signalling by creating a new computational model that accounts for the changes in calcium pathways, IP3 dynamics, gap junctions, cellular membrane influence and cellular volume. Then, we also present a molecular simulation model that accounts for both intracellular and intercellular calcium signalling, that is a multi-scale method towards the quantification of the signal propagation inside astrocyte networks. The astrocyte 3D networks are modelled to account for topology diversity in the brain with shortcut networks, regular degree networks, Erdös Rényi networks and link radius networks. Lastly, to properly measure the effects of multi-scale communications we designed a calcium signalling-based molecular communication system in order to link the effects of the AD, compared to healthy networks, to signal propagation extend, molecular delay and channel gain. This throughout new computational approach is one step further to more accurate and complete models for AD research as well as providing novel insights about the molecular communication characterisation of diseases inside biological tissues, such as astrocytes.
Our main contribution are:
-
1.
A computational Alzheimer’s disease model based on the influence of -amyloid plaques on the calcium cellular pathways. The model accounts for calcium pathways, IP3 dynamics, gap junctions, cellular membrane influence and cellular volume.
-
2.
Implementation of different astrocyte network topologies, including shortcut networks, regular degree networks, Erdös Rényi networks and link radius networks
-
3.
Quantification of the multi-scale effects of the AD from an intracellular level, intercellular level and network level. Our results show that the more unstable but at the same time lower level oscillations of Alzheimer’s astrocyte networks can create a multi-scale effect on communication between astrocytes with increased molecular delay and lower channel gain compared to healthy astrocytes, with an increased impact in Erdös Rényi networks and link radius networks topologies.
II Related Work
The research about calcium signalling in astrocytes is a recent attempt to depict the laws that govern the propagation of information in the brain, with the relationship between those cells and neurons [17]. Many researchers have, through the years, provided the mathematical basis for the calcium signalling in astrocytes, including [18, 19, 12, 20, 21, 22, 23]. Because there is an intrinsic dual relationship with neurons, astrocytes can change the synaptic plasticity dramatically of the neurons. Their network organisation, thereafter, has a fundamental impact in delivering information to the neurons encoded in many different molecules that regulate both their energy and functioning [17]. Experimental pieces of evidence allow the observation of the propagation of calcium waves inside astrocyte networks, dependable on their brain region, but commonly exhibiting topology dependency in the information propagation dynamics [6]. For example, this phenomenon is described in work about the olfactory glomeruli [24] or the somatosensory cortex [25]. Computational models are sufficient to accurately describe the same calcium wave propagation from the experiments with the topology variation [6]. However, the usage of the experimental approaches is often limited to observe the full impact of the calcium signal propagation in these astrocyte network topologies. The intracellular results and output models are not used in terms of network functioning and changes. Molecular computational models can be introduced to quantify the signal propagation variability and the resulting models can account for intercellular communication properties of the astrocytes, i.e. gap junctions, network organisation and cellular population activity understanding.
Alzheimer’s research has historically been concentrated on experimental approaches that analysed the genesis of the disease, and the ultimate result is the -amyloid hypothesis. There are other peptides that are also correlated with the genesis of the AD, including the hypothesis. Researchers do not discard the possibility of these peptides working together, but the whole research on the genesis of the AD is slow due to the numerous efforts in the experimental validation of these hypotheses. In particular to astrocytes, the most advanced stages of understanding of AD and their calcium signalling are distributed in works that account for inositol triphosphate (IP3) [11, 12], the gap Junctions [13, 5], the voltage-gated channels with the cellular membrane [14], and the cellular volume [15]. More recently, researchers have started to create computational models to help the researcher understand how AD affects the brain in many scales and with different types of cells [26, 27, 28]. However, there is no effort towards compiling the recent experimental advancements from the literature in a novel computational model, moreover, there is no effort in analysing how the defect calcium signalling under the influence of AD from a molecular computational approach -amyloid can affect the whole astrocytes networks.
From previous literature, we can infer that the amount of modelling in AD research is very limited. This open spaces for new molecular computational models that translate research results from practice to theory in order to enhance the disease analysis and contribute to its understanding from a computational approach. We can observe from the literature that the experimental investigation of the molecular principles of the AD is limited to obtain its overall understanding, for example, it is not possible to visualise the relationship of astrocyte network molecular communication and the spatial organisation of such network [29]. Molecular computational models are well accepted in calcium signalling biology research area with a plurality of models that are validated through experiments, including astrocyte-to-astrocyte variability of intracellular signalling parameters, local IP3 regeneration, receptor sub-types, affinity of IP3 receptor-channels on calcium stores or kinetics of IP3 transport through gap-junctions [30, 6, 31].
Astrocytes were also studied in the field of molecular communications with the dual objective of understanding both their natural communication properties and to transmit artificial information. Barros et. al. [32] compared how the astrocytes natural communication performance difference against other cell types including epithelial and smooth muscle cells. Mesiti et. al. [33] took a different approach by studying how the astrocytes communicate to neurons in the tripartite synapses. More recently, Barros and Dey have developed a control of the calcium in the astrocytes cytosol upon pre-defined cellular stimulation [34], which enabled the development of effective communication system design that allows great performance in the transmission of bits in short-range communications [35]. The application of the above studies to biology and medicine through new bionanosensing techniques (see [36]) can create a great interdisciplinary impact, however, there are still major modelling and system design issues. One of them is the configuration of astrocyte 3D networks topologies that compose tissues. In [29], there are several astrocyte network topologies that were not taken into consideration in the molecular communication literature. This type of approach is also important to other types of cells, which their non-linear shapes and heterogeneous configuration can lead to a great impact on the communication system performance. On top of that, calcium signalling-based molecular communication system under disease scenarios is also a missing approach in reaching a full theoretical framework. We explore these gaps in the literature by modelling the astrocyte network topologies in a calcium-signalling based molecular communication system of the astrocytes, thus improving the existing efforts in understanding this complex communication channel. We also extend this model to account for the presence of AD in these communications systems, with the goal of analysing the signal propagation inside astrocytes networks when this type of neurodegeneration is at later stages of development.
III Ca2+ signalling-based Molecular Communication System
III-A Signalling Model
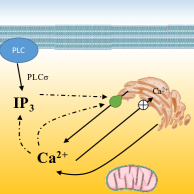
We model the calcium-signalling process in astrocytes based on the conventional and well accepted ODE equations by Lavrentovich and Hemkin [37]. The model is in accordance with experimental observation [37], and has been studied also in molecular communication systems by [32]. The three pool model includes: Ca2+ concentration in the cytosol () (Eq. 1); Ca2+ concentration in the endoplasmic reticulum () (Eq. 2); and IP3 concentration () (Eq. 3). They are represented by the following equations:
| (1) |
| (2) |
| (3) |
where is the flow of calcium from the extracellular space into the cytosol, is the rate of Ca2+ efflux from the cytosol to the extracellular space, is the leak flux from the endoplasmic reticulum into the cytosol and is the degradation of IP3. These terms and given by
| (4) | |||||
| (5) |
| (6) |
where the term (Eq. 4), models the calcium flux from the endoplasmic reticulum to the cytosol via IP3 stimulation. It is represented as, where is the maximum flux value of Ca2+ into the cytosol, and are the activating and inhibiting variables for the IP3 and the and are the Hill coefficients. The efflux of calcium from the sarco(endo)plasmic reticulum to the endoplasmic reticulum is modelled as , where is the maximum flux of Ca2+ in this process. Finally, describes IP3 generation by the Phosphoinositide phospholipase C (PLC) protein, where is the maximum flux of Ca2+ in this process, and is the Hill coefficient.
III-B Gap Junction Model
The gap junction stochastic model introduced by Baigent et al. [38] has been first studied for molecular communication by Kilinc and Akan [39] and later on by Barros et. al. [32]. We consider voltage-sensitive gap junctions with two states of conductance for each connexin: an open state with high conductance and a closed state with low conductance. Thereafter, the four basic combinations of states are considered: State HH: Both gates are in a high conductance state. This probability is denoted by ; State HL: One gate is in a high conductance state and the other is in a low conductance state. This probability is denoted by ; State LH: One gate is in a low conductance state and the other is in a high conductance state. This probability is denoted by ; State LL: Both gates are in a low conductance state. This probability is denoted by . Experimental validation of the model indicated that the state appears to present very low occurrence rates [40], thus we neglect that state here. Thus, the probabilities should follow
Moreover, , and are interrelated as follows:
| (7) |
| (8) |
where the control of the gap junctions is mediated through the potential difference of the membrane of two adjacent cells (), the gate opening rate is and gate closing rate is . The terms , , and are defined as , , , , where is the junctional voltage at which the opening and closing rates of the gap junctions have the same common value , and and are constants that indicate the sensitivity of a gap junction to the junctional voltage.
IV Astrocyte calcium signalling model under the influence of Alzheimer’s disease
The -amyloid hypothesis is essential to capture the changes in the calcium signalling in astrocytes with the goal of quantifying the signal propagation in the brain, as a whole. Within the later stages of the AD, the -amyloid plaques in the brain will interact with the cells, and in astrocytes, the calcium concentration is changed overall [41]. The temporal and spatial effects on this increase are not well covered by the neuroscience community and the characterisation of the relationship between affected astrocytes and their networks is still missing. Since experimental efforts in this scenario are rare due to the infrastructural capabilities and resources limitations, computational approaches are the most accessible method to study such systems. Towards this direction, we present an astrocyte intracellular calcium-signalling model under the influence of -amyloid plaques as an approach to studying the AD effect on these cells. Our model is an attempt to integrate both existing validated computational models and experimental results in the direction of a more complete description of the studied scenario. It is not a simple integration process since its construction was carefully carried out to maintain a valid relationship of linear and non-linear relationships intact between variables.
IV-A Signalling Model
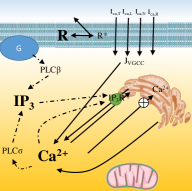
We use a baseline model for the intracellular calcium-signalling of astrocytes based on the work of [27]. We use four pool ODE to quantify the changes over time of: the cytoplasmic Ca2+ (), endoplasmic reticulum Ca2+ concentration , IP3 concentration () and active IP3R (R). First, consider
| (9) |
| (10) |
where , , , , , and which represent respectively the voltage-gated calcium channel, CCE calcium uptake, the inotropic receptor rate, calcium extrusion, rate of calcium leakage from the endoplasmic reticulum, rate of release of calcium from the endoplasmic reticulum and calcium pumping into the endoplasmic reticulum. In Equations 9 and 10, the effects of (fast) calcium buffering in the cytoplasm and in the endoplasmic reticulum stores are accounted for by defining effective rate constants and an effective diffusion coefficient.
We assume a non-linear rate of regulating capacitance Ca2+ as described in [42]
| (11) |
where and are the maximal rate constant for CCE influx and the half-inactivation constant for CCE influx respectively. The rate of calcium influx, induced by ionotropic receptors, from ECM to cytosol was modelled as in [42]:
| (12) |
where and are the maximal rate of stimuli-evoked inotropic calcium influx and the half-saturation constant for stimuli-evoked ionotropic calcium.
Similarly, the activation of G protein and PLC pathways, induced by metabotropic receptors, to promote the IP3 production were reformed from [42, 30] and modelled as:
| (13) |
where and are the maximal rate of IP3 production mediated by the metabotropic receptors and the dissociation constant for the binding of ligand/metabotropic receptors.
The following rate laws equation is chosen to model IP3-induced and calcium-induced calcium release, as well as the endoplasmic reticulum calcium regulation are modelled in the following as:
| (14) |
| (15) |
| (16) |
| (17) |
where the , , , , and are the rate of calcium extrusion from plasma membrane, the rate of calcium leak from the endoplasmic reticulum, the rate of calcium release through IP3 receptors, the half-saturation constant for calcium activation of the IP3 receptor and the half saturation constant for IP3 activation of the corresponding receptor, respectively. Even though there are pieces of evidence that the endoplasmic reticulum suffers stress under the -amyloid influence[43], we have not found enough data to construct a model based on the Hill equations, therefore, we do not explore this phenomenon in detail in our model.
IV-B IP3 Dynamics
The IP3 dynamics of astrocytes is essential to model the signalling process of astrocytes with AD due to the direct control of the calcium mimicking the experimental results. In addition to the activation of the IP3R by cytoplasmic calcium, we also account for a slower calcium-induced inactivation We use the IP3 concentration () and active IP3R (R), described as
| (18) |
| (19) |
| (20) |
| (21) |
| (22) |
where , , and are the rate constant of IP3 degradation, the rate constant of IP3 receptor inactivation and the half saturation constant for calcium activation of the IP3 receptor, respectively.
The modelling of complex calcium signals have to include stochastic processes in the IP3 pathway, and in this way, mimic the -amyloid effects on the intracellular calcium [12]. Adding a further term for stochastic IP3 production either by spontaneous PLC activation or by activation of PLC by stochastic synaptic inputs [37, 44]. Accordingly, IP3 production by PLC isoenzymes is described by [45]
| (23) |
where denotes the generation of a random number at time following a uniform distribution, and represents random modulations of the maximal rate of IP3 production; and respectively represent the instants of synaptically evoked and spontaneous nucleation of IP3/calcium spikes, which can be assumed to be approximately Poisson distributed, following experimental observations [46, 47].
To account for the sparse distribution of IP3 inside the network, we incorporated its diffusion in the overall IP3 dynamics model. The diffusion is defined as a summation of a set of flows from cell within the set of neighbouring cells , and defined as
| (24) |
each flow is defined as
| (25) |
where is the IP3 gradient between and , is the diffusive IP3 gradient threshold, increase slope of , and is the maximum diffusion coefficient flow. This model enables the direct multi-scale influence of -amyloid by interfering with the production of IP3 inside the astrocytes and its propagation in the network by the above presented non-linear transport process.
IV-C Gap Junction Model
We investigated how the existing efforts in the literature could impact the gap junction model presented in Section III-B. Experimental studies have presented results for gap junction behaviour under the influence of -amyloid for astrocytes in both in-vitro and in-vivo settings [13][5]. These studies observed that even with the changes in the calcium pathways, amplitude and signal velocity, the gap junctions performance were not changed and therefore inconclusive results were reached. Therefore, we use the same previously presented gap junction model in our proposed model.
IV-D VGCC models of the cellular membrane
Voltage-gated calcium channels are mechanisms that increase the calcium concentration of cells due to the membrane voltage, which can come from a different source, but in there, the different types is a wholesome approach to quantifying the overall values of the influence. Studies about the influence of -amyloid in the VGCC of astrocytes can be found in [14]. We want to calculate the current contribution to the increase of calcium concentration, the current was converted into the flux as
| (26) |
| (27) |
| Channel type | Equation of channel kinetics |
|---|---|
| T-type | |
| L-type | |
| N-type | |
| R-type | |
where is the volume of an astrocyte assumed as a spherical soma with a radius of . is the change rate of calcium concentration. And , , and the steady-state current of VGCCs that gives the total of calcium current flow through VGCCs in an individual cell (). The concrete formula for every type of calcium current is given in detail in Table I. In this way, not only the total calcium flux but also network influx via different VGCCs can be calculated.
IV-E Astrocyte Volume Model
The authors [15] using an immunohistochemical approach that observed the atrophy of astrocytes by measuring the surface, volume, and the relationship between astrocytes and neuritic plaques. Their results are relevant to temporal observations of volume changes in astrocytes. Since in our presented study we concentrate on the later stages of the AD, we use their results to modify the volume of astrocytes from 19.635 m3 to 11.027 m3, representing a total of 43.84% of the initial cell volume.
V Network Topologies Model
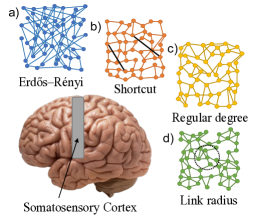
The spatial distribution of astrocytes and their connectivity can dictate the spatial signal propagation pattern of Ca2+ waves and change the molecular communication performance using this channel. It is important that is characterised and analysed so that new techniques can emerge to deal with this type of issue in the molecular communications community. Astrocytes networks are characterised to exhibit a large average number of connections per cells and that contain long-distance connections, small values of the mean shortest path and long-distance connections could instead promote signal propagation. The mapping process of astrocyte network topologies is challenging and relies upon sophisticated experimental approaches that combine both the molecular process that regulates their signalling process and imaging approaches that obtain their topology set up. In [6], the authors presented a collection of five topologies that were collected from the diverse literature review in the area including regular degree, link radius, shortcut networks, and Erdös Rényi. They were able to connect astrocytes network structures to known graph theory models. We use the same methodology to model the astrocyte network topologies and furthermore integrate with our molecular computational model presented in the previous sections, which are detailed in the following. In the end, these models will enable us to obtain also the spatial-temporal characterisation of calcium signal propagation in astrocyte network topologies.
V-A Types and models
We consider a cellular tissue space discretized into a 3D cubic lattice matrix () composed of cells (), where (; and ) denotes an arbitrary cell in the tissue. The cells are connected with a maximum of six neighbouring cells. The organisation of the cells is assumed to be a layered 3D lattice. Defining the topologies inside the 3D lattice is based on a graph that represents the tissue on a network level. This separation allows us to provide a flexible way to account for both intracellular pathways and intercellular signal propagation inside a pre-defined topology, and construct the multi-scale model. We consider a graph composed with cells as nodes and the set of links (edges), which each element is defined as a tuple of two arbitrary cells where (; and ). The cells are connected to a fixed number of other cells, and therefore , which is the number of connection per cell. In the following, we characterise the different topology models based on this initial description graph model of the spatial distribution of astrocytes within a given tissue area. We present the implementation details for each used topology:
-
1.
Regular degree networks: This type of network topology refers to as a static number for all cells, thus providing a homogeneous environment. Cells are connected to their nearest neighbours.
-
2.
Link radius networks: Consider a random variable that and represents the number of connections per cell inside an Euclidean distance . can be varied to increase the dynamism in the network topology organisation.
-
3.
Shortcut networks: This topology, defined as ”small world” networks are used for structures dependable on randomly connected cells at the edges of the network. Within we introduce that is the internode distance, and then, connect to the nearest neighbours with are multiple of or . In our implementation, this internode distance will connect directly the transmitter to a receiver in a communication channel. The remaining nodes of the network will follow the regular distribution with the number of neighbours.
-
4.
Erdös Rényi networks: is used for providing unconstrained spatial connection distribution between the nodes. We consider that cells are connected based on a probability . In this way, each cell will connect to the maximum of six cells selected arbitrarily. This choice is only performed for the first neighbouring cell, and the other connection choices are kept with the probability, so we can avoid an increasingly complex network topology.
VI Communication System Analysis
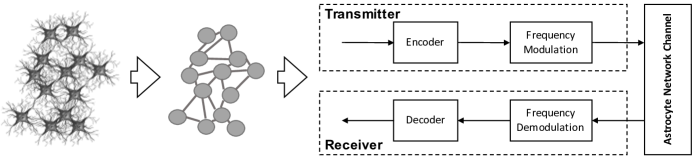
We designed a communication system that sends information through the astrocytes networks so we can measure the signal propagation effects in both scenarios and calculate the propagation extend, molecular delay and channel gain. The communication system is shown in Fig. 5, and consist of a transmitter, receiver and channel, which are depicted in Fig. 5 and described in the following.
-
1.
Transmitter: The transmitter is a cell positioned in the centre of an intermediary cut of the cellular tissue. This astrocyte is assumed to have an infinite source of calcium based on a stimulation mechanism that allows the execution of signal frequency modulation.
-
2.
Channel: The channel is the 3D astrocyte network. We model the different topologies that an astrocyte network can form, which describe the organisation of connection between the cells and is further explained in Section V. Each astrocyte in the network has an initial calcium concentration that is independently controlled by their regulatory calcium pathways and also has their random intercellular signals propagation. This mechanism is important for the regeneration of calcium along the tissue but can become a source of noise or interference.
-
3.
Receiver: The receiver is an astrocyte that is a few cells away from the transmitter. Once the calcium arrives in a determined concentration, the receiver is activated and initiates the reception of the calcium molecules. For this analysis, we assume no intracellular interference and optimal reception ligand reception.
| Parameter | Reference | Normal Value | Alzheimer Value | Unit |
|---|---|---|---|---|
| [43] | 0.0004 | 0.1 | 1/s | |
| [43] | 0.2 | 1.5 | 1/s | |
| [43] | 0.5 | 0.1 | 1/s | |
| [43] | 0.5 | 0.05 | 1/s | |
| [43] | 4 | 0.5 | 1/s | |
| [43] | 0.08 | 0.5 | 1/s | |
| [43] | 0.02 | 15 | M/s | |
| [43] | 0.3 | 0.5 | M | |
| [43] | 0.2 | 2.02 | M | |
| [43] | 0.2 | 0.15 | M | |
| [43] | 0.3 | 0.15 | M | |
| [43] | 35 | 0.1 | – | |
| [43] | 10 | 40 | M | |
| [43] | 0.01 | 2.2 | M/s | |
| [43] | 0.08 | free | /s | |
| [43] | 0.09 | 0.15 | M | |
| [43] | 0.5 | 0.5 | M/s | |
| [43] | 10 | 0.8 | M | |
| [48] | 2 | – | ||
| [48] | 300 | K | ||
| [48] | 8.31 | J/(mole K) | ||
| [48] | 8.31 | J/(mole K) | ||
| [48] | 8.31 | J/(mole K) | ||
| [48] | 96,485 | J/(Coul/mole) | ||
| [48] | 0.06 | pS | ||
| [48] | 3.5 | pS | ||
| [48] | 0.39 | pS | ||
| [48] | 0.2225 | pS | ||
| [48] | 5.223 10-13 | l | ||
| [12] | 0.15 | M/s | ||
| [12] | 0.15 | M/s | ||
| [12] | 0.3 | s | ||
| [12] | 30 | s | ||
| [49] | 3.64 | s-1 | ||
| [49] | 0.15 | M | ||
| [49] | 0.05 | M |
VI-A Multi-scale Molecular Computational Model
We use the Gillespie stochastic direct method ([50]) as a mean to produce accurate variability of the chemical reactions for the models described in Sections III and IV. Consider the same cellular space introduced in Section V. Using this process, at each time step, the Gillespie algorithm is executed to select a random cell and a random internal reaction of that cell, also scheduling a time step () to each one of them. Now, consider that each cell contains a set of internal reactions of the pools obtained from the previous reaction-diffusion models. This stochastic solver computes the values of each pool over time, selecting and executing scheduled reactions. The pool will be negatively or positively affected by a constant when a certain reaction is executed.
The process of executing one of the distinct reactions in requires a scheduling process divided into two phases—selecting a reaction and selecting a time step. Each reaction is allocated a reaction constant (). Considering that is the summation of all in , the next reaction chosen will be:
| (28) |
which follows the roulette wheel selection process, which selects the events based on their probability values. However, must satisfy the following restriction:
| (29) |
in which is a uniform random variable with values in the range .
At each time step (), a time lapse () is derived based on , and is represented as:
| (30) |
in which is a uniform random variable with values in the range . This process ends when , where is the set of and is the maximum simulation time.
We extend the Fick’s diffusion model to account for the propagation of molecules with gap junctions in a cellular tissue area. In this way, we are able to capture the temporal-spatial dynamics of intercellular Ca2+ signalling. We use Ca2+ concentration difference to model this temporal-spatial characteristic, as follows [51]:
| (31) |
where , , , is the diffusion coefficient, is the volume of the cell, and is the difference in Ca2+ concentration between the cells. is the probability of the gap junction opening and closing. Based on the gap junction probabilities, we define three different diffusion reactions for each cellular connection. Such reactions are the multiplication of the probabilities (, and ) with the regular intercellular diffusion probability. Our simulations suggest that changing the organisation of gap junction connections is enough to reproduce the large variability of the range of calcium signal propagation observed in experiments. For more information about the modelling consider the paper [32].
VI-B -Amyloid Assumptions
Due to the unknown effects of -Amyloid on the overall organisation and function of astrocytes networks and their calcium signalling [26], we are obligated to consider a few assumptions:
Assumption 1: There are different development stages of AD that are correlated with the different concentration of -Amyloid. We consider only a short timescale within the studied stage of the AD. It is not our objective to model changes of -Amyloid over time.
Assumption 2: We consider that the AD is at later development stages and that the -Amyloid is sparsely distributed with a homogeneous effect on the astrocytes network. There is currently no detailed spatial description of -Amyloid diffusion inside the brain.
Assumption 3: The networks are maintained at constant configuration throughout the whole analysis. This neglects the effects of cellular proliferation and cellular death that may come from the cellular stress caused by a certain concentration of -Amyloid, however, due to Assumption 1, this assumption does not hugely impact on our results.
VII Results
Our main objective is to obtain a detailed description of the changes that the presence of the -Amyloid has on the signal propagation of calcium within the molecular communication system embedded into an astrocyte network. These changes are quantitatively aggravated when there is topology diversity meaning, we will use the presented models to obtain also the changes of signal propagation inside that scenario. We used the models presented in Sections III, IV, V and VI. First, we analyse the single cell results for a single-scale analysis, and thereafter, we present results for the multi-scale analysis using metrics such as propagation extent, molecular gain and molecular delay for performance evaluation. The values for the simulation variables can be found in Table II. This whole computation model allows us to get the correlation of multiple scales of the astrocytes communication processes, starting from the intracellular scale (0-15m) till the intercellular signalling and networking (15-800m) and provide a comparison between healthy and AD astrocytes. We declare that the comparison between the healthy tissue scenario III and the AD scenario IV are valid for the communication system analysis but they are not sufficient to drive conclusions about treatment strategies for the disease just yet.
VII-A Single-scale analysis
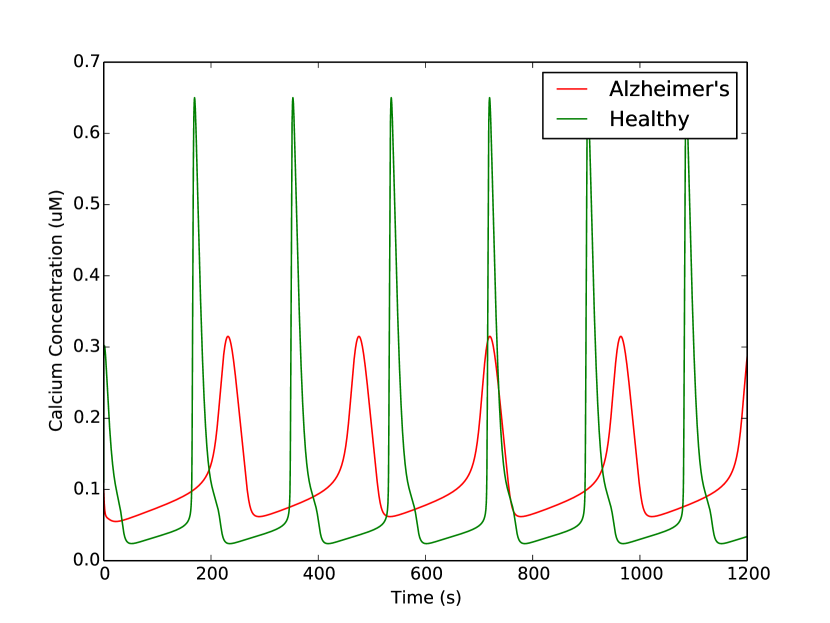
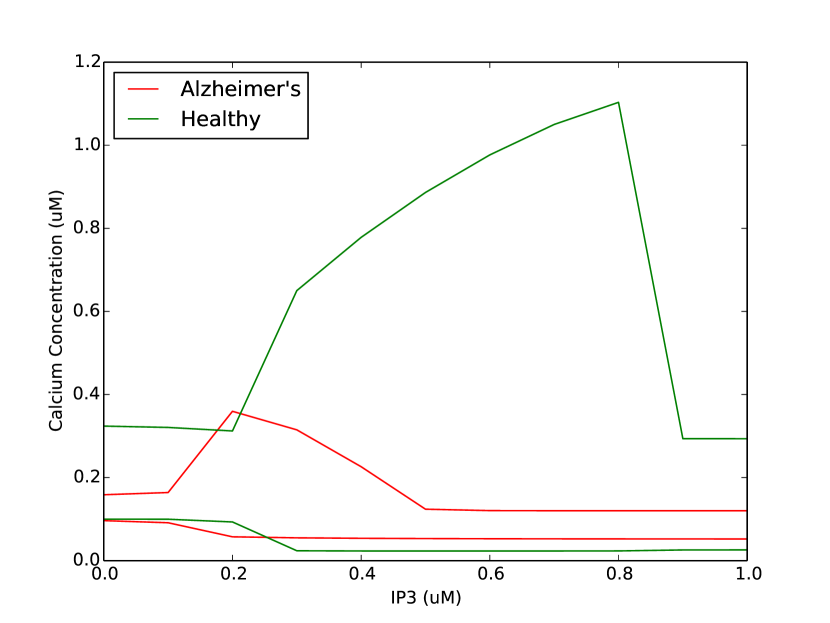
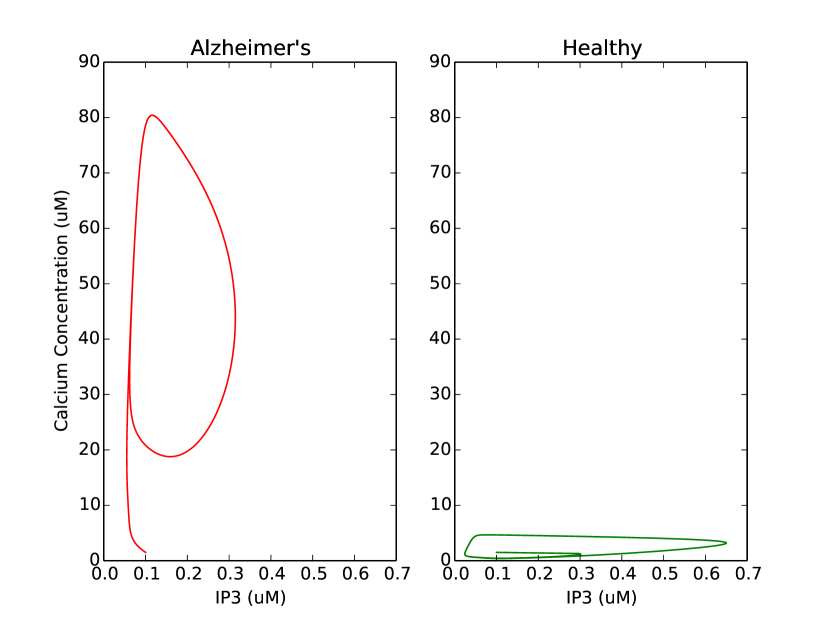
In Fig. 6, we show the results in solving the differential equations for healthy tissues (Eq. 1,2 and3) and AD (Eq. 9, 10, 18 and 19). This will provide sufficient understanding of the effects of -amyloid in astrocytes before we present the multi-scale analysis. In Fig 6 (a), we present the calcium oscillation patterns for healthy and AD scenarios. Both the frequency and peak of the oscillation change dramatically, which is explained by the overall effects of the -amyloid changes in the cell including IP3 dynamics, VGCC channels and intracellular pathways. The same changes are better captured by the calcium concentration response to the variation of IP3 in maximum and minimum values, in Fig. 6 (b). In the AD, the oscillations are confined to lower difference in the values that calcium can reach. However, In Fig. 6 (c), we show by the bifurcation analysis that even with lower differences of calcium values, in the AD, the signal in the cytosol is unstable.
VII-B Multi-scale analysis
In the presented multi-scale analysis we move from a single cell scenario to capture the effects of calcium propagation in both health and AD scenario in the scale of intercellular communication and network topologies. The stochastic simulator presented in Section VI-A allows this phenomenon to be captured by a computational approach.
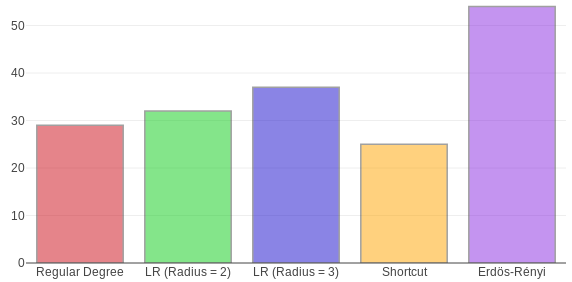
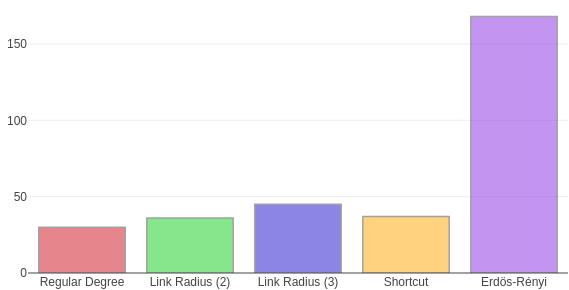
1) Propagation Extent: The propagation extent of calcium signals in the scenarios we are studying can be found in Fig. 7. In this metric, we analysed how the transmission of one astrocyte will trigger the activation of calcium production in a number of different cells. Our results suggest that the level of network organisation can hugely impact on the in the number of activated cells, which means, that depending on the distance between the transmitter and receiver, this can convert in interference from other cells. Especially for Erdös Rényi networks, where the dynamics of generating connections can ultimately increase the overall propagation extent. For both healthy and AD astrocyte networks, the performance of Erdös Rényi is superior to the remaining topologies. While the other topologies have a propagation extent around 30 for healthy tissues and 25 for AD tissues, Erdös Rényi topologies present 50 for healthy tissues and 150 for AD tissues. Another interesting information from these results is that the effect of -amyloid in the signal propagation can either increase and decrease the propagation extent. This means that there is an optimum topology arrangement that is aggravating the calcium propagation in different ways, and since the topologies resemble different parts of the brain, it is correlated in how the calcium signals can either provide more or fewer cells impacted by the presence of AD.
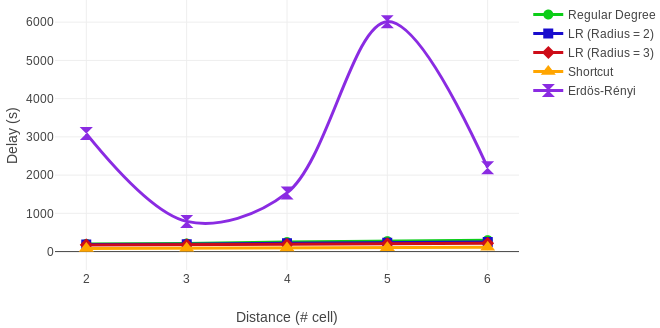
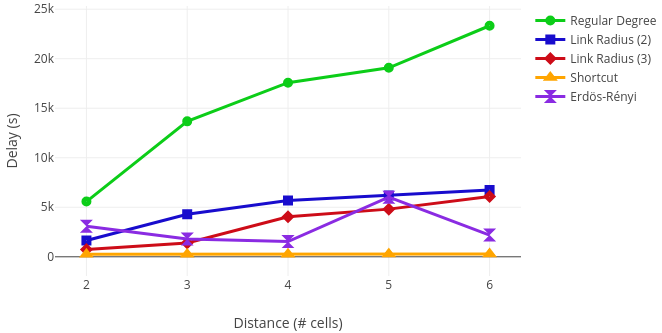
2) Molecular Delay: The molecular delay is a time-dependent measure of a concentration of calcium from the transmitter to the receiver [32], and depicted in Fig 8 (a) and Fig. 9 for both healthy and AD astrocytes. First, it is worth mentioning the different patterns of delay that are obtained from the different network topologies for both healthy and AD. The Erdös Rényi network topology is presented with an oscillatory delay dependent on distance variation due to its connection probability distribution over the network, which can create more paths to the receiver nodes and allowing more calcium to flow towards them. The same level effect is not observed in the other topologies as delays increases over distance. There is a delay increase in the AD, which its factor is dependent on the network topology. The regular degree is found to have the highest delay increase factor moving from around 100s of delay to a maximum of 25000s. The increase for the other types of the network was more modest, coming from an average around 2000s to a maximum of 5000s. This increase can be explained by the alteration of both cellular volume and VGCC channels, which are changed by the effect of -amyloid in astrocytes. By the decrease of cellular volume (IV-E), the diffusion flow rate is changed accordingly, and this increased effect will propagate the molecules quicker and thus increasing the multi-paths propagation inside the tissue. For a network with the regular degree, that means the homogeneous configuration of the network contributes to this dispersion of molecules causing the multi-paths effects. The VGCC channels will contribute to this effect since the post-synaptic voltage stimulus is captured by Eqs. 26 and 27, and the decrease of neural rhythms is a direct modulator of astrocytes activity.
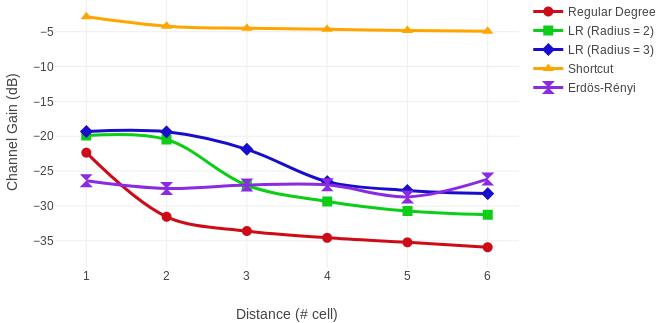
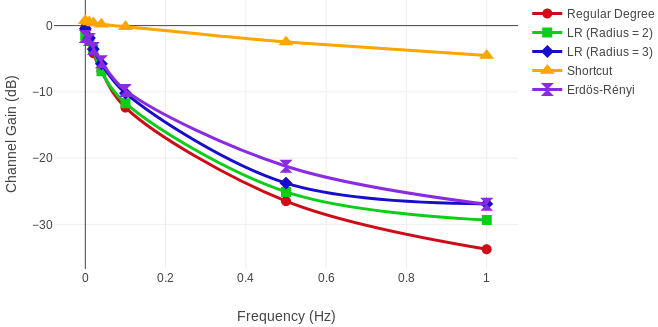
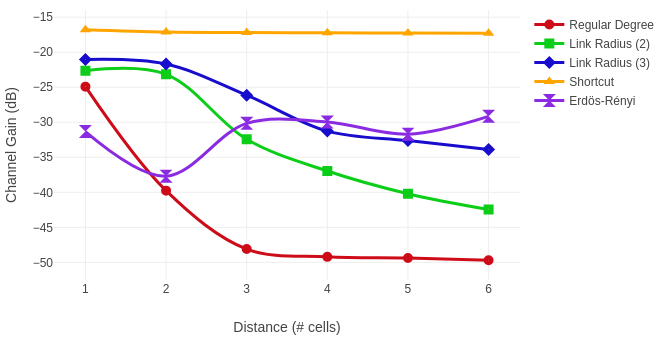
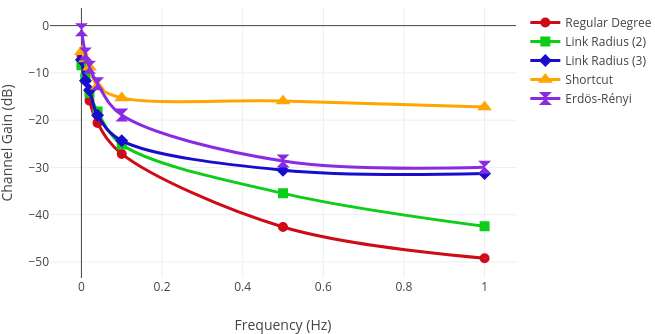
3) Channel Gain: The channel gain is a measure of how much of the molecules initial sent have been received within a given pre-determined interval. We analysed the channel gain for both distance between transmitter and receiver (8 (b) and Fig. 9 (b)) and frequency of oscillations in the transmitter (8 (c) and Fig. 9 (c)). For all graphs, it is clear that the shortcut topology presents the best channel gain performance, which is expected with an average of dB. For increased randomness of the network connection probabilities, for topologies Link Radius (3) and Erdös Rényi, the channel capacity performs better, depending on the distance and the frequency. Link Radius (3) has a more homogeneous distribution that allows the short distance cells to receive more molecules with an average of dB, however, for longer distances and also increase frequency, the heterogeneous configuration of the Erdös Rényi allows an increased reception of calcium by the increased multi-path propagation with an average of dB. Because this is subject to time settings, both increasing or decreasing the pre-determined interval might change the presented results. Lastly, the AD seems to worsen the calcium propagation in the cellular tissue due to the IP3 dynamics that create non-linear effects of the calcium regeneration mechanism inside the cells from Eq. 23, 24 and 25.
VIII Discussion
The multi-scale effect in the brain is an essential mechanism to capture the signal propagation of different types of signals in the brain since the intracellular relationship of brain cells can affect the intercellular communication, the networks of cells and ultimately the networks of networks [52]. This complexity is poorly understood by neuroscientists, and there are very few proposed physical bionano interfaces that enable the study of this phenomenon in-vivo [53]. The computational approach presented here is time relevant and very important to understand the effects of the AD in cortical columns, but there is still work to be carried further. Since the relationship of neurons and astrocytes is not the focus of this paper, more efforts should appear in that regards by trying to incorporate astrocyte models in the cortical column models of the neurons such as the Digitalization of the Neocortical Column by the Blue Brain Project [54]. This computational effort can pave the way for a greater understanding of the multi-scale effects before the physical interfaces to start being implemented. Moreover, these bionano interfaces can probably be limited to some cell contact points and the study of computational approaches that can infer the detailed signal propagation inside cortical columns is very relevant, and the molecular communications community has a crucial role in that.
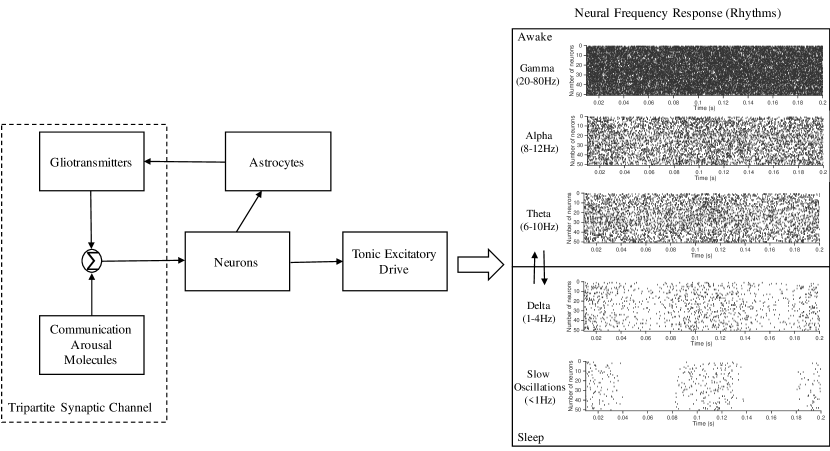
As briefly explained in the results, the neural rhythms or, in other words, the different frequencies values of spiking activity in neurons can change depending on the type of neurons and region of the brain. In Fig 10, we present an initial model of the relationship of the tripartite synapses (connections between pre and postsynaptic neurons with the astrocytes through the synaptic cleft) and the neuron frequency response, inspired by [41]. This interesting relation between astrocytes and neurons is directly related to the neural rhythms [21, 22]. The released gliotransmitter from astrocytes to the synaptic cleft has a significant role in the synaptic plasticity, which is the mechanism needed for ensuring the propagation of higher neuronal frequencies. The short-term memory is only formed through higher frequency neurons during the awake stage [41]. In the AD, the short-term memories are not formed if the synaptic plasticity is not strong enough [41]. We showed in our paper that delay and gain, which relates to the time periods and calcium concentration in astrocytes, and it can potentially be linked to the weak short-term plasticity and loss of short-term memory. We also showed that astrocytes with AD will have an increased delay and decreased gain due to the influence of -amyloid. That means this alteration of signal propagation performance over the networks could be a link to the frequency response and ultimately answer the effects of short-term memory loss from a network perspective. This is a very important approach for the early AD detection, and together with bionano sesing with new bionano interfaces, could find a way to bring hope to Alzheimer’s patients and try to stop the progress of the disease by detecting it as early as possible.
IX Conclusions
Future nanobio sensing techniques will rely upon inference techniques based on computational models of tissues to obtain a detailed description of cellular networks. In the brain, astrocyte networks present different types of topologies. They are severely impacted by the presence of -amyloid plaques, which is linked as one of the causes of Alzheimer’s disease. In this paper, we propose a computational approach that captures the effect of -amyloid in the calcium signalling of astrocytes. It accounts for the changes in intracellular pathways, IP3 dynamics, gap junctions, voltage-gated calcium channels and astrocytes volume. We implemented the shortcut networks, regular degree networks, Erdös Rényi networks and link radius networks topologies. Lastly, we designed a communication system to evaluate the propagation extend, molecular delay and channel gain metrics with frequency modulation of calcium signals. The results show that the more unstable but at the same time lower level oscillations of Alzheimer’s astrocyte networks. This single cell effect can create a multi-scale impact on communication between astrocytes with the AD by changing the propagation extend in all network topologies, increasing the molecular delay and lowering the channel gain compared to healthy astrocytes. These observations are different in the many network topologies, but with an increased impact in Erdös Rényi networks and link radius networks topologies. Even though we have drafted a holistic approach to capturing the effect of the AD in astrocytes networks in a computational approach, more work needs to be carried further. For example, astrocytes networks with AD should be implemented with connections to neuron microcolumns of the cortex. Moreover, the effects of -amyloid plaques need to be considered in the synaptic cleft and neurons for a more accurate characterisation of the impact of the AD in the brain.
References
- [1] I. Akyildiz, M. Pierobon, S. Balasubramaniam, and Y. Koucheryavy, “The internet of bio-nano things,” IEEE Communications Magazine, vol. 53, no. 3, pp. 32–40, March 2015.
- [2] M. T. Barros, “Ca2+-signaling-based molecular communication systems: Design and future research directions,” Nano Communication Networks, vol. 11, no. 1, pp. 103–113, 2017.
- [3] S. A. Wirdatmadja, M. T. Barros, Y. Koucheryavy, J. M. Jornet, and S. Balasubramaniam, “Wireless optogenetic nanonetworks: Device model and charging protocols,” arXiv preprint arXiv:1706.06495, 2017.
- [4] O. B. Akan, H. Ramezani, T. Khan, N. A. Abbasi, and M. Kuscu, “Fundamentals of molecular information and communication science,” Proceedings of the IEEE, vol. 105, no. 2, pp. 306–318, 2017.
- [5] N. J. Haughey and M. P. Mattson, “Alzheimer’s amyloid -peptide enhances atp/gap junction-mediated calcium-wave propagation in astrocytes,” Neuromolecular medicine, vol. 3, no. 3, pp. 173–180, 2003.
- [6] J. Lallouette, M. D. Pitta, E. Ben-Jacob, and H. Berry, “Sparse short-distance connection enhance calcium wave propagation in a 3D model of astrocytes networks,” Frontiers in Computation Neuroscience, vol. 8, no. 45, pp. 1–18, 2014.
- [7] J. Hardy and D. Allsop, “Amyloid deposition as the central event in the aetiology of alzheimer’s disease,” Trends in pharmacological sciences, vol. 12, pp. 383–388, 1991.
- [8] D. J. Selkoe and J. Hardy, “The amyloid hypothesis of alzheimer’s disease at 25 years,” EMBO molecular medicine, vol. 8, no. 6, pp. 595–608, 2016.
- [9] J. Hardy and D. J. Selkoe, “The amyloid hypothesis of alzheimer’s disease: progress and problems on the road to therapeutics,” science, vol. 297, no. 5580, pp. 353–356, 2002.
- [10] D. J. Selkoe, “The molecular pathology of alzheimer’s disease,” Neuron, vol. 6, no. 4, pp. 487–498, 1991.
- [11] A. Demuro and I. Parker, “Cytotoxicity of intracellular a42 amyloid oligomers involves ca2+ release from the endoplasmic reticulum by stimulated production of inositol trisphosphate,” Journal of Neuroscience, vol. 33, no. 9, pp. 3824–3833, 2013.
- [12] V. Matrosov, S. Gordleeva, N. Boldyreva, E. Ben-Jacob, A. Semyanov, V. Kazantsev, and M. De Pittà, “Emergence of regular and complex calcium oscillations by inositol 1, 4, 5-trisphosphate signaling in astrocytes,” arXiv preprint arXiv:1706.08138, 2017.
- [13] N. F. Cruz, K. K. Ball, and G. A. Dienel, “Astrocytic gap junctional communication is reduced in amyloid--treated cultured astrocytes, but not in alzheimer’s disease transgenic mice,” ASN neuro, vol. 2, no. 4, p. AN20100017, 2010.
- [14] S. Zeng, B. Li, S. Zend, and S. Chen, “Simulation of spontaneous ca2+ oscillations in astrocytes mediated by voltage-gated calcium channels,” Biophysical Journal, vol. 97, pp. 2429–2437, 2009.
- [15] M. Olabarria, H. N. Noristani, A. Verkhratsky, and J. J. Rodríguez, “Concomitant astroglial atrophy and astrogliosis in a triple transgenic animal model of alzheimer’s disease,” Glia, vol. 58, no. 7, pp. 831–838, 2010.
- [16] I. Dal Prà, U. Armato, and A. Chiarini, “Astrocytes’ role in alzheimer’s disease neurodegeneration,” in Astrocyte-Physiology and Pathology. InTech, 2018.
- [17] C. Giaume, “Astroglial wiring is adding complexity to neuroglial networking,” Frontiers in neuroenergetics, vol. 2, p. 129, 2010.
- [18] M. Goldberg, M. De Pittà, V. Volman, H. Berry, and E. Ben-Jacob, “Nonlinear gap junctions enable long-distance propagation of pulsating calcium waves in astrocyte networks,” PLoS computational biology, vol. 6, no. 8, p. e1000909, 2010.
- [19] Y. Fujii, S. Maekawa, and M. Morita, “Astrocyte calcium waves propagate proximally by gap junction and distally by extracellular diffusion of atp released from volume-regulated anion channels,” Scientific Reports, vol. 7, no. 1, p. 13115, 2017.
- [20] T. Manninen, R. Havela, and M.-L. Linne, “Reproducibility and comparability of computational models for astrocyte calcium excitability,” Frontiers in neuroinformatics, vol. 11, 2017.
- [21] K. Lenk, E. Räisänen, and J. A. Hyttinen, “Understanding the role of astrocytic gaba in simulated neural networks,” in Engineering in Medicine and Biology Society (EMBC), 2016 IEEE 38th Annual International Conference of the. IEEE, 2016, pp. 6121–6124.
- [22] G. Wallach, J. Lallouette, N. Herzog, M. De Pittà, E. B. Jacob, H. Berry, and Y. Hanein, “Glutamate mediated astrocytic filtering of neuronal activity,” PLoS computational biology, vol. 10, no. 12, p. e1003964, 2014.
- [23] Z. Szabó, L. Héja, G. Szalay, O. Kékesi, A. Füredi, K. Szebényi, Á. Dobolyi, T. I. Orbán, O. Kolacsek, T. Tompa et al., “Extensive astrocyte synchronization advances neuronal coupling in slow wave activity in vivo,” Scientific Reports, vol. 7, no. 1, p. 6018, 2017.
- [24] L. Roux, K. Benchenane, J. D. Rothstein, G. Bonvento, and C. Giaume, “Plasticity of astroglial networks in olfactory glomeruli,” Proceedings of the National Academy of Sciences, p. 201107386, 2011.
- [25] V. Houades, A. Koulakoff, P. Ezan, I. Seif, and C. Giaume, “Gap junction-mediated astrocytic networks in the mouse barrel cortex,” Journal of Neuroscience, vol. 28, no. 20, pp. 5207–5217, 2008.
- [26] J. Latulippe, D. Lotito, and D. Murby, “A mathematical model for the effects of amyloid beta on intracellular calcium,” PloS one, vol. 13, no. 8, p. e0202503, 2018.
- [27] E. Toivari, T. Manninen, A. K. Nahata, T. O. Jalonen, and M.-L. Linne, “Effects of transmitters and amyloid-beta peptide on calcium signals in rat cortical astrocytes: Fura-2am measurements and stochastic model simulations,” PLoS One, vol. 6, no. 3, p. e17914, 2011.
- [28] J. C. De and G. Dupont, “The progression towards alzheimer’s disease described as a bistable switch arising from the positive loop between amyloids and ca (2+).” Journal of theoretical biology, vol. 331, pp. 12–18, 2013.
- [29] M. Pitta, M. Goldberg, V. Volman, H. Berry, and E. Ben-Jacob, “Glutamate regulation of calcium and ip3 oscillating and pulsating dynamics in astrocytes,” Journal of Biological Physics, vol. 35, pp. 383–411, 2009.
- [30] T. Höfer, L. Venance, and C. Giaume, “Control and plasticity of intercellular calcium waves in astrocytes: a modeling approach,” Journal of Neuroscience, vol. 22, no. 12, pp. 4850–4859, 2002.
- [31] D. A. Iacobas, S. O. Suadicani, D. C. Spray, and E. Scemes, “A stochastic two-dimensional model of intercellular ca2+ wave spread in glia,” Biophysical journal, vol. 90, no. 1, pp. 24–41, 2006.
- [32] M. T. Barros, S. Balasubramaniam, and B. Jennings, “Comparative end-to-end analysis of ca2+ signaling-based molecular communication in biological tissues,” IEEE Transactions on Communications, vol. 63, no. 12, pp. 5128–5142, December 2015.
- [33] F. Mesiti, P. A. Floor, and I. Balasingham, “Astrocyte to neuron communication channels with applications,” IEEE Transactions on Molecular, Biological and Multi-Scale Communications, vol. 1, no. 2, pp. 164–175, 2015.
- [34] M. T. Barros and S. Dey, “Set point regulation of astrocyte intracellular ca2+ signalling,” in The 17th IEEE International Conference on Nanotechnology (IEEE NANO 2017),, 2017, pp. 315–320.
- [35] ——, “Feed-forward and feedback control in astrocytes for ca2+-based molecular communications nanonetworks,” bioRxiv, p. 177154, 2017.
- [36] M. T. Barros, S. Balasubramaniam, and B. Jennings, “Using information metrics and molecular communication to detect cellular tissue deformation,” IEEE Transactions on Nanobioscience, vol. 13, no. 3, pp. 278–288, 2014.
- [37] M. Lavrentovich and S. Hemkin, “A mathematical model of spontaneous calcium(ii) oscillations in astrocytes,” Journal of Theoretical Biology, vol. 251, pp. 553–560, 2008.
- [38] S. Baigent, J. Stark, and A. Warner, “Modelling the effect of gap junction nonlinearities in systems of coupled cells.” Journal of Theoretical Biology, vol. 186, pp. 223–239, 1997.
- [39] D. Kilinc and O. B. Akan, “An information theoretical analysis of nanoscale molecular gap junction communication channel between cardiomyocytes,” IEEE Transactions on Nanotechnology, vol. 12, no. 2, pp. 129–136, March 2013.
- [40] F. F. Bukaukas, A. Bukauskiene, M. V. L. Bennett, and V. K. Verselis, “Gating properties of gap junction channels assembled from connexin43 and connexin 43 fused with green fluorescent protein,” Biophysics Journal, vol. 81, pp. 137–152, 2013.
- [41] M. J. Berridge, “The inositol trisphosphate/calcium signaling pathway in health and disease,” Physiological reviews, vol. 96, no. 4, pp. 1261–1296, 2016.
- [42] A. Di Garbo, M. Barbi, S. Chillemi, S. Alloisio, and M. Nobile, “Calcium signalling in astrocytes and modulation of neural activity,” Biosystems, vol. 89, no. 1-3, pp. 74–83, 2007.
- [43] E. Alberdi, A. Wyssenbach, M. Alberdi, M. V. Sánchez-Gómez, F. Cavaliere, J. J. Rodríguez, A. Verkhratsky, and C. Matute, “Ca2+-dependent endoplasmic reticulum stress correlates with astrogliosis in oligomeric amyloid -treated astrocytes and in a model of a lzheimer’s disease,” Aging Cell, vol. 12, no. 2, pp. 292–302, 2013.
- [44] F. Aguado, J. F. Espinosa-Parrilla, M. A. Carmona, and E. Soriano, “Neuronal activity regulates correlated network properties of spontaneous calcium transients in astrocytes in situ,” Journal of Neuroscience, vol. 22, no. 21, pp. 9430–9444, 2002.
- [45] Y.-W. Wu, X. Tang, M. Arizono, H. Bannai, P.-Y. Shih, Y. Dembitskaya, V. Kazantsev, M. Tanaka, S. Itohara, K. Mikoshiba et al., “Spatiotemporal calcium dynamics in single astrocytes and its modulation by neuronal activity,” Cell Calcium, vol. 55, no. 2, pp. 119–129, 2014.
- [46] W. R. Softky and C. Koch, “The highly irregular firing of cortical cells is inconsistent with temporal integration of random epsps,” Journal of Neuroscience, vol. 13, no. 1, pp. 334–350, 1993.
- [47] A. Skupin, H. Kettenmann, U. Winkler, M. Wartenberg, H. Sauer, S. C. Tovey, C. W. Taylor, and M. Falcke, “How does intracellular ca2+ oscillate: by chance or by the clock?” Biophysical Journal, vol. 94, no. 6, pp. 2404–2411, 2008.
- [48] S. Zeng, B. Li, S. Zeng, and S. Chen, “Simulation of spontaneous ca2+ oscillations in astrocytes mediated by voltage-gated calcium channels,” Biophysical journal, vol. 97, no. 9, pp. 2429–2437, 2009.
- [49] J. Lallouette, “Modélisation des réponses calciques de réseaux d’astrocytes: Relations entre topologie et dynamiques,” Ph.D. dissertation, INSA de Lyon, 2014.
- [50] D. T. Gillespie, “Exact stochastic simulation of coupled chemical reactions,” Journal of Physical Chemistry, vol. 81, no. 25, pp. 2340–2361, 1977.
- [51] T. Nakano and J.-Q. Liu, “Design and analysis of molecular relay channels: An information theoretic approach,” IEEE Transactions on NanoBioscience, vol. 9, pp. 213–221, 2010.
- [52] A. Avena-Koenigsberger, B. Misic, and O. Sporns, “Communication dynamics in complex brain networks,” Nature Reviews Neuroscience, vol. 19, no. 1, p. 17, 2018.
- [53] Y. Jiang, X. Li, B. Liu, J. Yi, Y. Fang, F. Shi, X. Gao, E. Sudzilovsky, R. Parameswaran, K. Koehler et al., “Rational design of silicon structures for optically controlled multiscale biointerfaces,” Nature Biomedical Engineering, vol. 2, no. 7, p. 508, 2018.
- [54] H. Markram, “The blue brain project,” Nature Reviews Neuroscience, vol. 7, no. 2, p. 153, 2006.