Two-axis goniometer for single-crystal nuclear magnetic resonance measurements
Abstract
We report the design and construction of a two-axis goniometer capable of any sample orientation with respect to the external magnetic field. The advantage of this design is that it allows free rotations around a single axis independent of the other which minimizes rotational error without reduction of angle range. Goniometer is capable of operating with high precision at both low and high temperatures and in high magnetic fields. It was mounted on the custom made nuclear magnetic resonance probe for use in Oxford Instruments wide-bore variable field superconducting magnet.
I Introduction
In the field of solid-state physics it is not uncommon to work with materials of anisotropic crystal structure. Plenty of physical properties show anisotropies, such as transport, mechanical and optical properties, which all depend on the crystal orientation of external excitations. Magnetism brings even more anisotropies, as interactions can be anisotropic, e.g. single-ion anisotropy, Dzyaloshinskii-Moriya, staggered -tensor component… Because of this vast number of reasons for material to posses anisotropy, there is a need for precise sample orientation during physical measurements. This allows us to control the properties of the system and determine all the anisotropic components or reduce the anisotropy by choosing a highly symmetric orientation.
Nuclear magnetic resonance (NMR) and nuclear quadrupole resonance (NQR) techniques are very powerful probes for investigation of local electric and magnetic fields that provide microscopic insight into chemical, electronic and spin structure of novel and interesting materials. Both techniques detect splitting of nuclear spin energy levels due to magnetic and electric interactions – NMR refers to the case when splitting is mostly due to external magnetic field and NQR when it is due to electric field gradient (EFG) on nuclei site. In both cases, energy levels are described by a Hamiltonian:
where is gyromagnetic ratio, is nuclear spin, is quadrupolar moment of nucleus, and define EFG tensor in its pricipal axes. Tensor component is the largest value and is the asymmetry parameter. Polar angle and azimuthal angle describe the position of the external magnetic field in the coordinate system of the EFG principal axes. Since these are microscopic techniques, they can detect crystal misalignments the precision of 1° in-situ.
To properly determine interactions and their anisotropies of a specific material, a single crystal sample is required. Furthermore, for a local non-cubic symmetry at a specific atom site the EFG is nonzero which provides measurement anisotropy that one must take into account while performing NMR measurements. This anisotropy can occur even in the case of a cubic crystal cell. For these reasons, it is highly useful to include a two-axis goniometer in the NMR setup.
The samples used in NMR investigations of condensed matter physics are usually small. To optimize the signal strength of the the nuclei of interest it is important for the measurement coil to be wound directly around the sample. This increases the filling factor Poole (1997); Hoult and Richards (1976) (ratio of sample volume to coil volume: ) and considerably reduces the signal losses. This imposes a restriction to the goniometer design: it is highly desired that goniometer has enough space to rotate the coil together with the sample. This excludes designs where the rotator is small so that it can be placed inside the (much larger) coil.Vosegaard et al. (1996)
Previous goniometer designs usually have limited available angle of rotation Shiroka et al. (2012), or include differential gear setup Herzog and Evetts (1994); Suzuki et al. (1997), where sample rotates around one rotational axis by turning both driving gears together in-phase, while rotation around other axis is achieved by rotating them in antiphase. Thus we can say that rotations are coupled together with some arithmetic relation connecting the angles of rotation. This can complicate precise rotation around a single axis and might increase error due to rotation of both driving gears. Other goniometers, that had decoupled rotations were constrained in terms of obtainable angles. Our approach was to have one axis freely rotating independent of the other to minimize rotational error while maintaining all possible obtainable angles.
Below is a description of our two-axis goniometer setup. Its main novelties include high precision achieved with meticulous machining of small parts, functioning at high magnetic fields and in wide temperature range as it is made from non-magnetic materials of similar temperature expansion coefficient. At the same time, by using commercially available parts when available, low cost of manufacturing is achieved.
II Design and manufacture
The goniometer was designed and manufactured to be used in a wide bore ( mm) variable temperature insert (VTI) of Oxford Instruments variable field superconducting magnet (up to T). For this it had to be mounted on a suitable probe that also contains NMR circuitry – tuning and matching capacitors, soldering point for NMR coil and a semi-rigid coaxial cable that connects the NMR circuitry at one end to the top of the probe which leads outside the VTI. The probe was custom made to accommodate the goniometer and two turning rods to rotate the sample. To aid in rotations, two mechanical counters were added to the turning rods.
Goniometer was contrived with several important requirements: (1) to be precise in both axes; (2) to work in high magnetic fields and wide temperature range; (3) to be able to achieve any sample orientation; (4) to maximize sample space;
To meet the first two requirements the authors designed the goniometer with tight fitting of parts and by choosing dimensions that minimize backlash. This provides a precise rotation control. Since most of the parts fit together with another part of the same material, they can contract or elongate by a same amount, remaining in perfect fit at any temperature. Brass was chosen as the material for the manufacturing, since it is easily available and has good physical properties: it is non-magnetic, good at heat conduction (important for sample thermalization), rigid and easily machinable. Brass has a fairly good bearing properties, especially in the regime of non continuous rotations. Because of this, low-friction materials were not used for bearings, further reducing the risk of jam due to different materials in tight fit. Last two requirements were met by carefully designing parts.
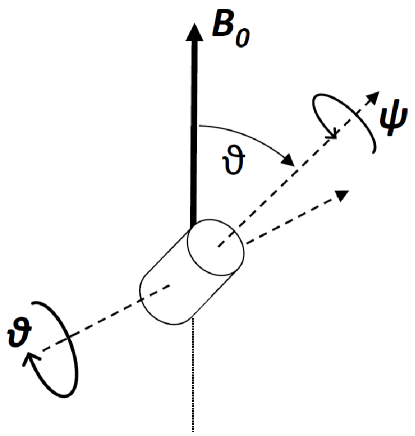
The goniometer design is shown in Fig. 2. Bevel gear with sample mount (C3) is mounted on cradle (B3) that makes rotations of angle (Fig. 1). Other rotation (of angle in Fig. 1) is made by rotation of the aforementioned bevel (C3). Angles and are standard Euler angles: is azimuthal rotation and is rotation around vector defined by azimuthal rotation. Mechanical rotations are carried with two worm gears with gear ratio 36:1. One worm wheel (B1) is directly connected to cradle and the other (C1) is connected to axle that freely rotates around cradle. Axle rotates bevel gear (C3) which turns sample.
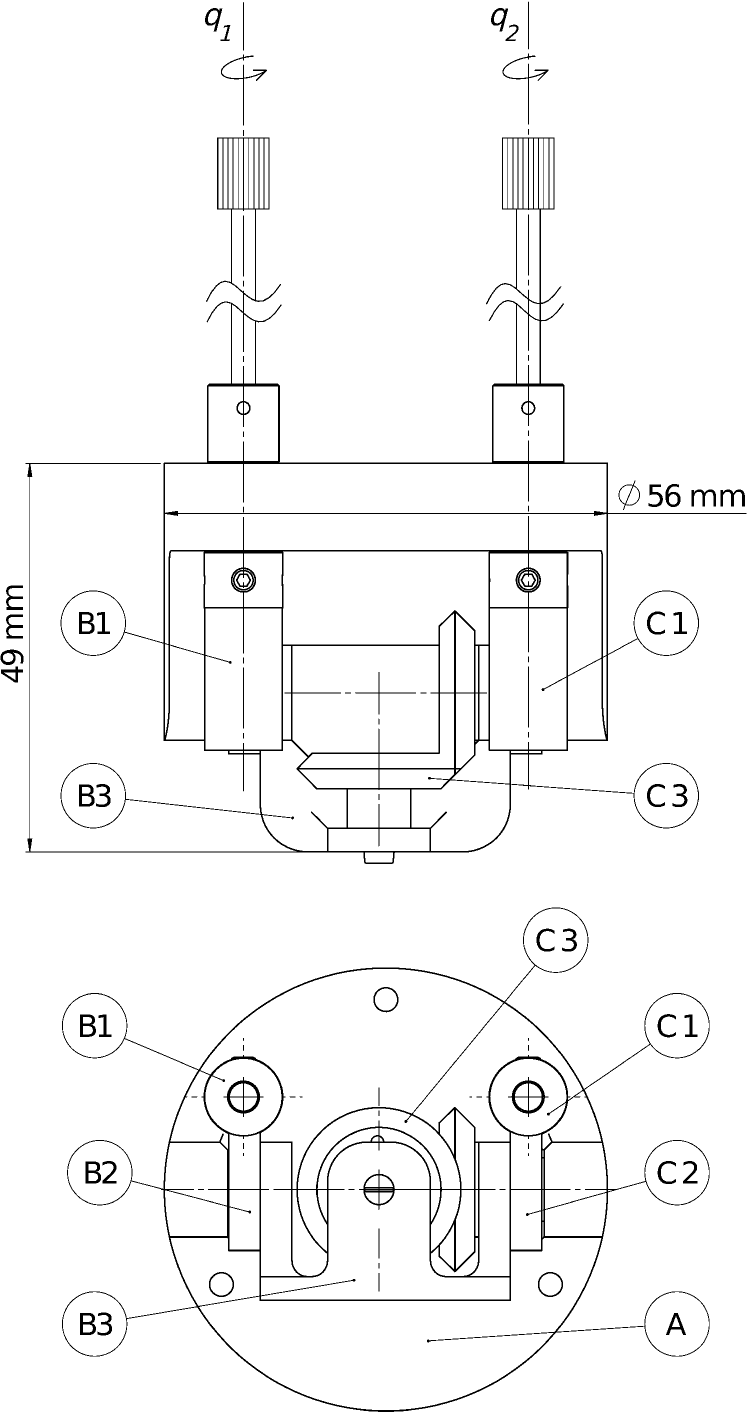
The sample is mounted on an exchangeable sample mount (not shown) that is fastened to bevel gear C3. Mount should be made from rigid insulating material (such as POM, PIA, PEEK …), and its height places the sample at the crossing of rotation axes.
The two bevel gears are identical and have an external diameter of 20.7 mm with a flat surface on top, which is 14.8 mm in diameter. This gives a large sample space and provides an easy mount of electrical connections.
Rotation of the sample is done as follows: for the rotation, both worm gears must be turned by the same amount. For the rotation, only the worm (C1) is turned. If we define and to be input rotations made to the worms C1 and B1 respectively, we can write the angle of rotations as:
| (2) | ||||
| (3) |
The numerator value (36) comes from the gear ratio of 36:1, i.e. if one makes a full turn with the worm (°) worm gear rotates 10°. Standard goniometer orientation with (0°,0°) is as shown on the figure 2. From this orientation, the cradle () can rotate °, while rotation is constrained only by the physical contacts of the NMR coil. By carefully choosing lead lengths for the coil, a full rotation (°) is easily obtainable. These two rotations provide every possible orientation a sample can have. During the operation care should be taken to always approach the desired orientation from the same side (e.g. by clockwise rotation of both worms), as to reduce backlash.
Worm gears and bevel gears were acquired commercially. We used a commercial machine shop to manufacture support structures (body and cradle) and modify the gears to our design. Axles and gear modifications were made with high-precision wire-EDM machine. Manual polishing was used where extra-tight fit was required.
III Applications and discussion
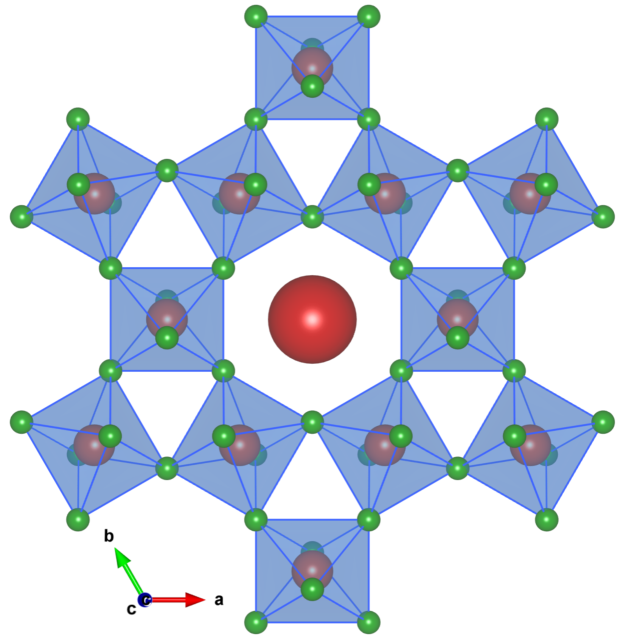
The goniometer was tested by 133Cs NMR measurement of the Cs2Cu3SnF12 compound. The system consists of kagome planes that are formed by Cu2+ ions connected via Cu-F-Cu bonds shown in Fig. 3. Kagome planes extend in crystallographic planes. From the structure of the compound Ono et al. (2009) it can be seen that the Cs site occupies Wyckoff position , which means that it has a local symmetry. This will result in an axial () EFG with the principal axis along the axis of the crystal (perpendicular to the kagome planes). This makes 133Cs NMR perfect for testing the goniometer, as observation of its quadrupolar splitting is well understood Slichter (1990); Abragam (1961) and we know what is expected for the case of 133Cs nucleus (spin I).
In Fig. 4 we show the angle dependence of the 133Cs spectra measured at magnetic field value of 8 T, when the axis of rotation is in the plane. From the spectrum at each angle value we can extract two informations: the quadrupolar splitting value (shown in the lower right panel) and the frequency shift of the total spectrum (shown in the upper right panel).As we can see, the ratio of the values at 0° and 90° is within the error bar of the measurement (less than the symbol size).
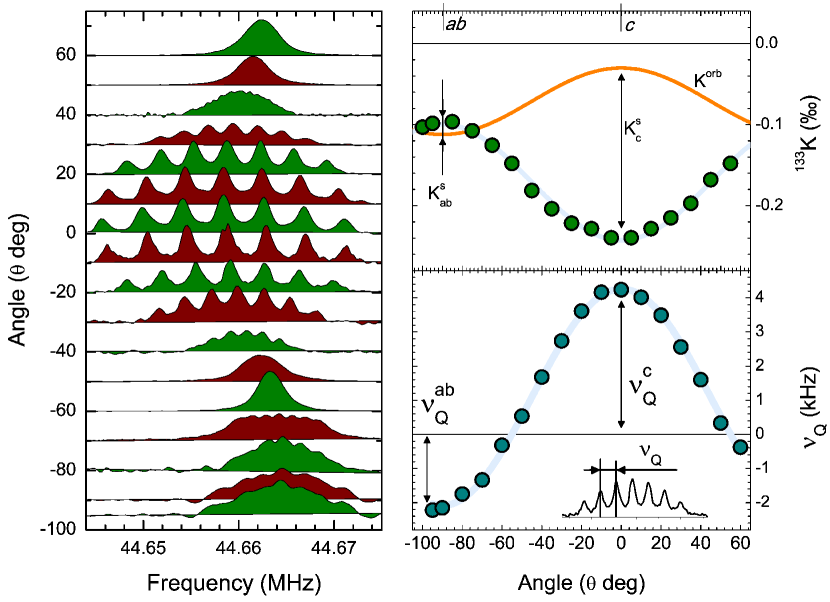
This is exactly what is expected for case, since then by definition we have , and from Laplace equation () it follows .
The frequency shift of the NMR spectrum consists of an orbital () and spin () contributions:
| (4) |
where marks the orientation of the applied field. Since the contribution to comes from the closed orbitals, the only temperature dependence of comes from the spin part . Just like before, from symmetry it follows that . By plotting the dependence (not shown), i.e. the Clogston – Jaccarino plot, and understanding that in the high-temperature paramagnetic limit and the value of , we can extract values. From the measured data, we can extract all the values of the NMR parameters, shown in Table 1.
| parameter | value: | |
|---|---|---|
| (‰) | ||
| (‰) | ||
| (‰) | ||
| (‰) | ||
| (kHz) | ||
| 0 |
These values are extremely small for a typical research of strongly correlated systems, and can only be properly measured with a stable measurement setup.
We also used the goniometer to determine the symmetry of the 63Cu site in the same compound. From the structural data it follows that the Cu site here occupies the Wyckoff site and that it has symmetry. However, on closer inspection, it can be seen that the local environment is a CuF6 octahedron, where the two apical fluorine sites (Fapic.) are considerably farther than the four planar F ions: length of the CuFapic. bond is 2.348 Å, while the length of the planar CuF bonds is 1.8997 Å. This determines that the electron on the copper site resides in the orbital. Since the distances between the four planar CuF bonds are all equal and only the angle of the nearest neighbor FCuF bonds varies, we can expect that the observed EFG symmetry of 63Cu will deviate from tetragonal bellow the sensitivity of the NMR measurement. This claim is also confirmed by a point-charge calculation of the EFG tensor that will be published elsewhere.
The size of the quadrupolar splitting of 63Cu in this compound is large enough to be observed in zero field and an NQR line was found at 52.684 MHz at 190 K. If we would like to determine the local symmetry of the 63Cu site in the same way as we did with 133Cs due to such large quadrupolar splitting it would require a very large magnetic field. It is therefore much more convenient to apply a small external magnetic field and rotate the sample with respect to . The small Zeeman perturbation will split the NQR line Abragam (1961); Kind (1986); Garcia and Lucken (1986) and from its angle dependence we can determine the local symmetry of the site.
First we show the dependence on the angle in Fig. 5, with the applied magnetic field mT and the axis of rotation again in the plane. The CuF4 plaquettes are tilted with respect to the kagome planes at an angle of 12.6°. They are located in the triangles of the kagome lattice and create an ”all-in”/”all-out” pattern. Therefore, when the magnetic field is oriented perpendicular to the kagome planes (°), we will observe one pair of lines, but as the angle changes we will observe two sets of signals - one where the initial mean tilting is 12.6° and one where the initial tilting is -12.6°. In reality there is a distribution of the tilting angles that is set by the orientation of the component of the magnetic field within the kagome plane. However, the fine details are obscured by the finite width of the NQR lines and only two sets of patterns are visible.
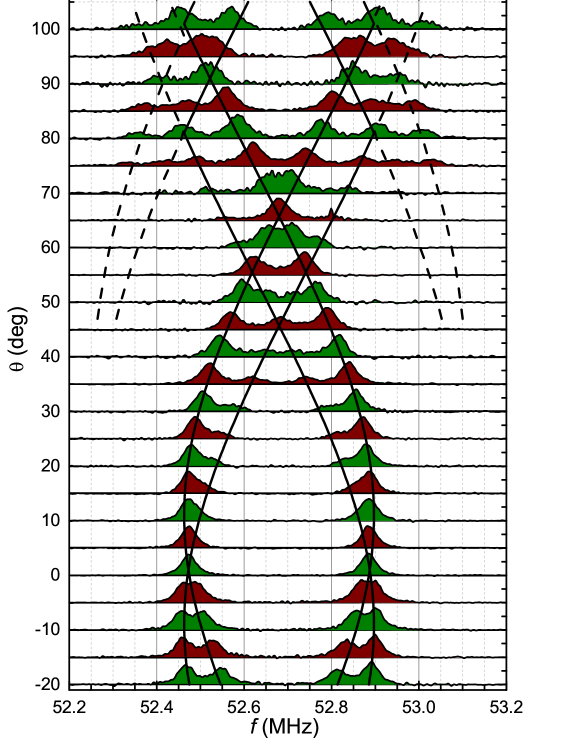
The measured angle dependence of the spectrum is compared to the analytical solution for an axial case shown in Fig. 5, and it is visible that the measurements can be well described by this function. The dependence reproduces the behaviour of the main NQR lines (full line) as well as the so-called forbidden transitions (dashed).
To additionally check the consistency of the data, we also measured the angle dependence of the NQR spectra for case when the small magnetic field is rotated within the kagome planes, i.e. the axis of rotation is along the crystal direction (left panel of Fig. 6). To have a better resolution of the produced pattern, we have applied a somewhat larger field of mT. From the crystal structure we expect three pairs of lines that have identical angle dependence, but shifted in phase for 120°. The overlapping of lines will create a pattern visible in the right panel of Fig. 6, which was generated by exact diagonalization of the NMR/NQR hamiltonian. In the figure the angle moves in the plane, but since the of each copper site is tilted away from the -axis, it does not match the angle for °, but rather it moves from (°,°) to (°,°), for °and °, respectively.
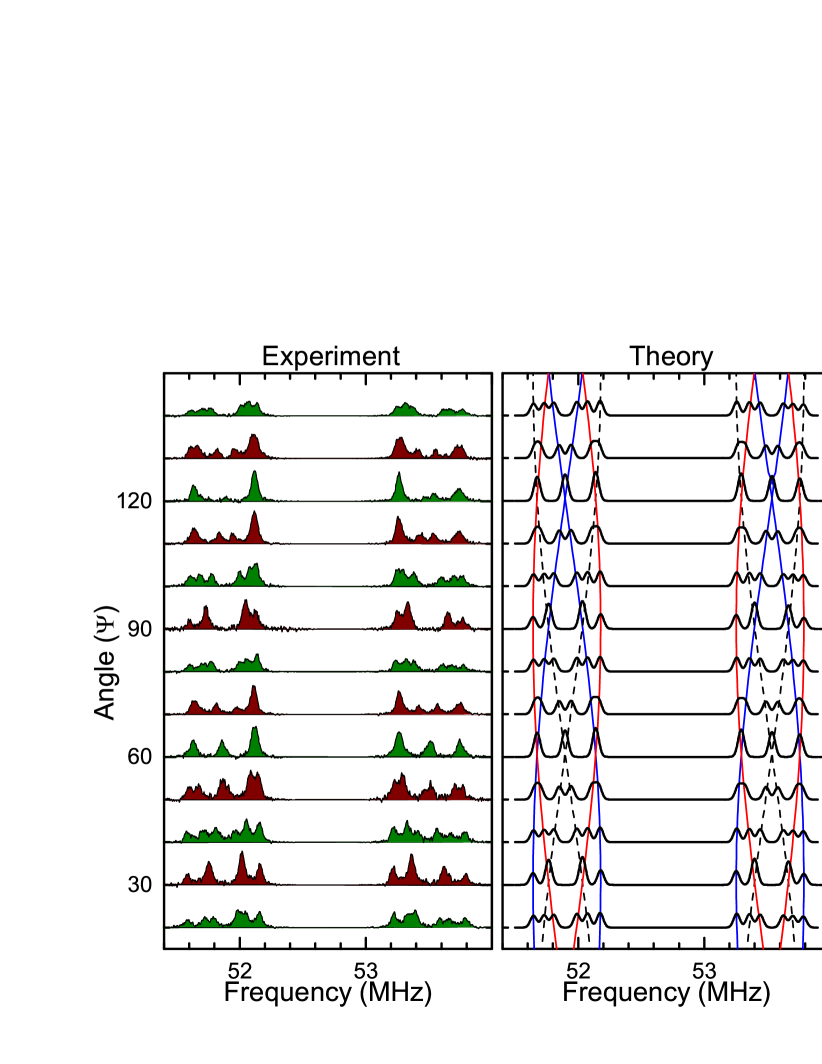
It is visible that the simulated spectra nicely reproduce the measured data. It properly reproduces the distribution of the spectral intensity (in particular the high-symmetry points visible at e.g. 60°) but not fully the intensity of specific lines. However, our simulation does not take into account the change of intensity due to the change of the coil orientation with respect to , or the variations of the optimal pulse across the spectrum, which can explain the small variations in intensity.
The fitting of simulated spectra gives mT, ° and , while is set by the pure NQR value in zero field. The fitted parameters are in excellent agreement with what is expected from the crystal structure. Therefore, this demonstrates that our two-axis rotator behaves as expected and shows no measurable deviations, even when tested by a sensitive local probe.
In conclusion, we have designed a two axis rotator where one of the axis of rotation is separated from the other which minimizes error during the measurements. The designed apparatus has been tested by a series of tests with NMR, a local probe that can detect even the smallest misalignments in-situ. The reported setup is suitable for other measurement techniques as well, not just NMR. There are no limitations on the number of wire connections, and only limitation is the sample space at the cradle of the goniometer which is sufficient.
IV Acknowledgements
Authors are grateful to Zlatko Kvočić, dipl. ing. meh. for his advice and input during the design process, and his time and patience in the manufacturing of small precise parts for the goniometer. Also, we would like to thank H. Tanaka for providing the single crystal of Cs2Cu3SnF12.
The authors acknowledge the support of the Croatian Science Foundation (HRZZ) under the project IP-2018-01-2970, and the Unity Through Knowledge Fund (UKF Grant No. 20/15).
References
- Poole (1997) C. P. Poole, Electron Spin Resonance: A Comprehensive Treatise on Experimental Techniques/Second Edition (Dover Publications; Subsequent edition, 1997).
- Hoult and Richards (1976) D. Hoult and R. Richards, Journal of Magnetic Resonance (1969) 24, 71 (1976).
- Vosegaard et al. (1996) T. Vosegaard, V. Langer, P. Daugaard, E. Hald, H. Bildso/e, and H. J. Jakobsen, Review of Scientific Instruments 67, 2130 (1996), https://doi.org/10.1063/1.1147026 .
- Shiroka et al. (2012) T. Shiroka, F. Casola, J. Mesot, W. Bachmann, and H.-R. Ott, Review of Scientific Instruments 83, 093901 (2012), https://doi.org/10.1063/1.4748861 .
- Herzog and Evetts (1994) R. Herzog and J. E. Evetts, Review of Scientific Instruments 65, 3574 (1994), https://doi.org/10.1063/1.1144539 .
- Suzuki et al. (1997) M. Suzuki, A. Sawada, A. Ishiguro, and K. Maruya, Cryogenics 37, 275 (1997).
- Ono et al. (2009) T. Ono, K. Morita, M. Yano, H. Tanaka, K. Fujii, H. Uekusa, Y. Narumi, and K. Kindo, Phys. Rev. B 79, 174407 (2009).
- Slichter (1990) C. P. Slichter, Principles of magnetic resonance, 3rd ed. (Springer-Verlag Berlin ; New York, 1990) Chap. 10.
- Abragam (1961) A. Abragam, The Principles of Nuclear Magnetism, International series of monographs on physics (Clarendon Press, 1961) Chap. VII.
- Kind (1986) T. Kind, Z. Naturforsch. 41a, 122 (1986).
- Garcia and Lucken (1986) M. L. S. Garcia and E. A. C. Lucken, Z. Naturforsch. 41a, 129 (1986).