Dependence of Spiral Arms Pitch Angle on Wavelength as a Test of Density Wave Theory
Abstract
Large-scale galactic shocks, predicted by density wave theory, trigger star formation (SF-arms) downstream from the potential of the oldest stars (P-arms), resulting in a color jump from red to blue across spiral arms in the direction of rotation, while aging of these newly formed young stars induces the opposite but coexisting classic age gradient further downstream from the SF-arms. As the techniques for measuring pitch angle are intensity-weighted, they trace both the SF-arms and P-arms and are not sensitive to the classic age gradient. Consequently, the measured pitch angle of spiral arms should be systematically smaller in bluer bandpasses compared to redder bandpasses. We test these predictions using a comprehensive sample of high-quality optical (BVRI) images of bright, nearby spiral galaxies acquired as part of the Carnegie-Irvine Galaxy Survey, supplemented by Spitzer 3.6 data to probe evolved stars and GALEX ultraviolet images to trace recent star formation. We apply one-dimensional and two-dimensional techniques to measure the pitch angle of spiral arms, paying close attention to adopt consistent procedures across the different bandpasses to minimize error and systematic bias. We find that the pitch angle of spiral arms decreases mildly but statistically significantly from the reddest to the bluest bandpass, demonstrating conclusively that young stars trace tighter spiral arms than old stars. Furthermore, the correlation between the pitch angle of blue and red bandpasses is non-linear, such that the absolute value of pitch angle offset increases with increasing pitch angle. Both effects can be naturally explained in the context of the density wave theory for spiral structure.
1 Introduction
Spiral structure is the most striking feature of disk galaxies, but its physical origin is still debated. The density wave theory proposed by Lin & Shu (1964), perhaps the most successful framework proposed for spiral structure, envisages a quasi-stationary wave pattern rotating around the galactic center at a constant angular speed. The spiral potential generated by the oldest stars induces large-scale galactic shocks on the gas, triggering gravitational collapse and then enhanced star formation (Roberts, 1969).
The enhanced star formation caused by density waves can lead to two opposite but coexisting color gradients across spiral arms. Firstly, gas clouds get shocked upstream from the minima of the spiral potential (P-arms) and take a finite timescale to form arms with enhanced star formation (SF-arms) downstream from the P-arms (Gittins & Clarke, 2004). As the spiral potential is generated by the oldest stars, a red-to-blue color gradient occurs in the direction of rotation for trailing spirals. The second color gradient—the classic age color gradient—comes from the aging of newly formed young stars of the SF-arms. Inside the corotation radius, the newly formed stars drift differentially out of their birth site and age meanwhile. This drift causes an age color gradient from blue to red in the direction of rotation. In summary, there is a spatial ordering of different tracers across spiral arms in the direction of rotation: the oldest population, the youngest stars, and a gradually aging population. Due to the requirement that arms vanish at corotation radius (CR), the azimuthal offsets among them decrease with increasing radius inside CR and increase thereafter (or beyond CR), implying that the pitch angle of these tracers follows: pitch angle of P-arms pitch angle of SF-arms pitch angle of aging red arms. This picture, though, is less clear-cut in reality. Smearing-out effects between the gas and stars, due to the continuous formation of stars behind the shock and the tendency for newly formed stars to fall to smaller galactocentric radii due to loss of angular momentum, reduce the asymmetry of the classic color gradient anticipated by theory (Yuan & Grosbol, 1981). Furthermore, the stronger shocks at smaller radii increase the inward streaming motions there, such that the azimuthal offsets narrow, and mimic a reduction in the pattern speed relative to that measured at larger radii (Martínez-García et al., 2009b). Evidence for the classic age color gradient has been found by Gonzalez & Graham (1996), Martínez-García et al. (2009a), and Martínez-García & González-Lópezlira (2011) by using a photometric index, (r J g i), that effectively traces the gradient from young to relative old stars, while contradictory results have also been reported (Schweizer, 1976; Talbot et al., 1979; Foyle et al., 2011). One-dimensional (1D) or two-dimensional (2D) Fourier transformation are widely adopted techniques to measure pitch angle of spiral arms. Because these two techniques implicitly use the intensity as weighting when calculating the Fourier components, they will trace the centroid of spiral arms near their peak, thereby measuring the pitch angle of P-arms in red-band and SF-arms in blue-band images. Therefore, in observational terms, spiral arms should have smaller pitch angles in the blue than in the red if they are density wave modes. A number of studies indeed have found evidence of spiral arms being tighter in bluer than in redder bands (Grosbol & Patsis, 1998; Martínez-García, 2012; Martínez-García & González-Lópezlira, 2013; Martínez-García et al., 2014). Martínez-García & González-Lópezlira (2013), in particular, reported a median difference in pitch angle of approximately between the g and J band for a sample of 11 objects. By contrast, neither Seigar et al. (2006) nor Davis et al. (2012) found discernible variation in pitch angle with waveband. Pour-Imani et al. (2016), extending the range of wavelengths to the far-ultraviolet (FUV), even came to the opposite conclusion: spirals are looser in the ultraviolet and grow tighter toward the red. A major source of difficulty with these analyses is that the pitch angle variations are expected to be small, and hence measurement uncertainties and systematic effects become very important, both within each band and across different bands. If we wish to compare pitch angles from different images, great care must be taken, when performing the measurements, to choose strictly consistent galaxy parameters, such as galaxy center, ellipticity, position angle, and radius range.
No color dependence in arm tightness is expected for the transient but recurrent spiral structures presented in -body simulations (e.g., Sellwood, 2011; Baba et al., 2013; D’Onghia et al., 2013) obeying swing amplification theory (Toomre, 1981). Thus, measuring the pitch angle as a function of wavelength provides a simple test for theories of spiral structure.
Yu et al. (2018) recently measured robust pitch angles for a large sample of spiral galaxies drawn from the Carnegie-Irvine Galaxy Survey (CGS; Ho et al., 2011), using two independent methods based on 1D and 2D Fourier decomposition of optical (BVRI) images. Here, we extend the analysis of a subset of this sample to an even wider wavelength baseline, by making use of 3.6 m IRAC images from the Spitzer Survey of Stellar Structure in Galaxies (S4G; Sheth et al., 2010), which are an ideal extinction-free tracer of the stellar mass distribution in galaxies (Meidt et al., 2014). At the opposite extreme, we further include FUV and near-ultraviolet (NUV) images from the Galaxy Evolution Explorer (GALEX; Martin et al., 2005) to sample the most recently formed stars. Together with the CGS data, our analysis covers a total of seven bandpasses from Å to 3.6 m, offering the most comprehensive view to date of the wavelength dependence of spiral arm pitch angle.
2 Data
The CGS is a statistically complete optical (BVRI) imaging survey of 605 bright ( mag), nearby (median Mpc), southern () galaxies. The overall quality of the images is quite high, having a median seeing of and a limiting surface brightness of 25.3 mag arcsec-2 in the I band. Yu et al. (2018) successfully and systematically measured the pitch angles of spiral arms for 172 CGS galaxies in BVRI, using both 1D and 2D Fourier decomposition. We crossmatch the spiral galaxies with pitch angle measurement in Yu et al. (2018) with S4G and GALEX. We excluded galaxies with spiral arms in I-band images that are too flocculent or irregular to measure reliable pitch angle (Yu et al., 2018). The 3.6 images reach a limiting surface brightness of mag arcsec-2 and thus are quite deep, but the quality of the NUV/FUV images is spotty. Images from the GALEX All-Sky Imaging Survey (AIS) are rather shallow, and we exclude them if the spiral arms are indistinguishable. We finally have 82 images, 80 NUV images [44, 6, 10, and 20 of them are from GALEX AIS, Medium Imaging Survey (MIS), Nearby Galaxy Survey (NGS), and Guest Investigator Data (GI), respectively] and 71 FUV images (38, 6, 10, and 17 of them from GALEX AIS, MIS, NGS, and GI, respectively).
An accurate determination of the sky projection parameters— ellipticity () and position angle (PA)—for the galaxies is essential for the study of spiral arms. Yu et al. (2018) carefully scrutinize the projection parameters from different sources to choose the optimal values. For the current, demanding application in hand, the problem is even more acute because we need to compare potentially small differences in pitch angle across multiband images with inhomogeneous resolution and signal-to-noise ratio. It is also particularly challenging that within any given galaxy the pitch angle variations with radius can exceed 20% (Savchenko & Reshetnikov, 2013). Thus, it is crucial to keep fixed the , PA, and centroid of the galaxy, as well as the radial range occupied by spiral arms, when calculating the pitch angle for images in different wavebands. This procedure was followed strictly for the BVRI CGS images (Yu et al., 2018), and here we extend it to the IRAC and GALEX images, adopting, as reference, the projection parameters from the CGS -band image (Table 1). The absolute astrometry for the IRAC and GALEX images is determined according to the world coordinate system of the galactic center of the -band images (Li et al., 2011).111The world coordinate system for a few CGS images is either unavailable or has a slight orientation offset. For these particular data, we aligned the IRAC/GALEX images with the CGS images by visual inspection.
Prior to performing Fourier decomposition to measure the pitch angle, the images need to be background-subtracted, and bright foreground stars must be removed. These procedures have already been performed for the CGS images (Ho et al., 2011; Li et al., 2011), and we apply them in the same manner to the IRAC and GALEX images.
3 Pitch Angle Measurements
The most widely used techniques to measure arm pitch angle employ discrete Fourier transformation, either in 1D (1DDFT) (Grosbøl et al., 2004; Kendall et al., 2011) or in 2D (2DDFT) (Kalnajs, 1975; Iye et al., 1982; Krakow et al., 1982; Puerari & Dottori, 1992; Puerari, 1993; Block & Puerari, 1999; Seigar et al., 2005; Davis et al., 2012). Both techniques are used and discussed in detail by Yu et al. (2018) in the context of the CGS images. Here we just briefly summarize a few essential points.
The 1DDFT method fits a Fourier series to the 1D azimuthal isophotal light profile to identify the centroids of the spiral arms using the phase angle of the dominant Fourier mode . When computing the azimuthal isophotal light profile (using the IRAF task ellipse), in addition to keeping , PA, and galaxy center fixed to the reference values from the I-band image, it is also essential to adopt the same physical linear step size for the isophotes. If the spiral arms are correctly identified by the phase angle of the Fourier mode, the phase angle profile as a function of radius will show almost monotonic change, whose gradient reflects the pitch angle of spiral arms. Fitting a logarithmic function to the phase angle as a function of radius, ,
| (1) |
where is the radial distance from the center and is a coefficient. The pitch angle follows, , from
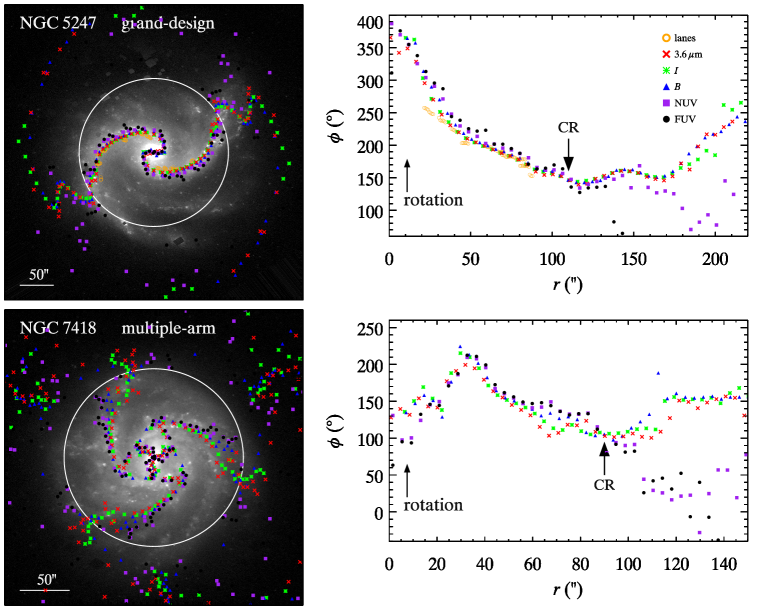
with its error determined through propagation of the fitting error of . This procedure, of course, cannot be applied to totally flocculent, irregular or non-symmetric spiral patterns, which lack a smooth phase angle profile. Even for objects that do possess a well-behaved phase angle profile, the radial range over which it changes smoothly and monotonically will not be identical in every band because of variations in the noise properties of the images. This is illustrated in Figure 1 for the grand-design spiral NGC 5247 and the multiple-arm spiral NGC 7418, showing the phase angle profiles of the dominant Fourier mode calculated for images in , I, B, NUV, and FUV (R and V bands are omitted for clarity). Note that we adopt the convention that the azimuthal angle increases with rotation. NGC 7418 has three inner arms associated with the central bar, with one of them disappearing in the outer part. Because its 1D Fourier components show highest amplitude in = 3 while 2D Fourier components show highest amplitude in = 2, a different Fourier mode is used in the 1DDFT () and 2DDFT (; Figure 2) methods to calculate pitch angle; both give consistent results. Some multiple-armed galaxies ( 10% in our sample), which have more complicated spiral structures than grand-design galaxies, may exhibit a different dominant mode in 1D and 2D Fourier analysis. In other words, this kind of galaxies has no “true” dominant mode. The right panels show that the centroids of the spiral arms drift downstream gradually and systematically from to the FUV (this will be discussed in further in the next section). The GALEX AIS FUV and NUV images have particularly poor S/N. To minimize potential uncertainty from variation of pitch angle with radius, we restrict the analysis in each band to the same radial range over which all the phase angle profiles change almost monotonically. This radial range may only occupy part of the full spiral region, so that the pitch angle measured by us is not necessarily consistent with the intrinsic pitch angle of spiral arms for those galaxies whose pitch angle varies significantly with radius. Using the 1D method, we find for NGC 5247 pitch angles of , , , , and in , I, B, NUV, and FUV, respectively; for NGC 7418, we measure , , , , and in , I, B, NUV, and FUV, respectively. Using the 1D method, we successfully measure pitch angles for 71 3.6 , 60 NUV, and 50 FUV images of 96 galaxies (Table 1). Typical uncertainties in the measurements are .
The 2DDFT method decomposes the background-subtracted, star-cleaned, and deprojected image, transformed into polar coordinates, into a superposition of 2D Fourier components with coefficients 222 where = , is intensity of the th pixel at , , is the azimuthal frequency, and is the logarithmic radial frequency. calculated over the four radial ranges determined by Yu et al. (2018) in the I band: [, ], [+0.2, ], [, -0.2], and [+0.1, -0.1], where = , and and are the inner and outer boundaries of the spiral arms (Table 1), which are set the same for all seven bandpass images. The peak of the power spectrum of the dominant Fourier mode , which is set the same for images in all seven bands, is identified to calculate the arm pitch angle:
| (3) |
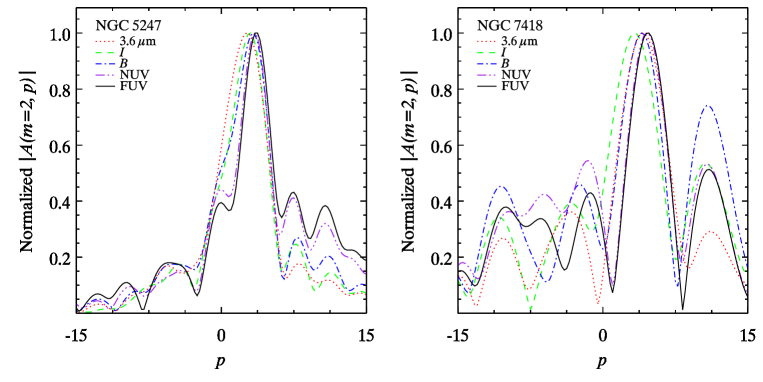
The pitch angle of the galaxy is taken as the mean value of the pitch angle in the four radial bins; its uncertainty, typically , is their standard deviation. The Fourier spectra, = , for NGC 5247 and NGC 7418 are illustrated in the left and right panels of Figure 2, respectively. The corresponding to the most prominent peak gradually shifts toward the right with wavelength, indicating smaller pitch angles. For NGC 7418, although the peak at 3 m is not in the canonical order, there is an important shift toward larger values of , especially between the I and FUV bands. The 2D method yields for NGC 5247 pitch angle , , , , and in , I, B, NUV, and FUV, respectively; the corresponding values for NGC 7418 are , , , , and . Using the 2D method, we successfully measure pitch angles for 69 3.6 , 70 NUV, and 60 FUV images of 99 galaxies (Table 1).
4 Results
4.1 Color gradient across spiral arms
Young stars triggered by the spiral shock will form an SF-arm, which is downstream from the P-arm comprised of evolved stars, resulting in a color jump from red to blue in the direction of rotation inside corotation radius (Gittins & Clarke, 2004). The classic age gradient, from blue to red, occurs as these newly formed young stars drift differentially out of the SF-arm and age meanwhile. Both kinds of color gradients are caused by density waves and can coexist. However, the techniques we have applied (1D and 2D Fourier transforms) implicitly use the intensity as weighting when calculating Fourier components. Thus, these methods tend to identify the centroid of spiral arms close to their brightness peak and are not sensitive to the age color gradient, which occurs in a wider azimuthal scale as the surface brightness is gradually diminishing. As shown in Figure 1, we witness the centroid of spiral arms gradually drifting downstream in waveband from to FUV, resulting in a continuous color gradient from red to blue in the direction of rotation inside the corotation radius. This is consistent with the prediction by Gittins & Clarke (2004), although the observed gradient is not obviously discontinuous. Such a color gradient has also been detected by Martínez-García & González-Lópezlira (2013) using the phase angle (not azimuthal position) of the dominant mode from 2D Fourier transformation, even though the authors have treated it mistakenly as a result of an age gradient. The detected continuity of the color gradient is probably a consequence of dust extinction. The spiral shock is located upstream from the SF-arms and can be traced by the dust lanes (Gittins & Clarke, 2004). The light from young stellar complexes on the side closer to the shock is delimited by extinction (some of the young stellar complexes are actually still visible at 3.6 ). Therefore, if the dust lanes are tapering downstream from the shock inside corotation radius, at progressively shorter wavelengths, arms will be increasingly located further from the shock, since they will be visible only once the optical depth falls below 1. The stars and gas are still moving relative to the spiral pattern as expected from density wave theory, so the width of the arm has to vanish at corotation and the pitch angle has to be smaller for the bands detected further away from the shock.
We identify the dust lanes, which are marked by orange symbols in Figure 1, from visual inspection of the B-band image of NGC 5247, while there is no regular dust lane for NGC 7418. The dust lanes are not as regular and continuous as the shock fronts generated in numerical simulations employing a rigidly rotating spiral potential (e.g., Gittins & Clarke, 2004; Kim & Kim, 2014), and they only occupy part of the full spiral region. Despite these caveats, some weak evidence of dust lanes being upstream from the spiral arms is found. The Fourier spectra presented in Figure 2 also shed light on this picture. For NGC 5247, the = peak profiles get narrower with decreasing wavelength. For NGC 7418, whose dust lanes are inconspicuous, the = peaks are equally wide and quite symmetric at all wavelengths. We highlight that, with or without dust extinction, the detected color gradient as well as the trend that spiral arms are more tightly wound in progressively shorter wavelengths (see Section 4.2) are consistent with spiral density waves. Outside of the corotation radius, the stars and gas clouds move slower than the spiral pattern, leading to a reversed color gradient. Based on this behavior, the coratation radius can be estimated as the radius at which the color gradient reverses; it is marked with the white circle in the left panels and with the label CR in the right panels of Figure 1.
4.2 Wavelength dependence of pitch angle
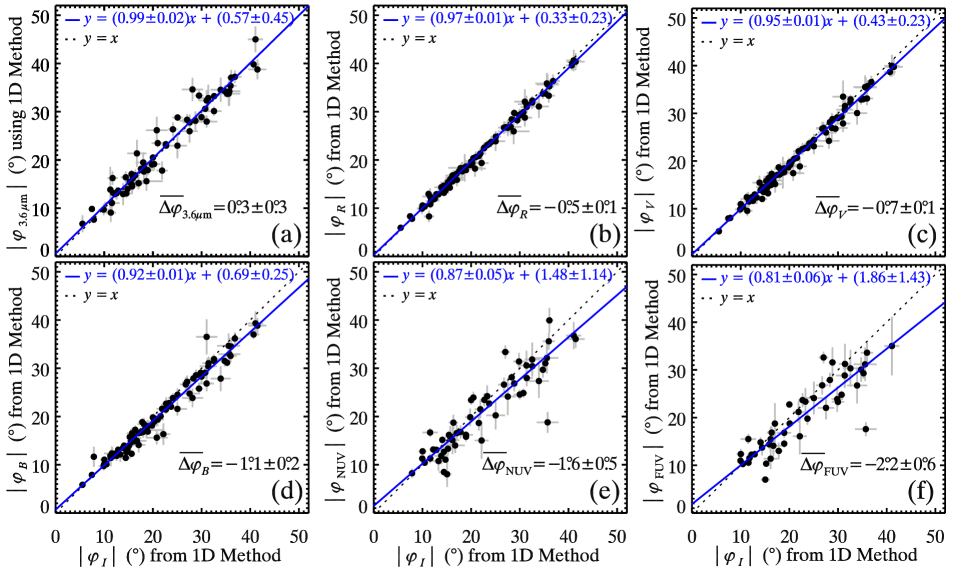
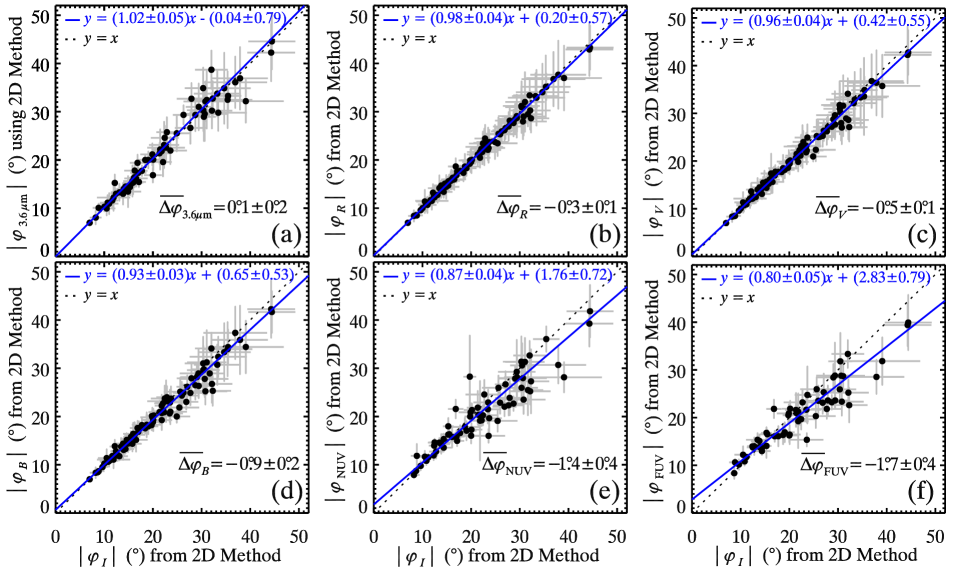
Figure 3 shows the pitch angles of spiral arms measured using the 1D method in the band, compared with pitch angles derived in the 3.6 , R, V, B, NUV, and FUV bands. The corresponding results obtained from the 2D method, which are entirely consistent with those from the 1D method, are shown in Figure 4. In each panel the dashed line represents the 1:1 relation, and the best-fit straight line, whose functional form is given at the top, is marked by the blue solid line. We calculate the mean difference of pitch angle between waveband and the I band, , where can be 3.6 , R, V, B, FUV, or NUV, denotes the th galaxy, and is the total number of galaxies. The error of the mean is calculated by .
Both the 3.6 and -band images give essentially identical pitch angles for the spiral arms, for both the 1D (Figure 3a) and 2D (Figure 4a) methods. The best-fit straight line for these two wavelengths has a slope of () and an intercept of (); the mean difference is (). The excellent consistency between these two long-wavelength bandpasses confirms that the band traces the mass distribution of evolved stars just as effectively as the 3.6 band. This is a crucial step, for it allows us to use the CGS -band images as the reference red bandpass with which to compare the other five bluer bandpasses. The -band images have the advantage of having much higher signal-to-noise ratio and angular resolution than the 3.6 IRAC images. I-band images closely match the conditions of the BVR images, and there are also many more objects that overlap with the GALEX database. We detect a strong correlation between the -band pitch angle and the pitch angle measured in each of the bluer bands, with a slope for the best-fit straight line that decreases consistently and systematically, from () in the band to () in the FUV band (Figures 3 and 4). The correlations are tightest for the optical bands because of the uniformly high quality of the CGS data, while the relatively low signal-to-noise ratio and coarse pixel scale of the FUV/NUV images from GALEX/AIS introduce greater scatter but negligible systematic bias (see Section 4 of Yu et al. 2018). Meanwhile, the mean difference in pitch angle with respect to the band decreases (the absolute value of difference increases) systematically and significantly (at greater than the 3 level) from () in the R band to () in the FUV band. This clear statistical trend implies that spiral arms in bluer bandpasses are, on average, tighter than in redder bandpasses.
The absolute value of the pitch angle difference is very small. We can discern it only when the inter-band correlations have a sufficiently small total scatter, which we achieved through adopting a consistent approach to measuring pitch angles across different bands (Section 3). This may explain why Davis et al. (2012) failed to detect a discernible difference in pitch angles between the I and B bands, even though they also analyzed CGS data. Our results agree with those of Grosbol & Patsis (1998), Martínez-García (2012), Martínez-García & González-Lópezlira (2013), and Martínez-García et al. (2014), but we place them on a firmer statistical footing using a much larger and more comprehensive sample. By contrast, Pour-Imani et al. (2016) reported an entirely opposite result: in their analysis of spiral arms of 28 galaxies, they found that the pitch angles are actually larger in the FUV band than at . Moreover, the mean difference in pitch angle they measured is huge: (recalculated from data in their table). Their pitch angle measurements, unfortunately, are not reliable. As an example, for the well-studied grand-design spiral galaxy NGC 1566, which overlaps with our sample, Pour-Imani et al. (2016) quote a pitch angle for 3.6 , for , and for FUV. However, simple inspection of the images of NGC 1566 clearly reveal that its two symmetric arms are quite similar in , B, and FUV. The huge difference of pitch angle reported by Pour-Imani et al. (2016) for this galaxy cannot possibly be correct. Inspection of other galaxies in their sample (e.g., NGC 1097) reveals similar problems. As mentioned earlier, it is crucially important to adopt consistent parameters when measuring pitch angles across different images, especially those having vastly different angular resolution and signal-to-noise ratio. We suspect that these factors may have adversely affected the measurements of Pour-Imani et al. (2016).
Our finding that the pitch angle of spiral arms decreases toward shorter wavelengths implies that young stars follow tighter arms than those delineating the old stellar population. This behavior arises naturally as a consequence of star formation triggered by the large-scale galactic shocks of trailing spirals and the fact that our techniques are intensity-weighted. The oldest stars, as traced in the or band, form a long-lived spiral pattern with a unique pattern speed and generate the spiral gravitational potential (P-arm). The gravitational potential perturbs the gas orbits, produces spiral shocks in the gas flow, and triggers gravitational collapse of the gas to form new stars to enhance star formation (SF-arm) downstream from the P-arm for trailing spirals inside corotation radius (Gittins & Clarke, 2004). These newly formed stars drift out of the arm and age meanwhile. After aging , the stars will move further downstream from the SF-arm. For trailing spirals, within the corotation radius and in the direction of rotation, there should a spatial ordering across the spiral arm: spiral shock, the oldest stars, young stars, and aging stars. However, because the techniques we employ (1D and 2D Fourier transformation) implicitly use the intensity as weighting when calculating Fourier components, they tend to identify the centroid of spiral arms close to its peak to measure the pitch angle of the SF-arms and P-arms, and are thus not sensitive to the age color gradient. We therefore detect a color gradient from red to blue (Figure 1) and tighter arms in bluer bands (Figures 3 and 4). Dust extinction causes the color gradient and the variation of pitch angle with bandpass to appear continuous, instead of discontinuous as predicted by Gittins & Clarke (2004).
Several factors complicate this simple picture. Recent works using a generalization of the Tremaine-Weinberg method (Tremaine & Weinberg, 1984) to calculate the pattern speed propose that the spiral pattern speed may increase with decreasing radius in some objects (Merrifield et al., 2006; Meidt et al., 2009; Speights & Westpfahl, 2012). This would reduce the expected offsets between the tracers of the different stellar populations and imply that, actually, there is no pattern speed. However, an increase in the measured pattern speed with decreasing radius might be caused by the larger inward streaming motions of young stars at smaller radius rather than by a real radial variation of (Martínez-García et al., 2009b). The position of the spiral shock may depend on the pattern speed, strength of the spiral potential, and the detailed properties of the gas clouds (Gittins & Clarke, 2004; Kim & Kim, 2014). Finally, galaxies possess a variety of rotation curves, from slow-rising shapes for late-type galaxies to steeply rising and then flat shapes for early-type ones (e.g., Kalinova et al., 2017). Thus, for any realistic sample of galaxies, such as that considered in this study, all of these factors will introduce scatter to the predicted simple variation of spiral pitch angle with stellar population. Yet, remarkably, we still seem to be able to extract a clear signal consistent with the predictions. It is possible that in this case, among all the effects diluting the signal, extinction is actually helping it.
Although our results indicate that spiral arm structure in our sample is long-lived as predicted by density wave theory, it is still possible that some galaxies are dominated by transient but recurrent spiral structure obeying swing amplification theory (Toomre, 1981). This scenario, which does not anticipate color gradients across spiral arms, may account for the objects located closest to the 1:1 line in Figures 3 and 4.


The correlation between -band pitch angle and FUV-band pitch angle (Figures 3f and 4f) has a best-fit slope of , which implies that the absolute value of the difference of pitch angle between young and old stars increases progressively with increasing pitch angle. Moreover, the intercept is greater than zero. Both of these characteristics need explanation.
4.3 Models
We construct a simplified model to explain these observations. The pitch angle of spiral arms on average increases with later Hubble type, but with a large variation in pitch angle for any given Hubble type (Kennicutt, 1981; Ma, 2002; Yu et al., 2018). As pitch angle shows no conclusively clear, strong correlation with global galaxy properties (Kennicutt, 1981; Seigar et al., 2005; Kendall et al., 2015; Yu et al., 2018), we construct a simplified model by choosing a typical value of pattern speed, rotation curve, and star formation timescale. The compressed gas is traditionally believed to be located upstream from the potential inside corotation radius, but simulations show that its location relative to the potential is complex and may depend on the sound speed of the gas, the strength of the spirals, or the pattern speed. The compressed gas can be downstream from the potential if it is cold or multiphase (Gittins & Clarke, 2004; Wada, 2008), or if the strength of the spirals is weak (Kim & Kim, 2014). As we do not find a significant offset in azimuthal angle between the dust lanes and the centroid of the arms at (e.g., Figure 1), we assume that the location of the spiral shock is very near to the minimum of the spiral potential.
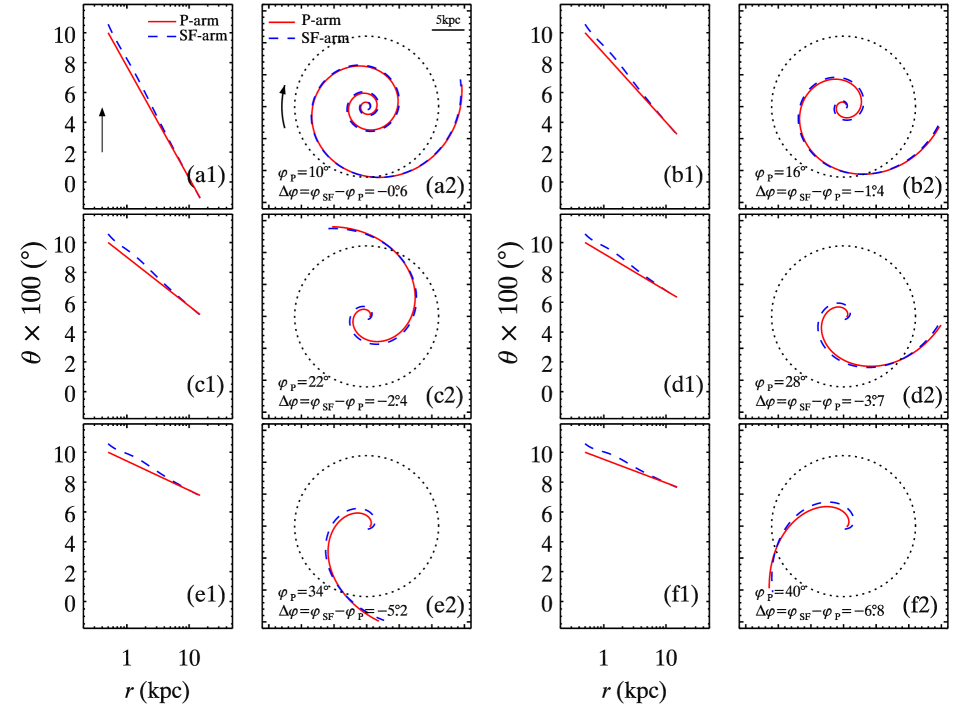
Our model adopts a spiral potential (P-arm), comprised of the oldest stars, with pattern speed km s-1 kpc-1. This value is consistent with that found by Martos et al. (2004) for their optimal dynamically self-consistent model of the Milky Way, and it lies within the range of pattern speeds of spiral arms (10 to 45 km s-1 kpc-1) measured by using the Tremaine-Weinberg method (e.g., Zimmer et al., 2004; Fathi et al., 2009) or by analyzing age color gradients (Martínez-García & González-Lópezlira, 2011). The stars and gas in the disk are assumed to rotate following the circular velocity profile shown in Figure 5 (left), which is constructed using the eigenstates derived from the principle component analysis of the rotation curves in the CALIFA galaxy sample (Kalinova et al., 2017). The circular velocity profile, like that of the Milky Way (e.g., Bovy et al., 2012), rises rapidly to km s-1 by 3 kpc and then flattens to 220 km s-1 beyond 10 kpc. The angular velocity profile is shown in the middle panel of Figure 5. As young, massive stars form on a short timescale of 10 Myr, we assume that this is roughly also the timescale () for gas clouds to get shocked, form massive stars, and appear as star-forming arms (SF-arm) observed in the FUV images. We will compare results from the model with our results for , the pitch angle offset between the I-band and FUV images. Although the resolution of the FUV images is coarser, the spiral arms are still well-resolved because these galaxies are very nearby. As illustrated in Figure 5 (right), the SF-arm is downstream from the P-arm inside the corotation radius and has an azimuthal angle offset relative to the P-arm . Large negative angular offsets are expected in the inner regions, and the offsets become positive beyond the corotation radius.
To mimic the properties of our sample, whose spiral pitch angles range from to , we homogeneously sample the pitch angle the of P-arm at six equally spaced intervals of 10, 16, 22, 28, 34, and 40 (Figure 6). The P-arm is assumed to be logarithmic in shape, following the equation:
| (4) |
where (, ) are the polar coordinates of the minima of the spiral potential, is a quantity determining the phase angle of the arm, and is a parameter defining pitch angle, . Considering only circular motion, and . As the resulting SF-arm, traced by the blue dashed curve in Figure 6, slightly deviates from logarithmic shape, a function with the mathematical form of Eq. (4) is fitted to the SF-arm to obtain the arm pitch angle, and then the offset in pitch angle between the SF-arm and P-arm is calculated as . This is presented in each of the panels of Figure 6. Consistent with our observations, the SF-arm has smaller pitch angle—and hence is tighter—than the P-arm.
We further fit a straight line to the six data points in the left panel of Figure 7 to find the best-fit function, marked by the solid line. The predicted relation between and from the model, shown as the dashed line, is a non-linear function, but it agrees extremely well with the fit between I-band and FUV pitch angle. The slope (0.79) and intercept (1.91) of the best-fit theoretical relation are entirely consistent with our observations: slope and intercept for the 1D method (Figure 3f), slope and intercept from the 2D method (Figure 4f). The positive intercept of the best-fit lines (Figures 3, 4, and 7) is an artifact caused by fitting a straight line to the data; it is unphysical because it would prevent the arm from vanishing at corotation. As our sample has a deficit of pitch angles less than 10, this behavior needs to be verified with further observations. The slopes 1, on the other hand, reflect the fact that the absolute value of increases with ( becomes more negative). This correlation is shown in the right panel of Figure 7. In our model, the physics is the same for arms with different . Thus, the angular offsets between the P and SF arms, which depend on the rotation curve, pattern speed, and star formation timescale (i.e., on the physics), are the same for arms with different . The tendency of the absolute value of to increase with is therefore a geometric effect. With increasing , for a fixed CR radius, the arms are shorter (Figure 6). Since the width of the arm must vanish at CR, the more open the P-arm is, the larger the reduction of must be for this to happen in the available length.
5 Summary and Conclusions
In the context of density wave theory, star formation triggered by long-lived spiral arms generates a star-forming arm (SF-arm) downstream from the potential arm (P-arm) of the oldest stars, and thus induce a color jump from red to blue in the direction of rotation inside corotation radius (Gittins & Clarke, 2004). The burst of star formation enhanced by the spiral shock will age and drift further downstream to form an opposite but coexisting color gradient (classic age gradient), from blue to red. As both 1D and 2D Fourier transformation implicitly use intensity as the weighting when calculating Fourier components, these techniques identify the centroid of spiral arms, and the resulting pitch angle measurements gauge the tightness of the SF-arm in blue bandpasses and of the P-arm in red bandpasses. In other words, Fourier techniques will readily identify the Gittins & Clarke jump, where bluer SF-arms are tighter, and be quite insensitive to the classic age gradient, which occurs on a much wider azimuthal scale, as the surface brightness continuously diminishes. Evidence for the classic age color gradient has been found by Gonzalez & Graham (1996), Martínez-García et al. (2009a), and Martínez-García & González-Lópezlira (2011), while contradictory results have also been reported (Schweizer, 1976; Talbot et al., 1979; Foyle et al., 2011). Pour-Imani et al. (2016) looked for and claimed to have found the pitch angle trend expected from aging arms (i.e., smaller pitch angle at redder wavelengths), but it is surprising they were successful while also using Fourier techniques. Many attempts have also been made to detect the dependence of arm pitch angle on wavelength in the context of color gradient of Gittins & Clarke (2004): Grosbol & Patsis (1998) saw it, and explained it as caused by relative displacements of dust and young stars; Foyle et al. (2011) failed to detect the azimuthal offset between P-arms and SF-arms based on a cross-correlation function analysis; Martínez-García (2012) and Martínez-García & González-Lópezlira (2013) detected it but attributed their result wrongly to aging; Martínez-García et al. (2014) reported a positive result for three out of five objects.
We perform a comprehensive analysis of this problem using the largest sample to date of bright, nearby spiral galaxies from the Carnegie-Irvine Galaxy Survey (CGS), having high-quality optical (BVRI) images, combined with 3.6 Spitzer images that trace the underlying stellar mass distribution, and NUV/FUV GALEX images that probe sites of recent star formation. We measure pitch angles using both 1D and 2D Fourier techniques developed and tested by Yu et al. (2018). As the expected signal is subtle, great care was taken to ensure that the measurements were made consistently across the images from different bands and instruments.
By using the centroid of spiral arms identified by Fourier transformation, we show that the color across spiral arms of both grand-design and multiple-arm galaxies changes from red to blue in the direction of rotation inside the corotation radius. We demonstrate that there is almost no difference between the pitch angle of spiral arms as measured in the band or in the band, both of which effectively trace the evolved stellar population in our sample. This important demonstration allows us to use the much larger sample of higher signal-to-noise ratio, higher resolution CGS -band images as the reference with which all other bluer bandpasses can be compared. We find that spiral arms are on average tighter (pitch angle smaller) in the bluer bandpasses than in I-band, at greater than 3 significance, and the absolute value of difference increases systematically with increasing wavelength separation. Referenced to the band, the mean difference in pitch angle, as measured from the 1D Fourier method, is in , in , in , in NUV, and in FUV. The 2D method gives consistent results, with corresponding values of , , , , and . That and the tendency for to become more negative with increasing are both consequences of the fact the azimuthal angle offset between the spiral potential and the newly formed stars, triggered by the spiral shock, decreases with radius and vanishes at the corotation radius. Our results support the density wave theory for the origin of symmetric spiral arms.
![[Uncaptioned image]](/html/1810.08979/assets/x8.png)
![[Uncaptioned image]](/html/1810.08979/assets/x9.png)
![[Uncaptioned image]](/html/1810.08979/assets/x10.png)
![[Uncaptioned image]](/html/1810.08979/assets/x11.png)
References
- Baba et al. (2013) Baba, J., Saitoh, T. R., & Wada, K. 2013, ApJ, 763, 46
- Block & Puerari (1999) Block, D. L., & Puerari, I. 1999, A&A, 342, 627
- Bovy et al. (2012) Bovy, J., Allende Prieto, C., Beers, T. C., et al. 2012, ApJ, 759, 131
- Davis et al. (2012) Davis, B. L., Berrier, J. C., Shields, D. W., et al. 2012, ApJS, 199, 33
- D’Onghia et al. (2013) D’Onghia, E., Vogelsberger, M., & Hernquist, L. 2013, ApJ, 766, 34
- Egusa et al. (2017) Egusa, F., Mentuch Cooper, E., Koda, J., & Baba, J. 2017, MNRAS, 465, 460
- Fathi et al. (2009) Fathi, K., Beckman, J. E., Piñol-Ferrer, N., et al. 2009, ApJ, 704, 1657
- Foyle et al. (2011) Foyle, K., Rix, H.-W., Dobbs, C. L., Leroy, A. K., & Walter, F. 2011, ApJ, 735, 101
- Gittins & Clarke (2004) Gittins, D. M., & Clarke, C. J. 2004, MNRAS, 349, 909
- Gonzalez & Graham (1996) Gonzalez, R. A., & Graham, J. R. 1996, ApJ, 460, 651
- Grosbol & Patsis (1998) Grosbol, P. J., & Patsis, P. A. 1998, A&A, 336, 840
- Grosbøl et al. (2004) Grosbøl, P., Patsis, P. A., & Pompei, E. 2004, A&A, 423, 849
- Ho et al. (2011) Ho, L. C., Li, Z.-Y., Barth, A. J., Seigar, M. S., & Peng, C. Y. 2011, ApJS, 197, 21
- Iye et al. (1982) Iye, M., Okamura, S., Hamabe, M., & Watanabe, M. 1982, ApJ, 256, 103
- Kalinova et al. (2017) Kalinova, V., Colombo, D., Rosolowsky, E., et al. 2017, MNRAS, 469, 2539
- Kalnajs (1975) Kalnajs, A. J. 1975, La Dynamique des galaxies spirales, 241, 103
- Kendall et al. (2015) Kendall, S., Clarke, C., & Kennicutt, R. C. 2015, MNRAS, 446, 4155
- Kendall et al. (2011) Kendall, S., Kennicutt, R. C., & Clarke, C. 2011, MNRAS, 414, 538
- Kennicutt (1981) Kennicutt, R. C., Jr. 1981, AJ, 86, 1847
- Kim & Kim (2014) Kim, Y., & Kim, W.-T. 2014, MNRAS, 440, 208
- Krakow et al. (1982) Krakow, W., Huntley, J. M., & Seiden, P. E. 1982, AJ, 87, 203
- Li et al. (2011) Li, Z.-Y., Ho, L. C., Barth, A. J., & Peng, C. Y. 2011, ApJS, 197, 22
- Lin & Shu (1964) Lin, C. C., & Shu, F. H. 1964, ApJ, 140, 646
- Ma (2002) Ma, J. 2002, A&A, 388, 389
- Martin et al. (2005) Martin, D. C., Fanson, J., Schiminovich, D., et al. 2005, ApJ, 619, L1
- Martínez-García (2012) Martínez-García, E. E. 2012, ApJ, 744, 92
- Martínez-García & González-Lópezlira (2011) Martínez-García, E. E., & González-Lópezlira, R. A. 2011, ApJ, 734, 122
- Martínez-García & González-Lópezlira (2013) Martínez-García, E. E., & González-Lópezlira, R. A. 2013, ApJ, 765, 105
- Martínez-García et al. (2009a) Martínez-García, E. E., González-Lópezlira, R. A., & Bruzual A., G. 2009, ApJ, 694, 512
- Martínez-García et al. (2009b) Martínez-García, E. E., González-Lópezlira, R. A., & Gómez, G. C. 2009, ApJ, 707, 1650
- Martínez-García et al. (2014) Martínez-García, E. E., Puerari, I., Rosales-Ortega, F. F., et al. 2014, ApJ, 793, L19
- Martos et al. (2004) Martos, M., Hernandez, X., Yáñez, M., Moreno, E., & Pichardo, B. 2004, MNRAS, 350, L47
- Meidt et al. (2009) Meidt, S. E., Rand, R. J., & Merrifield, M. R. 2009, ApJ, 702, 277
- Meidt et al. (2014) Meidt, S. E., Schinnerer, E., van de Ven, G., et al. 2014, ApJ, 788, 144
- Merrifield et al. (2006) Merrifield, M. R., Rand, R. J., & Meidt, S. E. 2006, MNRAS, 366, L17
- Patsis et al. (1994) Patsis, P. A., Hiotelis, N., Contopoulos, G., & Grosbol, P. 1994, A&A, 286, 46
- Pour-Imani et al. (2016) Pour-Imani, H., Kennefick, D., Kennefick, J., et al. 2016, ApJ, 827, L2
- Puerari (1993) Puerari, I. 1993, PASP, 105, 1290
- Puerari & Dottori (1992) Puerari, I., & Dottori, H. A. 1992, A&AS, 93, 469
- Roberts (1969) Roberts, W. W. 1969, ApJ, 158, 123
- Savchenko & Reshetnikov (2013) Savchenko, S. S., & Reshetnikov, V. P. 2013, MNRAS, 436, 1074
- Schweizer (1976) Schweizer, F. 1976, ApJS, 31, 313
- Seigar et al. (2005) Seigar, M. S., Block, D. L., Puerari, I., Chorney, N. E., & James, P. A. 2005, MNRAS, 359, 1065
- Seigar et al. (2006) Seigar, M. S., Bullock, J. S., Barth, A. J., & Ho, L. C. 2006, ApJ, 645, 1012
- Seigar & James (1998) Seigar, M. S., & James, P. A. 1998, MNRAS, 299, 685
- Sellwood (2011) Sellwood, J. A. 2011, MNRAS, 410, 1637
- Sheth et al. (2010) Sheth, K., Regan, M., Hinz, J. L., et al. 2010, PASP, 122, 1397
- Speights & Westpfahl (2012) Speights, J. C., & Westpfahl, D. J. 2012, ApJ, 752, 52
- Talbot et al. (1979) Talbot, R. J., Jr., Jensen, E. B., & Dufour, R. J. 1979, ApJ, 229, 91
- Toomre (1981) Toomre, A. 1981, in Structure and Evolution of Normal Galaxies (Cambridge: Cambridge Univ. Press), 111
- Tremaine & Weinberg (1984) Tremaine, S., & Weinberg, M. D. 1984, ApJ, 282, L5
- Wada (2008) Wada, K. 2008, ApJ, 675, 188
- Yu et al. (2018) Yu, S.-Y., Ho, L. C., Barth, A. J., & Li, Z.-Y. 2018, ApJ, 862, 13
- Yuan & Grosbol (1981) Yuan, C., & Grosb\ol, P. 1981, ApJ, 243, 432
- Zimmer et al. (2004) Zimmer, P., Rand, R. J., & McGraw, J. T. 2004, ApJ, 607, 285