Exciton-phonon coupling in the UV absorption and emission spectra of bulk hexagonal boron nitride
Abstract
We present an ab initio method to calculate phonon-assisted absorption and emission spectra in the presence of strong excitonic effects. We apply the method to bulk hexagonal BN which has an indirect band gap and is known for its strong luminescence in the UV range. We first analyse the excitons at the wave vector of the indirect gap. The coupling of these excitons with the various phonon modes at is expressed in terms of a product of the mean square displacement of the atoms and the second derivative of the optical response function with respect to atomic displacement along the phonon eigenvectors. The derivatives are calculated numerically with a finite difference scheme in a supercell commensurate with . We use detailed balance arguments to obtain the intensity ratio between emission and absorption processes. Our results explain recent luminescence experiments and reveal the exciton-phonon coupling channels responsible for the emission lines.
Hexagonal boron nitride (hBN) is well known for its strong luminescence signal in the UV range.Watanabe et al. (2004); Kubota et al. (2007); Watanabe et al. (2009) The fine structure of both emission and absorption spectra has been under heavy discussion until very recently. First-principles calculations agree upon the existence of an indirect quasiparticle band gap from the area around the K point to the M point of the hexagonal Brillouin zone (BZ),Arnaud et al. (2006) with the direct band gap lying eV higher (Fig. 1 (a)). However, the layered structure with a quasi 2D confinement of electron-hole pairs within the layer and reduced screening outside leads to the formation of strongly bound excitons Arnaud et al. (2006). In experimental absorption spectraLauret et al. (2005), a strong peak is seen around eV, which is interpreted by first-principles calculations using many-body perturbation theory (MBPT) as an exciton with a huge binding energy of meV. This direct exciton lies below the bottom of the conduction band (black dashed line in Fig. 1 (a)). Therefore, the optical gap of hBN has often been considered to be “direct”, despite experimental observation of a fine structure appearing in both absorptionWatanabe et al. (2004) and emission spectraJaffrennou et al. (2007); Watanabe and Taniguchi (2009). Symmetry-breaking effects such as Jahn-Teller distortion in the excited stateWatanabe and Taniguchi (2009) or the interaction of excitons with point defectsAttaccalite et al. (2011) were invoked to explain the fine structure.
Recently, with the help of photoluminescence on high-purity samples, Cassabois et al.Cassabois et al. (2016a) explained the fine structure in terms of recombination of electrons from the conduction band minimum to the valence band maximum, assisted by emission of phonons with the corresponding wave vector (See Fig. 1). Several new publications followed up on this topic, cementing this interpretationCassabois et al. (2016b); Vuong et al. (2017a); Martínez et al. (2016); Schue et al. (2018) notably through the mass-dependence of the position of phonon-assisted emission peaks in isotopically clean samples Vuong et al. (2018). Yet, the proposed interpretation is on the level of independent electrons and holes, insufficient to account for the strong Coulomb interaction in hBN and thus neglecting excitonic effects. Clearly, the position of the direct exciton is below the conduction band minimum in Fig. 1. However, excitonic states with finite wave vector can have an energy below the direct exction (horizontal red-dashed line). The position of these indirect excitons and how they contribute to optical absorption and photoluminescence via emission and absorption of phonons of wave vector are the topic of this letter.
Ab initio calculations of indirect absorption are still sparse and, so far, restricted to the independent particle-picture. Notably, indirect absorption was calculated for siliconNoffsinger et al. (2012); Patrick and Giustino (2014); Zacharias et al. (2015); Zacharias and Giustino (2016) where the independent-particle picture is a good approximation. A unified approach to describe on the same footing lattice-dependent band features (such as band gap renormalization with temperature) and phonon-assisted transitions was proposedPatrick and Giustino (2014); Zacharias et al. (2015); Zacharias and Giustino (2016). However, it is restricted to the static approximation and it is computationally expensive. Moreover, a perturbation-theory treatment of the exciton-phonon coupling including dynamical effects was proposed,Antonius and Louie (2017) extending previous works,Toyozawa (1958); Segall and Mahan (1968); Rudin et al. (1990); Marini (2008) although its direct test on real materials is, again, computationally demanding. Here, we present a computational scheme that captures the exciton-phonon coupling in a finite-difference approach and treats luminescence intensities using detailed balance arguments. This enables us to explain the experimental PL spectra in terms of phonon assisted recombination from finite-momentum excitonic states.
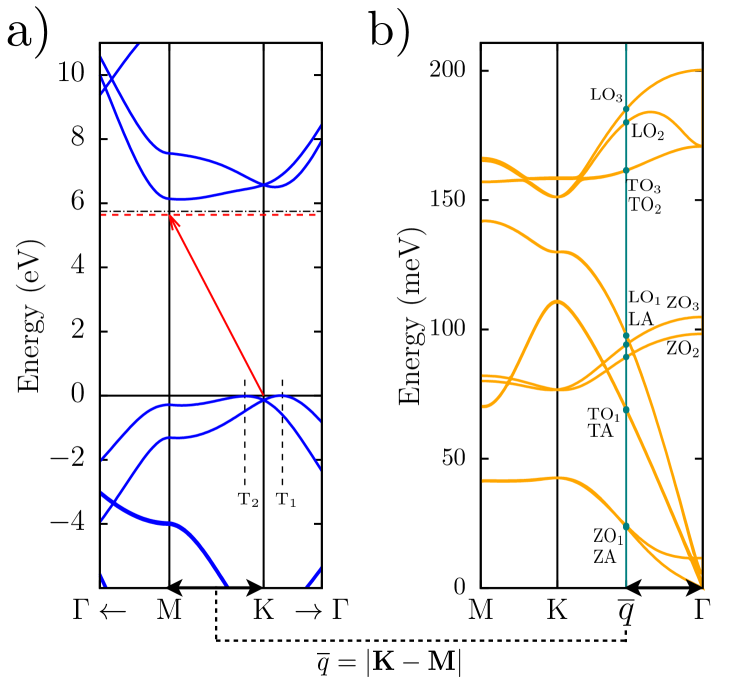
Hexagonal BN is a layered material with a honeycomb lattice in AA’ stacking, possessing space group symmetry. Using experimental lattice parametersSolozhenko et al. (1995), we first compute the direct excitons using the primitive unit cell. Starting with the independent-particle band structure at the the DFT level, we obtain the quasiparticle band structure through a semi-self-consistent GW0 scheme, converging iteratively only the eigenvalues entering the Green’s function. This procedure is used to correct the usual quasiparticle gap underestimation given by the G0W0 approximationHybertsen and Louie (1986) in BN systems.Paleari et al. (2018) We obtain a direct quasiparticle gap of eV, and an indirect one of eV (Fig. 1a). In the following we will approximate the momentum difference of the indirect band gap as . A discussion on this approximation with respect to the exact positions T1 and T2Henck et al. (2017) (Fig. 1a) can be found in the Supplementary Information (SI), Sec. III.
Solving the Bethe-Salpeter equation (BSE)Rohlfing and Louie (2000), we obtain two doubly degenerate excitonic states at which form a Davydov pairDavydov (1969); Dawson (1975) due to interlayer interactionPaleari et al. (2018): The first exciton at eV has symmetry and is thus dark. The second exciton at eV (gray vertical line in Fig. 2) possesses symmetry (odd under inversion) and is thus bright. (More on the group theory can be found in section VI of the SI and in Ref. Paleari et al., 2018. Note that we are only dealing with light polarized parallel to the BN planes which dominates the optical spectra.)
In order to study finite momentum excitons, we perform the same calculations on a special, non-diagonal hBN supercell, containing 12 atoms per layer and chosen such that will be folded onto in its new Brillouin zoneLloyd-Williams and Monserrat (2015) (see SI). Two additional excitonic states, and (dashed red lines in Fig. 2) at and eV, respectively, appear below the lowest-bound direct exciton (in agreement with recent resultsSchue et al. (2018); Sponza et al. (2018) and confirming that not only the quasiparticle gap but also the optical gap of bulk hBN is “indirect”). These states originate from the splitting, at finite momentum, of the doubly degenerate exciton. The exciton transforms as the representation of the symmetry group, and transforms as (see SI). These finite- states are dark by themselves but candidates for phonon-assisted absorption and emission. The same symmetry considerations can be found in the phonon dispersion (Fig. 1b): At , the in-plane phonon modes form Davydov pairs and transform according to the and representation, respectively. Along these representations reduce to and . According to group theory (see SI), the exciton can couple to phonons and the exciton can couple to phonons if the light polarization is parallel to . For light polarization perpendicular to , the exciton couples to phonons and the exciton to phonons. Coupling with out-of-plane modes is forbidden.Vuong et al. (2017b)
Having understood the symmetry constraints for coupling between finite- excitons and phonons, we now derive a general expression to calculate these couplings and, thus, phonon-assisted optical spectra. We use (i) a static approximation for the exciton formation probability and (ii) restricting the coupling to harmonic phonons with momentum . In our calculations, we focus on the energy region close to and . We proceed by considering the complex dielectric function , which describes the linear response of the system and is closely related to the experimentally measurable absorption coefficient ( being the refractive index). A calculation with the atoms clamped at the equilibrium positions yields where is the formation probability of exciton and is a dimensional constant (Sec. I in SI). The denominator determines the peak structure of , with being the exciton energy and the exciton linewidth. In order to obtain the response due to the indirect excitons, we consider the Taylor expansion of up to second-order in the atomic displacements.Zacharias and Giustino (2016) This gives a static correction to the equilibrium response , in which the term (Sec. V in SI)
| (1) |
adds the contribution of transitions assisted by a single phonon of momentum . In this expression represents the polarisation direction of the incoming light, over which we average, and labels each of the equivalent -vectors in the BZ, over which we sum. refers to a set of atomic displacements according to phonon mode with momentum (indicated with a vertical teal line in the phonon dispersion plot of Fig. 1). The quantity is evaluated by finite displacement from the equilibrium atomic positions.111The magnitude of the lattice displacement for the finite-difference derivatives was converged to just above the threshold of numerical noise. The harmonic behaviour of with respect to lattice displacements was numerically verified. By varying the light polarisation directions, we confirm that the spectrum resulting from is -periodic so that . The last factor is the thermal average of the squared displacement of a quantum harmonic oscillator, given by , with being the Bose-Einstein distribution for phonons and .222 is the generalised unit cell mass obtained from the normalisation condition of phonon eigenvectors and atomic masses for boron and for nitrogen. Even though the function includes contributions from the derivatives of both and , for indirect transitions only one term survives in its imaginary part:
| (2) |
where restricts the sum to the excitons. This result allows us to reintroduce the phonon frequency dependence of by imposing the correct energy conservation from perturbation theory and distinguishing between phonon emission () and phonon absorption (): Finally, renaming the numerator between square brackets in Eq. (1) (including the factors) as , since it represents the static formation probability of exciton mediated by a phonon mode with momentum and frequency , we obtain the final expression:
| (3) |
Here, the upper (lower) sign refers to the process of phonon absorption (emission).
Applying Eq. (3) to the description of the process of exciton formation via photon absorption together with phonon emission at T = 0 K, computing the derivatives of with finite-difference DFT-BSE calculations in the non-diagonal supercell, we obtain the spectrum in Fig. 2. It is possible to identify a multi-peak structure associated to the coupling of both the and excitons to all the in-plane phonon modes, with the higher-energy state accounting for most of the oscillator strength. The coupling of and with specific phonon modes depends on the light polarisation direction according to the symmetry selection rules detailed in Sec. VI of the SI.
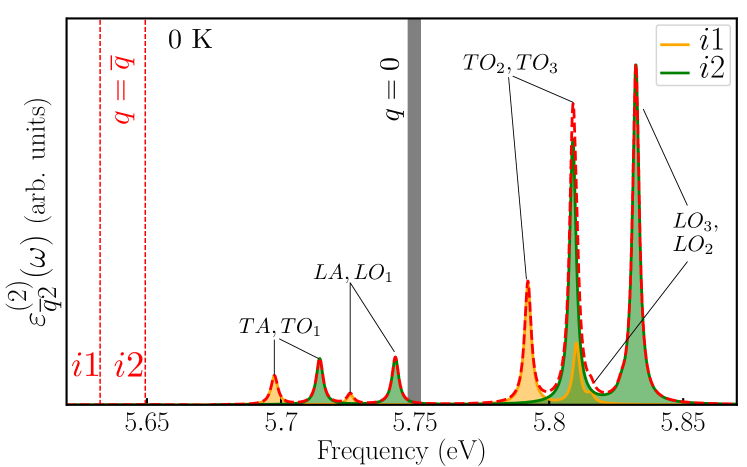
Since the phonon frequencies are close to the energy difference between direct and indirect excitons, the phonon-assisted peaks are distributed around the brithtest direct exciton peak with most of the oscillator strength remaining in this narrow energy range. This result suggests that phonon-assisted absorption in hBN is at the origin of the fine structure observed around the brightest exciton peak in absorption experiments.Watanabe et al. (2004); Schue et al. (2018)

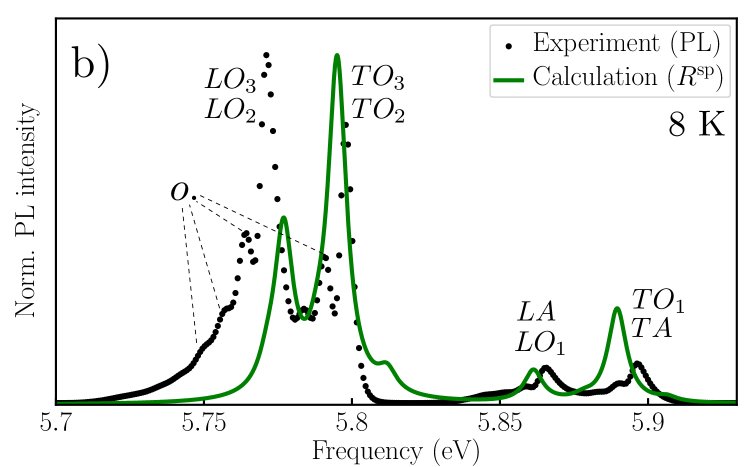
We now turn to the calculation of luminescence spectra. Here, we will concentrate on photon-emission assisted by phonon emission (whose intensity is while the intensity of luminescence assisted by phonon absorption is , i.e., is negligible at small temperatures). The energy of an emitted photon differs from the one of an absorbed photon (indirect absorption with phonon emission) by twice the frequency of the phonon involved. We thus define . This implies that the probabilities of exciton formation and annihilation are the same (i.e. detailed balance of phonon-assisted optical processes), a reasonable assumption in our scheme as we are computing the transition rates in the static approximation. Because of this, each phonon-assisted peak is mirrored with respect to the energy of the excitonic state involved. Such approach, however, does not take into account the fact that the emission process should be proportional to the temperature-dependent occupations of the excitonic states, which leads to the reversal of the relative intensities of some peaks and to the quenching of others, when compared to . In order to properly describe emission processes, we employ the Van Roosbroeck-Shockley (RS) relation to compute the spontaneous emission rate starting from the absorption coefficient,Landsberg (1991) by making two common experimental assumptions: (i) absorption and emission are in steady state, with the contribution from stimulated emission being very small; (ii) in steady state, the occupation functions of the excitonic states involved in recombination processes can be approximated with those at thermal equilibrium (Bose-Einstein distribution for excitons). To apply the RS relation, originally derived in the context of direct independent-particle transitions,van Roosbroeck and Shockley (1954) we have to extend it to excitons (see Sec. VII of SI): In the low-density limit, this can be approximated by the Boltzmann factor ( being the energy minimum of the exciton dispersion curve and the energy of any exciton ).
| (4) |
It is sufficient to compute the refractive index from , which completely determines its slow decay at low frequencies. Because of the large energy difference between and the main direct peak, the latter will always be suppressed by the Boltzmann factor up to room temperature, and therefore it should not be seen in a PL experiment. The results for are plotted in Fig. 3a. The energy differences between excitonic levels ( meV) and the phonon frequencies (from to meV) are large, giving rise to a well-spaced peak structure that can be easily resolved. We notice two separated groups of features which are clearly seen in experiment (Fig. 3b, black dots): one at higher energy generated by low-frequency phonon emission, and the other at lower-energy due to high-frequency optical phonons. The emission spectrum is almost completely dominated by the lowest-bound exciton since the occupation factor quenches most of the peaks related to . However, experiments have shownCassabois et al. (2016a) that in bulk hBN the excitonic temperature that goes into the Boltzmann factor is greater than the lattice temperature . If we set K in , we obtain only the peaks coming from , while setting to the experimental value of K (as in Fig. 3a) leads to the appearance of the quenched peaks from . On the experimental side, the peaks due to high-frequency modes are clearly visible in Fig. 3b at K: the separation between these peaks thus corresponds to the separation between the LO and TO modes at point in the theoretical calculations, while in experiment it corresponds to the splitting at point , where is the error committed by approximating the ‘true’ -point with . We attribute to this discrepancy the difference of meV between the theoretical and experimental peak separations.333Our error in -space, possibly affecting the positions of the peaks related to phonon modes with a steep dispersion curve, is approximately % of K, with Å-1. As expected, we cannot capture the various satellite peaks in Fig. 3b, which experimentally are assigned to multi-phonon processes involving zone-center shear phonon modes.Vuong et al. (2017c) In our results, the quasi-degenerate transverse modes TO2 and TO3 couple with similar strength to , whereas the longitudinal mode LO3 has a higher frequency than LO2 and a much weaker coupling to (in the absorption case, the coupling of mode LO3 with is instead the strongest one). This leads to a discrepancy in the relative intensities of peaks LO2/LO3 and TO2/TO3 between theory and experiment. We consider it possible that the non-negligible sum of the overtone peaks to the main LO2/LO3 peak is responsible for such inversion in relative intensity.
In conclusion, we have presented a theoretical and computational approach to phonon-assisted absorption and emission in bulk hBN where very strong excitonic effects are present. Using a supercell for finite-q excitons and a finite-difference method for exciton-phonon coupling, we are able to reproduce the single-phonon-assisted spectral features obtained in photoluminescence experiments. The structure of the emission spectrum can be understood in terms of a Davydov pair of finite-q excitons coupling with different strengths to the in-plane phonon modes. The method can be applied to other layered materials with indirect gap, e.g. bilayers of transition metal dichalcogenides or to the case of monolayer WSe2 whose optical gap, previously assumed to be “direct”, might in fact be “indirect”.Hsu et al. (2017) Moreover, it will stimulate further investigations directed toward a full many-body perturbation theory of exciton-phonon coupling, as well as to sound and reliable approximations applicable to calculations of more complex materials.
F. P. and L. W. acknowledge support from the FNR, Luxembourg (Projects EXCPHON/11280304 and INTER/ANR/13/20/NANOTMD, respectively). A. M.-S. acknowledges the Juan de la Cierva (Grant IJCI-2015-25799) program (MINECO, Spain). H. M. acknowledges the F.R.S.-FNRS through the PDR Grants HTBaSE (T.1071.15). We acknowledge F. Giustino for suggesting the use of the RS relation and M. Zacharias, T. Galvani, M. Barborini, and S. Reichardt for stimulating discussions. We are also indebted to T. Q. P. Vuong, G. Cassabois and B. Gil for critical observations about the preliminary results.
References
- Watanabe et al. (2004) K. Watanabe, T. Taniguchi, and H. Kanda, Nat. Mater. 3, 404 (2004).
- Kubota et al. (2007) Y. Kubota, K. Watanabe, O. Tsuda, and T. Taniguchi, Science 317, 932 (2007).
- Watanabe et al. (2009) G. Watanabe, T. Taniguchi, T. Niiyama, K. Miya, and M. Taniguchi, Nat. Photonics 3, 591 (2009).
- Arnaud et al. (2006) B. Arnaud, S. Lebègue, P. Rabiller, and M. Alouani, Phys. Rev. Lett. 96, 026402 (2006).
- Lauret et al. (2005) J. S. Lauret, R. Arenal, F. Ducastelle, A. Loiseau, M. Cau, B. Attal-Tretout, E. Rosencher, and L. Goux-Capes, Phys. Rev. Lett. 94, 037405 (2005).
- Jaffrennou et al. (2007) P. Jaffrennou, J. Barjon, J.-S. Lauret, A. Loiseau, F. Ducastelle, and B. Attal-Tretout, J. App. Phys. 102, 116102 (2007).
- Watanabe and Taniguchi (2009) K. Watanabe and T. Taniguchi, Phys. Rev. B 79, 193104 (2009).
- Attaccalite et al. (2011) C. Attaccalite, M. Bockstedte, A. Marini, A. Rubio, and L. Wirtz, Phys. Rev. B 83, 144115 (2011).
- Cassabois et al. (2016a) G. Cassabois, P. Valvin, and B. Gil, Nat. Photonics 10, 262 (2016a).
- Cassabois et al. (2016b) G. Cassabois, P. Valvin, and B. Gil, Phys. Rev. B 93, 035207 (2016b).
- Vuong et al. (2017a) T. Q. P. Vuong, G. Cassabois, P. Valvin, S. Liu, J. H. Edgar, and B. Gil, Phys. Rev. B 95, 201202 (2017a).
- Martínez et al. (2016) L. J. Martínez, T. Pelini, V. Waselowski, J. R. Maze, B. Gil, G. Cassabois, and V. Jacques, Phys. Rev. B 94, 121405 (2016).
- Schue et al. (2018) L. Schue, L. Sponza, A. Plaud, H. Bensalah, K. Watanabe, T. Taniguchi, F. Ducastelle, A. Loiseau, and J. Barjon, ArXiv e-prints (2018), arXiv:1803.03766 [cond-mat.mtrl-sci] .
- Vuong et al. (2018) P. Vuong, S. Liu, A. Van Der Lee, R. Cusco, L. Artus, T. Michel, P. Valvin, J. Edgar, G. Cassabois, and B. Gil, Nature Materials 17, 152 (2018).
- Noffsinger et al. (2012) J. Noffsinger, E. Kioupakis, C. G. Van de Walle, S. G. Louie, and M. L. Cohen, Phys. Rev. Lett. 108, 167402 (2012).
- Patrick and Giustino (2014) C. E. Patrick and F. Giustino, Journal of Physics: Condensed Matter 26, 365503 (2014).
- Zacharias et al. (2015) M. Zacharias, C. E. Patrick, and F. Giustino, Phys. Rev. Lett. 115, 177401 (2015).
- Zacharias and Giustino (2016) M. Zacharias and F. Giustino, Phys. Rev. B 94, 075125 (2016).
- Antonius and Louie (2017) G. Antonius and S. G. Louie, ArXiv e-prints (2017), arXiv:1705.04245 [cond-mat.mtrl-sci] .
- Toyozawa (1958) Y. Toyozawa, Progress of Theoretical Physics 20, 53 (1958).
- Segall and Mahan (1968) B. Segall and G. D. Mahan, Phys. Rev. 171, 935 (1968).
- Rudin et al. (1990) S. Rudin, T. L. Reinecke, and B. Segall, Phys. Rev. B 42, 11218 (1990).
- Marini (2008) A. Marini, Phys. Rev. Lett. 101, 106405 (2008).
- Solozhenko et al. (1995) V. Solozhenko, G. Will, and F. Elf, Solid State Communications 96, 1 (1995).
- Hybertsen and Louie (1986) M. S. Hybertsen and S. G. Louie, Phys. Rev. B 34, 5390 (1986).
- Paleari et al. (2018) F. Paleari, T. Galvani, H. Amara, F. Ducastelle, A. Molina-Sánchez, and L. Wirtz, 2D Materials 5, 045017 (2018).
- Henck et al. (2017) H. Henck, D. Pierucci, G. Fugallo, J. Avila, G. Cassabois, Y. J. Dappe, M. G. Silly, C. Chen, B. Gil, M. Gatti, F. Sottile, F. Sirotti, M. C. Asensio, and A. Ouerghi, Phys. Rev. B 95, 085410 (2017).
- Rohlfing and Louie (2000) M. Rohlfing and S. G. Louie, Phys. Rev. B 62, 4927 (2000).
- Davydov (1969) A. Davydov, Theory of Molecular Excitons (MacGraw-Hill, 1969).
- Dawson (1975) P. Dawson, J. Phys. Chem. Solids 36, 1401 (1975).
- Lloyd-Williams and Monserrat (2015) J. H. Lloyd-Williams and B. Monserrat, Phys. Rev. B 92, 184301 (2015).
- Sponza et al. (2018) L. Sponza, H. Amara, C. Attaccalite, S. Latil, T. Galvani, F. Paleari, L. Wirtz, and F. Ducastelle, ArXiv e-prints (2018), arXiv:1806.06201 [cond-mat.mtrl-sci] .
- Vuong et al. (2017b) T. Q. P. Vuong, G. Cassabois, P. Valvin, V. Jacques, A. V. D. Lee, A. Zobelli, K. Watanabe, T. Taniguchi, and B. Gil, 2D Materials 4, 011004 (2017b).
- Note (1) The magnitude of the lattice displacement for the finite-difference derivatives was converged to just above the threshold of numerical noise. The harmonic behaviour of with respect to lattice displacements was numerically verified. By varying the light polarisation directions, we confirm that the spectrum resulting from is -periodic so that .
- Note (2) is the generalised unit cell mass obtained from the normalisation condition of phonon eigenvectors and atomic masses for boron and for nitrogen.
- Landsberg (1991) P. T. Landsberg, Recombination in semiconductors (Cambridge University Press, 1991) Chap. Radiative recombination (mainly for bands).
- van Roosbroeck and Shockley (1954) W. van Roosbroeck and W. Shockley, Phys. Rev. 94, 1558 (1954).
- Note (3) Our error in -space, possibly affecting the positions of the peaks related to phonon modes with a steep dispersion curve, is approximately % of K, with Å-1.
- Vuong et al. (2017c) T. Q. P. Vuong, G. Cassabois, P. Valvin, V. Jacques, R. Cuscó, L. Artús, and B. Gil, Phys. Rev. B 95, 045207 (2017c).
- Hsu et al. (2017) W.-T. Hsu, L.-S. Lu, D. Wang, J.-K. Huang, M.-Y. Li, T.-R. Chang, Y.-C. Chou, Z.-Y. Juang, H.-T. Jeng, L.-J. Li, and W.-H. Chang, Nat. Commun. 8, 929 (2017).