Monatomic Co, CoO2, and CoO3 Nanowires on Ir(100) and Pt(100) surfaces: Formation, Structure, and Energetics
Abstract
In this study we investigate the structural and chemical changes of monatomic CoO2 chains grown self-organized on the Ir(100) surface [P. Ferstl et al., PRL 117, 2016, 046101] and on Pt(100) under reducing and oxidizing conditions. By a combination of quantitative low-energy electron diffraction, scanning tunnelling microscopy, and density functional theory we show that the cobalt oxide wires are completely reduced by H2 at temperatures above 320 K and a 31 ordered Ir2Co or Pt2Co surface alloy is formed. Depending on temperature the surface alloy on Ir(100) is either hydrogen covered ( 400 K) or clean and eventually undergoes an irreversible order-disorder transition at about 570 K. The Pt2Co surface alloy disorders with the desorption of hydrogen, whereby Co submerges into subsurface sites. Vice versa, applying stronger oxidants than O2 such as NO2 leads to the formation of CoO3 chains on Ir(100) in a 31 superstructure. On Pt(100) such a CoO3 phase could not be prepared so far, which however, is due to the UHV conditions of our experiments. As revealed by theory this phase will become stable in a regime of higher pressure. In general, the structures can be reversibly switched on both surfaces using the respective agents O2, NO2 and H2.
pacs:
61.05.jh, 68.35.bd, 68.37.Ef, 68.47.Gh, 82.65.+rI Introduction
In modern heterogeneous catalysis complex metal-oxide composite materials are used in numerous processes Ertl et al. (1997). These so-called “supported catalysts” consist of highly dispersed metal particles on an oxide support. By this, the catalytic activity and reactivity of both components are combined in a synergetic way. For example the combination of transition metal oxides (TMOs) and noble metal nanoparticles is known to exhibit extraordinary performance for a variety of low temperature catalytic oxidation reactions such as carbon monoxide conversionFu et al. (2013); Rodriguez et al. (2007). For all these processes the interface between the metal and the oxide support plays a crucial role for the catalytic performance as it often provides just the active sites for certain chemical reactions e.g. coordinatively unsaturated (CUS) sitesFu et al. (2013). Thus optimizing the metal/oxide interface can maximize the reaction rate.
A disadvantage of supported catalysts is the relatively small interface area between the metal particles and the oxide. Conventionally, this can be increased by changing the density of the nanoparticles Boffa et al. (1994) or by using more sophisticated architectures Ge et al. (2016); Yamada et al. (2011). Another approach towards high-density oxide-metal interfaces are so-called oxide-on-metal inverse catalysts, which are bimetallic nanoparticles, where the oxides and thus the active interfaces are formed right at their surfaces in a preceding activation process or during the reaction. Such nanostructures in particular with platinum as the base material find application e.g. as electrocatalysts for both the anodic oxidation reaction and the cathodic oxygen reduction reaction in fuel cells Wu and Yang (2013). Moreover, an unprecedented performance for the oxygen reduction and alcohol oxidation reactions has been found recently for specially designed Pt-Co nanowires Guo et al. (2016). Also, for other Pt-Co nanostructures the formation of cobalt surface oxides was directly observed during the oxidation in O2 Xin et al. (2014).
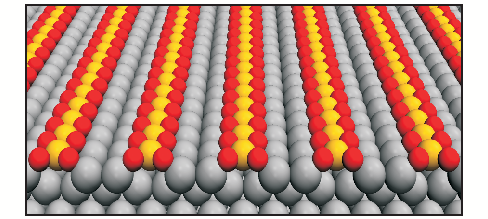
Despite their technological importance a characterization of these metal/oxide interfaces on the atomic level is not possible in most of the cases due to the inaccessibility for standard surface science techniques. In particular diffraction methods, which would allow for a quantitative structural analysis, cannot be applied due to the lack of long range order in these systems. Recently, however, we found that on the flat Ir(100) surface quasi one-dimensional TMO chains form self-organized and strictly periodic Ferstl et al. (2016a). This allows to overcome all the mentioned restrictions and opens direct access to the detailed structure and composition of the system. A ball model of this chain phase is displayed in Fig. 1.
Until now, related TMO chain structures could only be prepared via step decoration of vicinal surfaces Surnev et al. (2010); Li et al. (2010); Ma et al. (2013), where the density and in particular the degree of long range order is rather limited. In contrast, the high density of one-dimensional TMO chains leads to a maximum of metal/oxide interfaces for the given surface area and can therefore be regarded as a model system for an extremely dispersed case of a bifunctional TMO-noble metal system.
In the present study we will show using the example of cobalt that the above mentioned highly ordered chain structures form self-organized also on the catalytically more relevant Pt(100) surface. It is rather likely that those TMO chains will appear in real (Pt-based) catalytically active systems as well making the presented model studies even more valuable. In the following we also demonstrate that by interaction with H2, CO, or NO2 these cobalt oxide nanowires can be reversibly reduced or further oxidized on both Pt(100) and Ir(100) surfaces, while the one-dimensional character of the phases is always kept intact. This strict periodicity of all the different phases allows their structural characterization on an atomic level not merely by scanning tunneling microscopy (STM) but also by quantitative low-energy electron diffraction (LEED) with crystallographic precision. Accompanying density-functional theory (DFT) calculations do not only corroborate our structural findings but also give additional insights into the energetics and stability of the differently oxidized states of the cobalt chains. The scope of this publication is laid exclusively on the structural and chemical variations of the chain phases, while the kinetics and products of the chemical reactions investigated here will be addressed in forthcoming publications.
II Methods
II.1 Experimental details and sample preparation
The LEED and STM experiments were performed in an ultra-high vacuum chamber consisting of two separately pumped segments. In one part the sample preparation and the LEED measurements were performed at an operational pressure in the low 10-10 mbar range. Large series of images of the complete diffraction pattern taken at normal incidence made up the raw data base for LEED intensity spectra. They were recorded right after preparation and subsequent cool-down to about 100 K, which was achieved within 1-5 min depending on the initial annealing temperature. The time to collect a whole dataset (45-800 eV in steps of 0.5 eV) took about 10 min only, so that residual gas contamination can be regarded as negligible. For further characterization the sample could be transferred to the second part of the chamber ( 210-11 mbar) equipped with a room temperature beetle-type STM. Topographs were recorded with bias voltages from few millivolts to about 1 V applied to the sample (sample current 1 nA) using etched tungsten tips. Further details on the experimental procedures are given in the Supplemental Material of Ref. Ferstl et al., 2016a.
The preparation of the Ir(100) and Pt(100) substrates involved an initial cleaning by ion sputtering (2 keV Ne+, 10 A) and annealing to 1300 K in an oxygen atmosphere of 10-6 mbar. The temperature was controlled using a K-type thermocouple directly attached to the crystal. In order to prepare the quasi one-dimensional CoO2-chain phase, a 1/3 monolayer (ML) of cobalt was deposited on either the oxygen covered Ir(100)-21-O phase or the clean, reconstructed Pt(100) surface using an electron beam evaporator. Subsequently, the surface was oxidized at an O2 pressure of 10-7 mbar and annealed to 970 K in case of Ir(100) and to 770 K for Pt(100).
II.2 LEED calculations
For the full-dynamical LEED calculations intensity versus energy curves [“-spectra”] were extracted in an offline evaluation from the stored stack of LEED images using the programme package EE2010 Opheys (2011), which automatically corrected for the background of the quasi-elastically scattered electrons. The post-processing of the spectra involved the normalization to the measured, energy-dependent primary beam intensity, averaging over symmetrically equivalent beams, correction for the cosine of the viewing angle, and slight smoothing. Calculations were performed using the TensErLEED code Blum and Heinz (2001) which is based on the perturbation method Tensor LEED Heinz (1995); Rous et al. (1986). Due to the high energy data (up to 800 eV) phase shifts up to = 14 were required, which were calculated by the program EEASiSSS of J. Rundgren Rundgren (2003). This program optimizes a superposition of muffin-tin potentials in a slab geometry not far from the best-fit structure and also provides an energy dependent real part of the inner potential which varied smoothly by about 8 eV over the large energy range of the calculations. The damping of the electrons due to inelastic processes was taken into account by a constant optical potential , which was fitted to 5.4 - 5.9 eV for the different phases grown on iridium and 5.0 eV for those on platinum. As lattice parameters we used 2.7116 Å Arblaster (2010) and 2.7699 Å Arblaster (1997) according to a data acquisition temperature of 100 K. During the fitting procedure all geometrical parameters down to the 6th layer were varied regarding the symmetry of the unit cell ( for 31 and for 11). Additionally, the vibrational amplitudes of the surface species were optimized while the vibrations of bulk atoms were fixed at values of 0.0425 Å and 0.0650 Å calculated according to Ref. van Hove and Tong, 1979 from the respective Debye temperatures of 420 K and 236 K.Arblaster (1996) The angular spread within the slightly convergent primary beam used in the LEED experiment was accounted for by a small off-normal angle (typically 0.4∘ for the used LEED optics) and averaging over 4-8 azimuthal directions of incidence.
Though quite a number of structural and non-structural parameters (up to 33) were fitted in the course of the analyses, the huge databases collected for each of the phases still ensured very large redundancy factors in the range = 12-26 (for details see Supplemental Material Sup ). The degree of correspondence between calculated and experimental spectra was quantified by the Pendry R-factor Pendry (1980), which also allows an estimate of the statistical errors of each parameter via its variance . Due to the low R-factor values achieved for all the LEED analyses, also very small error margins result which are in the range of 0.01 Å or below for vertical coordinates of Ir and Co atoms and about 0.03 Å for lateral ones. Since oxygen is a much lighter scatterer particularly at higher electron energies, the errors are typically twice as large. The statistical errors for every single parameter were calculated as usual via single parameter variation (and thus neglecting possible parameter couplings) and are tabulated for all LEED analyses in the Supplemental Material Sup .
II.3 DFT calculations
All DFT slab calculations were performed spin-polarized in analogy to our former studyFerstl et al. (2016a) of these chain phases. Regarding the spin ordering along the chains, only collinear ferromagnetic and anti-ferromagnetic configurations have been considered. We used the Vienna Ab-initio Simulation Package (VASP) Kresse and Hafner (1993); Kresse and Furthmüller (1996) in the projector augmented wave (PAW) setup Blöchl (1994); Kresse and Joubert (1999). A plane-wave cutoff of 400 eV was chosen and exchange correlation effects were treated within the PBE Perdew et al. (1996) approximation adding DFT+U corrections Dudarev et al. (1998) to the Co- states with a value of U-J = 1.5 eV . The different surface phases were modelled by asymmetric (32) surface slabs with 7 Ir (Pt) layers separated by at least 14.7 Å vacuum. None of the atomic positions was kept fixed and all of the atoms where relaxed until changes in the total energies dropped below 0.1 meV per simulation cell. A 461 Monkhorst-Pack type -point mesh was used to sample the Brillouin zone which was increased to 691 for the calculation of the chain formation energies and the adsorption energies of additional oxygen atoms. The formation and adsorption energies are referenced to the free O2 molecule, calculated in its spin-polarized triplet ground state within a cubic cell of 10 Å side length. Spatial positions derived from the DFT calculations were scaled by factors of 0.9883 for Ir and 0.9874 for Pt in order to match the calculated bulk lattice parameters with the experimental ones.
III Growth of CoO2 chain phases on Ir(100) and Pt(100)
In a preceding publication Ferstl et al. (2016a) we have shown that the oxidation of one third of a monolayer of cobalt (or other transition metals) on Ir(100) at elevated temperatures leads to the formation of a perfectly ordered 31 phase consisting of one-dimensional CoO2 chains aligned strictly parallel and well-separated with a mutual distance of 3. The central monatomic Co wire is shifted in the direction of the chain by half a lateral unit vector. Below each oxide chain one atomic row of Ir is missing (cf. Fig. 1) so that the Co core of the chains has no direct bond to Ir and interacts with the substrate only via the oxygen atoms. This reduced substrate interaction of the chains leads to an at least partially one-dimensional character of its electronic and in particular of its magnetic properties Ferstl et al. (2016a). The iridium atoms expelled from the top layer during the oxidation process (in order to form the missing row substrate structure) nucleate at temperatures around 650 K into islands, again with the 31 oxide phase on top. Only at higher temperatures around 950 K the surface diffusion becomes sufficiently enhanced so that all extra material can be transported to step edges and plain terraces covered by the oxide phase result as shown in Fig. 2(a). Consequently, the corresponding LEED pattern exhibits very sharp and intense superstructure spots [Fig. 2(b)].
The large lateral mass transport required to produce a perfect 31 oxide phase explains why there is no qualitative difference whether the initial cobalt deposition is performed at the unreconstructed 11 or the reconstructed 51-hex surface with a 20% higher atomic density of the topmost layer Van Hove et al. (1981); Schmidt et al. (2002). In the latter case the amount of expelled atoms which have to be removed is just 0.53 ML instead of 0.33 ML for the unreconstructed surface.
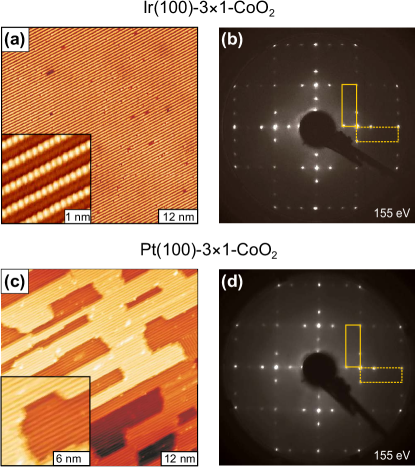
The recipe for preparing a homogeneous 31-CoO2 phase developed for Ir(100) can in principle be transferred to the Pt(100) surface as well. However, on Pt(100) the chains are thermally less stable and start to decay already at around 770 K, which is 200 K lower than on Ir(100). This leads to a reduced mass transport of Pt atoms on the surface even for the highest possible annealing temperatures. Consequently, Pt adatom islands always remain on the surface as displayed in Fig. 2(c), which restrict the lateral growth of the oxide chains. The smaller average domain size of the 31 phase on Pt(100) is also expressed in the LEED pattern [Fig. 2(d)] by somewhat broader superstructure spots compared to the case of Ir(100). Also different to iridium is the fact that the cool-down in oxygen flux does not lift the hexagonal reconstruction of the Pt(100) surface. Therefore, Co deposition has to be performed on the reconstructed surface, so that about half of the surface is eventually covered by adatom islands.
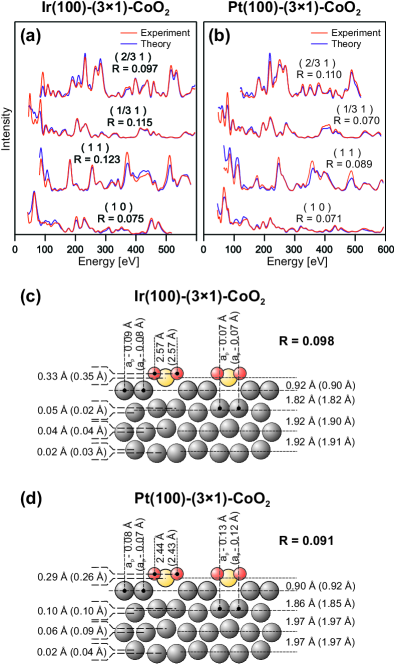
A simple comparison of LEED -spectra for both substrates as shown in the Fig. 3(a, b) reveals strong similarities in particular for the superstructure spots, which are especially sensitive to the surface oxide structure. The larger deviations observed for the integer order spots are mostly due to the layer distances increased by 0.05 Å for Pt(100) compared to Ir(100), since the scattering properties of both elements are almost identical. An independent quantitative LEED analysis for the Pt(100)-31-CoO2 phase – in analogy to the one performed earlier for Ir(100) Ferstl et al. (2016a) – showed an excellent agreement between experimental and calculated -spectra [Fig. 3(b)], which is expressed quantitatively by a Pendry R-factor as low as 0.091 for the present analysis. (This also proves that the above mentioned limited size of ordered domains did not deteriorate the fit quality.) The full set of spectra and raw data files can be found in the Supplemental Material Sup .
The detailed crystallographic structure of the Pt(100)-31-CoO2 phase is displayed in the Fig. 3(d) compared to that for Ir(100) above [Fig. 3(c)]. As indicated by the similar -spectra the structures are nearly identical. In both phases the oxygen atoms are bound to two cobalt and one substrate atom each. In case of the Pt substrate the oxygen atoms at both sides of the Co row have to be closer to each other in order to maintain a similar Co-O bond length (1.87 Å vs. 1.89 Å for Ir) despite the 0.07 Å larger Co-Co spacing within the oxide chain (due to the substrate’s lateral lattice parameter). Also, the Co row is lifted up by practically the same amount on both substrates (0.90 Å vs. 0.92 Å) and this essentially planar binding only via the oxygen atoms leads to exceptionally large (vertical) vibrational amplitudes for the Co atoms of 0.16 Å (Ir) and 0.14 Å (Pt) at 100 K. Also the strain-field induced relaxation pattern within the subsurface layers is qualitatively the same for both substrates. Only the amplitudes of the local displacements of substrate atoms from their bulk positions are found to be almost twice as large for Pt than for Ir atoms, which is in line with the significantly different elastic moduli of these elements ( 170 GPa; 528 GPa)Samsonov (2012). All the structural parameters determined by the LEED analyses are perfectly reproduced by independent DFT calculations with a deviation of less than 1.3 pm on average, i.e. well within the limits of error for both methods. A complete compilation of all bestfit parameter values together with the corresponding error margins and DFT predictions can be found in the Supplemental Material Sup .
IV Reduction of cobalt oxide chains by H2
IV.1 STM and LEED Appearance
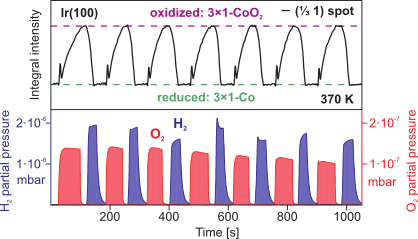
Exposing the CoO2 chain phase grown on Ir(100) to hydrogen at temperatures between 330 K and 570 K does not change the 31 periodicity of the LEED pattern (cf. Fig. 4(a)), however, the relative intensities of diffraction spots are altered as can be seen already by a visual inspection. These changes become more obvious when comparing -spectra of superstructure spots as shown for one example in Fig. 4(c) (green and red curve). R-factor values close to 1 (indicating statistical independence of the data) prove that the local atomic structure must have changed substantially within the 31 phase. Since hydrogen is a very weak scatterer the spectral variations cannot be caused by its mere presence on the surface. Instead, we have to assume that some kind of reduction process has happened to the oxide chains. In fact, no desorption of oxygen (or water) can be observed from this new phase after the initial reduction process when the sample is heated up to a temperature of 1300 K. We thus must have a fully reduced 31 phase. However, when heating the sample beyond 370 K some hydrogen is found to desorb from the sample. This desorption is accompanied with a quite moderate alteration of the LEED -spectra [red and purple curves in Fig. 4(c)] expressed by R-factors in the range of 0.2. Such spectral changes are typical for the impact of hydrogen on the local positions of substrate atoms being in the range of some picometers. Obviously, the reduced phase can exist with or without adsorbed hydrogen.
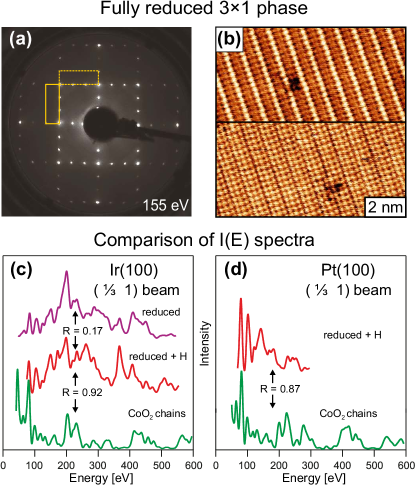
Further insights into the structure of this reduced 31 phase can be gained from STM. In Fig. 4(b) two different STM appearances of the reduced phase on Ir(100) are displayed depending on tip conditions. In the upper part we see one single, apparently protruding atomic row as for the chain phase [cf. inset in Fig. 2(a)] though with a considerably reduced corrugation of only 0.2 Å compared to 0.8 Å before. The smaller corrugation also allows to image the Ir rows in between, which turn out to be now in line with the Co rows. This becomes even more obvious in the lower part of Fig. 4(b), where chemical resolution is lost. Here, we clearly see triples of atoms in line with each other, of which the center one must be the Co atom for symmetry reasons. The triplets appear separated by a somewhat larger distance, which, however, could also be an electronic artefact of STM imaging. The interpretation of these images is quite obvious: Without any oxygen the Co rows cannot reside any more far above the substrate’s missing row structure. Instead, they have to “fall down” into the troughs making up new bonds with Ir atoms. In order to increase the atomic coordination number the Co row as a whole shifts laterally by half a substrate unit vector to bring the Co atoms into substitutional sites. In total, the 31 phase converts into an ordered surface alloy with an Ir2Co top layer. It should be noted that just for steric reasons the postulated shift of Co rows must be accompanied by the creation of defects like expelled Co atoms or vacancies within the chains, which cannot be found in large numbers in the STM images. However, at the temperatures of the reduction process, where this structural rearrangement occurs, single Co atoms are already quite mobile at the surface as known from film growth experiments on Ir(100) Giovanardi et al. (2008); Heinz and Hammer (2009). Thus, the defects in the Co rows can readily heal during the reordering process and so vanish from the surface.
From this reduced state the 31-CoO2 chain phase can be
recovered by exposing the surface to oxygen at temperatures as low
as 350 K. This can be easily understood since no material transport
is necessary to restore the long range order. The cobalt wires only
have to be shifted and lifted out of the surface. So, the complete
cycle of water formation from molecular oxygen and hydrogen can be
carried out repeatedly at constant sample temperature just by
varying the oxygen and hydrogen partial pressure at the surface as
is demonstrated in Fig. 5. During this process the actual
state of the surface can be continuously monitored via the intensity
variation of 31 superstructure spots. For not too high
partial pressures even the kinetics of the reordering process
including the possible appearance of ordered intermediate phases
(indicated here by the
spikes in the rising slopes of the LEED intensity of Fig. 5) becomes accessible.
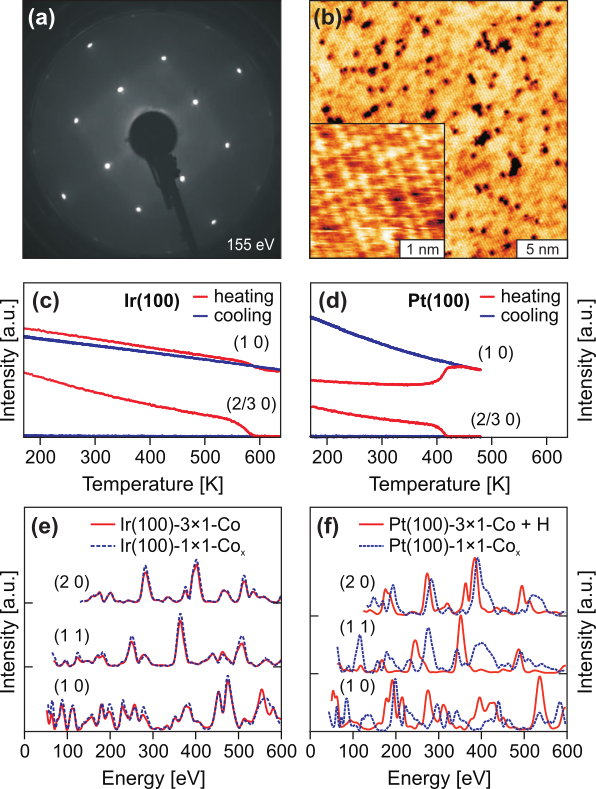
When the reduced Ir(100)-31 phase is heated beyond 570 K or the reduction process is just performed at these high temperatures, then the 31 superstructure vanishes and a sharp 11 LEED pattern can be seen instead [Fig. 6(a)]. Also in STM the characteristic stripe-like appearance of the Co chains [cf. Fig. 4(b)] is missing, while atomically resolved images reveal varying apparent heights of atoms [Fig. 6(b)]. The structural transition turns out to be irreversible since the superstructure spots do not reappear upon subsequent cooling as is demonstrated by the thermal evolution of spot intensities in Fig. 6(c). The integer order spot intensities, in contrast, are only negligibly affected by the structural transition, their continuous decrease of intensity with temperature is simply due to a Debye-Waller damping caused by enhanced vibrational motions of scatterers. In order to prove that the insensibility of integer order spot intensities against the structural transition is not just a matter of the chosen energy we compare in Fig. 6(e) the -spectra of 31 and 11 phases on Ir(100). The perfect coincidence of the curves is a strong indication that only the long-range order has got lost, while the elemental distribution within the layers must have been preserved, a conclusion which will be quantitatively proven by a LEED analysis discussed in Section IV.2. Thus, after the annealing step we still have an Ir2Co surface alloy as the outermost layer, but now it is disordered. Only for quite high temperatures ( 1000 K) Co starts to dissolve into the bulk (driven by entropy). With the finding of a random alloy confined to the top layer one would expect to see just two different species in the atomically resolved STM images, which is obviously not the case. This might be due to a pronounced ligand effect, i.e. the apparent (or even the true) height of the atoms is strongly affected by the local chemical environment of the respective atom. Finally, it should be noted that also the disordered surface alloy can be re-oxidized (and by this re-ordered) into the 31-CoO2 phase, though perfect ordering requires somewhat higher temperatures compared to when starting with the ordered surface alloy. We observed that even those Co atoms which had dissolved deeply below the surface upon high temperature annealing will re-segregate and react during oxygen annealing towards the 31-CoO2 phase.
On Pt(100) the reduction of the CoO2 chain phase by H2 proceeds practically identically to Ir(100) as long as the temperature is low enough to have hydrogen adsorbed on the surface ( 400 K). Only the ubiquitous presence of adatom islands limits the degree of achievable order as it was already the case for the regular chain phase. Again, the intensity spectra of the LEED beams change dramatically and similar to Ir(100) [Fig. 4(d)], indicative of an analogous rearrangement of Co chains upon complete reduction.
The 31 alloy phase on Pt(100) also disorders into a 11 phase as can be seen in Fig. 6(d), but already at a temperature of 420 K, which is 150 K lower than for Ir(100). In this case the disordering of the surface alloy occurs in parallel to the desorption of hydrogen. This can be interpreted that on the Pt(100) surface adsorbed hydrogen is required to stabilize the 31 order of the reduced phase. As a consequence no hydrogen-free 31 alloy phase can be prepared on Pt(100). Another qualitative difference to Ir(100) is the substantial change of intensities of integer order spots during the order-disorder transition [cf. Fig. 6(f)]. Although the concomitant desorption of hydrogen would account for some moderate spectral variations also of the integer order spots, the observed alterations of the spectra appear by far too large for that. Instead, a more substantial atomic rearrangement at the surface has to be expected as will be proven in the next subsection.
Finally, the re-oxidation by oxygen exposure from both the H-covered ordered and the clean disordered alloy phase proceeds on Pt(100) as easily as on Ir(100). So, this system can indeed serve as a Co/Pt(100) based model catalyst for various kinds of redox reactions.
IV.2 Crystallographic Analysis of the Reduced Phases
In order to obtain more insight into the crystallographic structure of the reduced phases we have performed full-dynamical LEED analyses for the clean alloy phases on Ir(100) and Pt(100). The LEED analyses of the H-covered 31 alloy phases including the associated extended discussion of the H adsorption site(s) are postponed to a later publication Ferstl et al. . Without revealing all details, the H-covered phases are found to be – as expected – 31 ordered Ir2Co or Pt2Co surface alloys for both Ir(100) and Pt(100).
For the clean 31 alloy phase on Ir(100) there is only one reasonable structural model, for which bestfit parameters have to be determined: An arrangement of Co rows with threefold mutual distance assuming substitutional sites within the topmost layer of the Ir(100) substrate. For this phase we collected -spectra of 35 inequivalent beams in total yielding a huge cumulated data base of 13.8 keV in total, which safely allowed the determination of 18 structural parameters down to the 6th layer as well as of the vibrational amplitudes of Co and Ir atoms within the top layer (redundancy factor 25). Eventually a very low bestfit Pendry R-factor of 0.096 was reached by the fit, quantifying numerically the close correspondence of experimental and calculated bestfit -spectra displayed in Fig. 7(a). This excellent level of agreement leaves no room for doubts about the correctness of the underlying structural model. All details of the LEED analysis including original -data files can be found in the Supplemental Materials Sup .
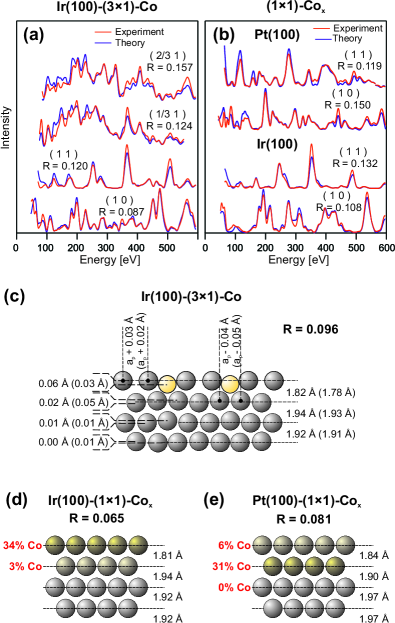
The structural results obtained for the Ir(100)-31-Co phase are summarized in the ball model of Fig. 7(c). We find the Co atoms being located 0.06 Å below the level of the first layer Ir atoms corresponding to the smaller atomic size of Co compared to Ir. The top layer Ir atoms remain laterally almost at bulk position (0.01 Å deviation towards the Co atoms) with a distance to the second layer Ir atoms also close to the distance found for a pure unreconstructed Ir(100)-11 surface Schmidt et al. (2002). This very moderate interaction of Co with the Ir substrate is also found within the second layer, where Ir atoms move laterally and vertically by only 0.02 Å towards the Co atom, when directly attached to it. Consequently, no significant atomic deviations from bulk position can be found in deeper layers. As for the analyses of the oxide chain phases the structural parameters predicted by DFT coincide with the LEED results similarly well [cf. Fig. 7(c)] with a mean square deviation below 2.1 pm on average. These deviations are of the order of the error margins for the structural parameters determined by the LEED analysis, which are tabulated in the Supplemental Materials Sup .
Despite the close resemblance of integer order -spectra between the ordered 31-Co and the random 11-Cox phases we have also performed an independent LEED structure analysis for the latter phase. In these calculations we treated the random elemental distribution within the outermost layer(s) by using the average t-matrix approximation Gauthier et al. (1985); Baudoing et al. (1986) and allowed thereby also for element-specific positions, which is only possible within the TensorLEED scheme Heinz et al. (1996). By this we also retrieve error margins for the layer-resolved concentration of Co atoms. The analysis achieved a bestfit Pendry R-factor as low as 0.065 and hence a very good fitting of the -spectra [cf. Fig. 7(b) lower part]. It reveals numerical values for the Co concentration within the outermost layer of 34% and 3% in the second layer with errors of about 4%. This is a quantitative proof that the irreversible chemical disordering of the 31-Co phase upon annealing is indeed restricted to the top layer. As expected, the geometrical parameters retrieved by this analysis coincide very closely with those of the 31-Co phase as seen from a comparison of parameter values given in Figs. 7(c) and (d). The buckling and pairing amplitudes of Ir atoms, which will occur only locally within the random alloy, are reflected by correspondingly enhanced vibrational amplitudes derived by the fit (see Supplemental Materials Sup ).
For the random 11 alloy phase on Pt(100) we performed the very same type of LEED intensity calculation and also achieved an excellent fit quality [c.f. Fig. 7(b) upper part] expressed by a Pendry R-factor of R = 0.083 in this case. Surprisingly, in contrast to Ir(100) the fit for this system reveals that most of the Co atoms have left the topmost Pt layer where they were located in the ordered H-covered 31 phase. Instead, they now assume substitutional subsurface sites exclusively within the second Pt layer, i.e. without segregating deeper into the bulk. The bestfit values for the Co concentration of the outermost three layers are c1 = 6%, c2 = 31%, and c3 = 0% with error margins of about 4%. For the Co atoms within the top layer we found a pronounced parameter coupling between concentration and vibrational amplitude leading to unphysical numbers of the fit. We therefore fixed the amplitude of the Co vibration to 0.10 Å, which is close to the values derived in the LEED analyses for the other surface alloys. The chemically mixed second layer will of course impose substantial local geometrical relaxations. In this sense the layer distances derived by the fit have to be regarded as averages over various local configurations. Consistent with the embedding of smaller Co atoms into the second layer both the first and second (average) layer distance is strongly reduced [c.f. Fig. 7(d)], while deeper layer spacings are (consistently) rather bulk-like.
A comparable sandwich-like concentration profile, where Co atoms are (mostly) covered by Pt, has already been found in studies of the segregation at PtxCo1-x bulk alloy surfaces Gauthier (1996); Gauthier et al. (1998). Even more, it was recently found that Co in Pt-Co nanoparticles segregates to the surface when oxidized but migrates completely back into the particle’s core after reduction in a H2 atmosphere Xin et al. (2014). Eventually, the particles are found to be coated by a complete Pt monolayer with another pure layer of Co below, which is very close to our findings and demonstrates the value of the extended surfaces as a model for nanodisperse catalysts.
V Higher Oxidation State of Cobalt Oxide Chains achieved by NO2 Dissociation
The CoO2 chain phase as described in Sect. III cannot be oxidized further by exposure to O2 due to an activation barrier for O2 dissociation unsurmountable under UHV conditions. This can be circumvented using either atomic oxygen or an oxidant with smaller dissociation barrier like NO2.
We cooled the regular CoO2 chain phase from 900 K down to room temperature in 10-6 mbar NO2. After a further flash to 450 K in order to remove any remaining NO contaminants the LEED pattern again showed a well-ordered 31 superstructure, as seen in Fig. 8(a), but with significantly altered spot intensities. A comparison of -spectra taken for this new phase with those for the former CoO2 chain phase [displayed for two beams in Fig. 8(b)] gives R-factor values around 1, i.e. the spectra are statistically independent. Atomically resolved STM images from this phase shown in Fig. 8(c) look virtually the same as for the regular oxide chain phase [cf. Fig. 2(c)]. Even the apparent STM corrugation of the Co rows – a quantity which depends quite a lot on the actual tip and tunneling conditions – turns out to be at least in the same range. Careful heating of the new phase to 870 K in UHV leads to oxygen desorption and by that to a restoration of the regular chain phase as seen by the respectively changed LEED intensities. Unfortunately, the exact amount of oxygen released in this process could not be quantified so far. Nevertheless, this experiment can be taken as a proof that the new phase contains indeed more oxygen than the regular CoO2 chain phase. This 31 phase can also be reduced by hydrogen in the same temperature regime as the regular oxide chain phase. Here, the reduction process directly leads to the fully reduced 31-Co alloy state without passing through the state of the CoO2 chain phase.
For the Pt(100) substrate we have tried the same preparation recipe at various sample temperatures and pressures for NO2 exposure. However, all attempts ended in the regular CoO2 chain phase, which is obtained already by annealing in O2. The reason for this failure will be explained in Section VI. In the following we thus concentrate on the crystallographic structure of the oxygen-rich 31 phase on Ir(100), which is experimentally accessible.
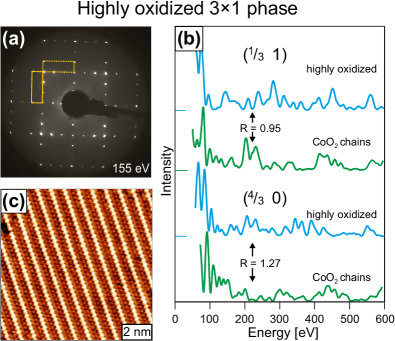
With this little pre-information about the structure of the new phase there are a number of qualitatively different structural models conceivable, which all have to be tested by independent LEED -fits. In one class of models additional oxygen could simply occupy bridge or hollow sites on the Ir rows between the normal CoO2 chains. In a second class of models higher oxidized Co chains have been tested, i.e. with CoO3 chains having the extra oxygen atom in various positions either above or below the Co atom or even CoO4 chains, where every Co is enclosed by an oxygen octahedron. Of course combinations of both classes are also possible as well as lateral and vertical shifts of the oxide chains relative to the substrate atoms. It turned out that in a rough search all tested models (a compilation of the 10 principally different models under investigation is given in the Supplemental Material Sup ) produced Pendry R-factors around 0.5 or even above except one model, which gave 0.30 and in a further step of refinement already a value as low as 0.15. This model is quite similar to the one for the regular CoO2 chains, but has an additional oxygen right below each Co atom. We thus have highly oxidized CoO3 oxide chains at the surface with the Co core still exposed to the vacuum (truncated octahedron, see Fig. 9). In top view such a model exactly resembles that of the CoO2 chain phase, since the extra oxygen is completely hidden by the Co atom above. This easily explains the identical STM appearance of both phases, which would otherwise be hard to understand at least for most of the tested models.
With this starting point we concentrated on the further refinement of our model. It turned out that an additional but partial occupation of Ir hollow sites (30%) by coadsorbed oxygen brings the R-factor further down to about 0.12, while the inclusion of oxygen at Ir bridge sites or adsorbed NO led to an increase of the R-factor level. With a final fine-tuning of structural and non-structural parameters of the analysis we eventually achieved a bestfit R-factor of 0.099 derived for a cumulated data base of about 20 keV, which is among the largest ones ever used for a LEED analysis so far. The again excellent agreement of experimental and calculated beams is visualized in Fig. 9(a) and a ball model in side view is displayed in Fig. 9(b) with most of the structural parameters introduced. In brackets we provide the respective values from a fully relaxed DFT structure, which was calculated for a 32 cell with one oxygen atom in Ir hollow site position, corresponding to a 50% partial coverage at this site in slight contrast to the 3014% derived from the LEED analysis. As for the other phases we find a very close correspondence of parameter values expressed by a rms deviation of 0.020 Å only. For completion we have also performed a DFT model calculation for a 31-CoO3 phase without coadsorbed oxygen, which is provided together with all other information on this structure determination in the Supplemental Material Sup . The latter calculation reveals very similar parameter values as obtained in the case of coadsorbed oxygen except for the buckling amplitude of the 2nd Ir layer, where a pronounced 0.06 Å corrugation is predicted. Since such a buckling is clearly absent in experiment – the statistical error of the LEED analysis is below 0.01 Å for this parameter – we can take this finding as an independent proof for the existence of the extra hollow site oxygen.
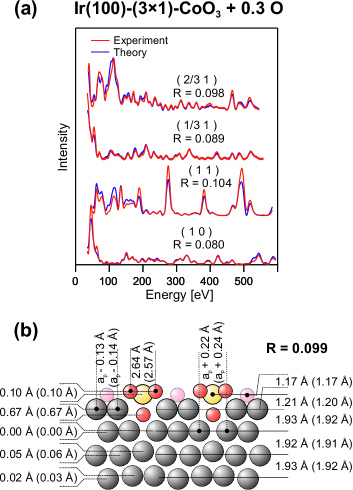
Turning now to the configuration of the CoO3 chains we see that the oxygen atoms embedded in the troughs of the substrate’s missing row structure lift the Co atoms located right above by 0.29 Å almost to the height level of the adjacent oxygen rows. Therefore, virtually the same O-Co bond lengths result for all oxygen atoms of the oxide chain (1.88 Å and 1.89 Å) justifying its assignment as a chain of truncated octahedra. This chain is embedded in the surface such that also very similar O-Ir bond lengths result with 1.93 Å and 1.96 Å for the low and high lying oxygen atoms, respectively. This binding induces severe distortions within the substrate by pushing all adjacent Ir atoms apart, which leads via elastic response to statistically significant atomic displacements down to the 4th layer. In contrast to the CoO2 chains the highly oxidized CoO3 chains are now 3-dimensionally linked to the substrate, which is also expressed by the now strongly reduced vibrational amplitude of the central Co atoms (0.09 Å vs. 0.16 Å).
VI Energetics of the cobalt oxide chain phases
So far the DFT calculations for the various systems were used only as independent support for the structural models retrieved by the LEED analyses. In this final section we focus on the energetics of oxygen adsorption derived from DFT modeling as well as the magnetism of the monatomic wires in the various phases.
One key quantity for understanding the adsorption behavior is the binding energy of the adsorbate, here oxygen, at a particular site (configuration ) with respect to a given reference state of the surface. We calculate the oxygen binding energy according to
| (1) |
for adsorption with respect to molecular oxygen. and are the total slab energies of the adsorbate structure of interest and of the reference surface configuration. is the number of oxygen atoms by which the two configurations differ and denotes the DFT energy of an oxygen molecule in its triplet ground-state. The binding energy is thus defined positive for exothermic adsorption.
The initial formation of the mixed Ir2Co top layer is a strongly activated process, which hardly can be understood on the basis of mere energetic considerations. We thus take a clean and ordered 31-Co alloy phase as reference system and therefore concentrate in the following on the Ir(100) substrate, where such a phase is known to be stable. From experiment we also know that the oxidation of this phase occurs already close to room temperature and hence all activation barriers should be small, except the one for O2 dissociation which, however, can be circumvented via NO2 dissociation. In order to determine which adsorption site will be occupied first by incoming oxygen we calculated its binding energies in the CoO2 chain phase (which is found in experiment) as well as for bridge or hollow sites between the two Ir rows for half and full occupation, i.e. by assuming either all sites or only every second one in a 32 cell (Table 1 top). As for the bare Ir(100)-11 surface the Ir bridge site is energetically preferred over hollow site adsorption and there is also a clear preference for nearest neighbor site occupation (0.11 eV energy gain per oxygen) leading to oxygen chain formation Ferstl et al. (2016b). In contrast, the Ir hollow site shows an enormous nearest neighbor repulsion leading to a 0.42 eV reduction of the binding energy, when filling up all sites. The energetically by far most favourite site, however, is the CoO2 chain phase, 0.30 eV superior to the Ir bridge site. This means that oxygen will exclusively be accommodated within the cobalt oxide chains until the 31-CoO2 phase is completed.
| oxygen adsorption site | [eV] wrt 31-Co |
|---|---|
| CoO2 chain | 2.256 |
| center Ir bridge site | 1.961 |
| center Ir hollow site | 1.379 |
| center Ir bridge site half-filled | 1.849 |
| center Ir hollow site half-filled | 1.799 |
| [eV] wrt 31-CoO2 | |
| CoO3 chain | 1.191 |
| center Ir bridge site | 1.154 |
| center Ir hollow site | 0.626 |
| CoO3 chain half filled | 1.014 |
| center Ir bridge site half-filled | 1.084 |
| center Ir hollow site half-filled | 1.100 |
| [eV] wrt 31-CoO3 | |
| center Ir bridge site | 1.142 |
| center Ir hollow site | 0.692 |
| center Ir bridge site half-filled | 1.047 |
| center Ir hollow site half-filled | 0.983 |
In order to test the further course of oxygen adsorption we now reference the binding energy with respect to an already completed CoO2 chain phase (center of Table 1) and by that we determine the effective binding energy for further oxygen being adsorbed at the surface. We again compare the energetics of adsorption sites on the Ir rows with the site right below the Co atoms, which essentially is the CoO3 phase. For full coverage of the respective sites, i.e. at a total oxygen coverage of 1, we see that all binding energies for the newly coming oxygen have roughly halved now. This explains why careful heating of the highly oxidized phase can reestablish the CoO2 phase, because the extra oxygen is much weaker bound and thus desorbs at significantly lower temperatures. Also the energetic difference between the CoO3 chain site and the next favorable Ir bridge position has vastly diminished to 0.04 eV, which is of the order of at typical reaction temperatures. So there is no more a pronounced gradient in energy steering the occupation of one particular site. Moreover, since there is no obvious entrance channel for oxygen into the subsurface sites below the Co atoms a significant activation barrier has to be expected for the occupation of these energetically slightly favoured sites. Conceivable is either an oxygen insertion at chain defects and subsequent subsurface migration or a site switch from upper chain oxygen into the subsurface site with concerted re-filling from Ir bridge sites.
The situation becomes more complicated for smaller coverages like e.g. 0.83, when only every second of the investigated sites is occupied. Not unexpected, a half-filled CoO3 chain is energetically less favorable, since the equilibrium positions of Co atoms in local CoO2 and CoO3 configuration are vertically far apart from each other (about 0.3 Å), which will lead to enormous stress within such a buckled chain. As a consequence the CoO2 to CoO3 transformation will preferably proceed for extended chain pieces as a whole. This points towards an exchange process, which could act in a zipper-like mechanism, rather than to subsurface migration from chain defects. More surprising, however, comes the enormous energy gain for the half-filled hollow site arrangement, even larger than for the alloy phase despite the largely reduced absolute values of the binding energies. This together with some energy loss of the bridge site makes both Ir sites practically degenerate in energy. However, since both site energies are still lower than the one for fully covered bridge sites we have to expect oxygen nucleation towards adatom chains. Regarding the vast increase of binding energy with decreasing occupation of the hollow sites (0.47 eV difference between half- and fully filled), it appears at least conceivable that this trend further continues, so that for lower coverages a dilute occupation of hollow sites might indeed be able to compete with bridge site nucleation or even with sites in the CoO3 chains.
Qualitatively the same scenario is found for the Ir site occupation in case of a fully developed CoO3 chain phase (lower part of Table 1) and even the resulting binding energies (now referenced to the completed CoO3 chain phase) are rather close to the case of the CoO2 phase. This means that the binding energy of oxygen on Ir sites is hardly affected by the occupation of subsurface sites nearby. As a consequence the whole oxidation process of the CoO2 phase can be regarded as a more or less continuous uptake of oxygen from the gas phase into the Ir sites, from where it gradually but in a block-wise manner fills up the subsurface sites. Eventually, this process should end in a complete CoO3 phase with all central Ir bridge sites occupied as well. This contrasts with the result of our LEED analysis, which finds completed CoO3 chains but only 30% of Ir hollow sites occupied. An explanation comes by coadsorbed NO molecules evolving in the NO2 dissociation process. In later stages of the cool-down process these molecules will not instantaneously desorb from the surface and thus block adsorption sites for oxygen. With the final flash in UHV the NO then desorbs leaving an incompletely filled surface behind. The oxygen atoms remaining at Ir sites do obviously not nucleate towards bridge-bonded adatom chains but spread out and occupy hollow sites, which is a corroboration of an enhanced stabilization of this site for smaller coverages as discussed above.
Regarding the magnetism of the Co wires in the different chain phases on Ir(100) our calculations find that they are not only ferromagnetic in the metallic state of the ordered alloy phase, but also as CoO2 and CoO3 chains though with decreasing preference over the anti-ferromagnetic state: 47 meV, 25 meV, and 6 meV for the Co, CoO2, and CoO3 chains.
For the oxidation of Co/Pt(100) we did not perform a similarly extended analysis as for the Co/Ir(100) system, since both the clean ordered alloy and the highly oxidized states were not accessible in experiment. We only calculated the oxygen binding energies for the pure CoO2 and CoO3 chain phases, referenced as before to the (here non-existing) ordered 31-Co or to the CoO2 phase, respectively, without considering any oxygen co-adsorption on Pt sites. (The corresponding structural parameters of these phases are tabulated in the Supplemental Materials Sup ). The retrieved binding energies turned out to be significantly smaller for Pt(100) compared to Ir(100). For the 31-CoO2 phase we obtained = 2.014 eV (Ir: 2.256 eV) and for the fully oxidized CoO3 chains a value of = 0.632 eV (Ir: 1.191 eV) resulted for the additional oxygen atom. In contrast to the CoOx chains on Ir(100) the calculations predict an anti-ferromagnetic ground state for both CoO2 and CoO3 chains on Pt(100).
The lower effective binding energy found for the additional atom in the CoO3 chain in case of Pt(100) also provides the key to understanding why we could not prepare this phase under our experimental conditions. From the binding energies of the different phases we can calculate the Gibbs free surface energy (with respect to the clean 31-Co surface alloy) according to
| (2) |
with being the number of oxygen atoms in the units cell of area A and the chemical potential of oxygen depending on oxygen pressure and temperature (Refs. Reuter and Scheffler, 2001; Rogal and Reuter, 2007):
| (3) |
The reference state for the chemical potential was interpolated from Table 1 in Ref. Reuter and Scheffler, 2001, the reference pressure was taken as 1 bar and denotes the Boltzmann constant.
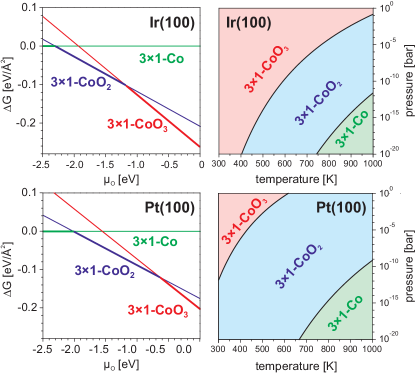
Comparing the phase stability for both substrates (Fig. 10, left side) we see that for the Pt(100) surface a higher chemical potential of oxygen than on Ir(100) is required to stabilize both the CoO2 and in particular the CoO3 phase explaining the experimentally observed differences in the phase formation. Transferring the respective stability ranges into the - diagrams displayed at the right side of Fig. 10 we see that on Ir(100) the CoO3 chains are predicted to be stable under UHV conditions even for rather high temperatures up to about 550 K. It also shows a wide temperature window above, where the CoO2 phase is stable in accordance with the experimental finding that it can be re-established simply by heating from the highly oxidized state. On the Pt(100) surface, in contrast, oxygen pressures in the millibar regime would be necessary to stabilize the CoO3 phase at temperatures above 450 K, which are needed to surmount activation barriers in the formation process. So, even in case that such CoO3 chains could be formed in the NO2 atmosphere of our experiments, they would immediately decay during pump-down of the reaction gas. However, at more ambient pressures as e.g. under the conditions of realistic catalytic processes the highly oxidized CoO3 chains are predicted to occur on Pt(100) as well. The CoO2 phase on the other hand is stable under UHV also on Pt(100), though only up to less high temperatures than on Ir(100) again in correspondence to the different stability regimes found in experiment.
VII Conclusions
In conclusion we demonstrated the formation of strictly periodic, high-density Co nanostructures with variable numbers of oxygen atoms bound to Co supported on Ir(100) or Pt(100). Starting from monatomic CoO2 chains in a 31 periodicity that were investigated previously on Ir(100) and shown here also to exist on Pt(100), we obtained a purely metallic alloy after reduction with hydrogen. In the case of Ir(100) the alloy is well-ordered with the same periodicity and stable up to almost 600 K while on Pt(100) the alloy is ordered only in the presence of hydrogen and disorders above 420 K. The transition from CoO2 to Co chains is reversible in an oxygen atmosphere, the well-ordered CoO2 chains reappear with high structural order from 350 K onwards. Alternatively, the CoO2 chains can be converted on Ir(100) to CoO3 chains under UHV conditions using NO2 as an oxidizing agent.
All structures appearing were characterized in a crystallographic sense with LEED intensity analyses to high accuracy with Pendry R-factors below R = 0.10 and errors in the structural parameters of a few picometers. The structures were independently confirmed by DFT calculations with perfect agreement between parameters also in the pm range. To gain further insight into the energetics of the formation of these structures, our DFT calculations show that the CoO2 and CoO3 oxide chains are indeed preferred over configurations where additional oxygen is adsorbed on Pt or Ir sites of the respective structure with lower oxygen content. According to our DFT calculations the CoO3 phase is also stable on Pt(100) however only at pressures in the millibar regime at reaction temperatures. The calculations also reveal interesting magnetic properties of the chain structures as function of substrate and oxygen content. While the clean metal alloy phases are predicted to be ferromagnetically ordered on Ir(100) and Pt(100), the CoO2 and CoO3 phases are ferromagnetic on Ir and anti-ferromagnetic on Pt. With this work we therefore provide well characterized model systems for further experiments in heterogeneous catalysis, in low-dimensional magnetism, and generally for experiments with low-dimensional metal/metal-oxide nanostructures.
This work was supported by the Austrian Science Fund (Project No. 45, Functional Oxide Surfaces and Interfaces, FOXSI) and the Deutsche Forschungsgemeinschaft (Research Unit FOR 1878 “funCOS” and the DACH project “COMCAT”). We also thank the Vienna Scientific Cluster (VSC) for generous supply of CPU time.
References
- Ertl et al. (1997) G. Ertl, H. Knözinger, and J. Weitkamp, Handbook of Heterogeneous Catalysis, 4 (VCH, 1997).
- Fu et al. (2013) Q. Fu, F. Yang, and X. Bao, Acc. Chem. Res. 46, 1692 (2013).
- Rodriguez et al. (2007) J. A. Rodriguez, S. Ma, P. Liu, J. Hrbek, J. Evans, and M. Pérez, Science 318, 1757 (2007).
- Boffa et al. (1994) A. Boffa, C. Lin, A. Bell, and G. Somorjai, J. Catal. 149, 149 (1994).
- Ge et al. (2016) H. Ge, B. Zhang, X. Gu, H. Liang, H. Yang, Z. Gao, J. Wang, and Y. Qin, Angew. Chem. Int. Ed. 55, 7081 (2016).
- Yamada et al. (2011) Y. Yamada, C.-K. Tsung, W. Huang, Z. Huo, S. E. Habas, T. Soejima, C. E. Aliaga, G. A. Somorjai, and P. Yang, Nat. Chem. 3, 372 (2011).
- Wu and Yang (2013) J. Wu and H. Yang, Acc. Chem. Res. 46, 1848 (2013).
- Guo et al. (2016) S. Guo, X. Zhang, X. Shen, D. Su, G. Lu, X. Zhu, J. Yao, J. Guo, and X. Huang, Nat. Commun. 7, 11850 (2016).
- Xin et al. (2014) H. L. Xin, S. Alayoglu, R. Tao, A. Genc, C.-M. Wang, L. Kovarik, E. A. Stach, L.-W. Wang, M. Salmeron, G. A. Somorjai, and H. Zheng, Nano Lett. 14, 3203 (2014).
- Ferstl et al. (2016a) P. Ferstl, L. Hammer, C. Sobel, M. Gubo, K. Heinz, M. A. Schneider, F. Mittendorfer, and J. Redinger, Phys. Rev. Lett. 117, 046101 (2016a).
- Surnev et al. (2010) S. Surnev, F. Allegretti, G. Parteder, T. Franz, F. Mittendorfer, J. N. Andersen, and F. P. Netzer, ChemPhysChem 11, 2506 (2010).
- Li et al. (2010) F. Li, F. Allegretti, S. Surnev, and F. P. Netzer, Langmuir 26, 16474 (2010).
- Ma et al. (2013) L.-Y. Ma, A. Picone, M. Wagner, S. Surnev, G. Barcaro, A. Fortunelli, and F. P. Netzer, J. Phys. Chem. C 117, 18464 (2013).
- Opheys (2011) M. F. Opheys, “http://www.ee2000.de,” (2011).
- Blum and Heinz (2001) V. Blum and K. Heinz, Comput. Phys. Commun. 134, 392 (2001).
- Heinz (1995) K. Heinz, Rep. Prog. Phys. 58, 637 (1995).
- Rous et al. (1986) P. J. Rous, J. B. Pendry, D. K. Saldin, K. Heinz, K. Müller, and N. Bickel, Phys. Rev. Lett. 57, 2951 (1986).
- Rundgren (2003) J. Rundgren, Phys. Rev. B 68, 125405 (2003).
- Arblaster (2010) J. W. Arblaster, Platin. Met. Rev. 54, 93 (2010).
- Arblaster (1997) J. W. Arblaster, Platin. Met. Rev. 41, 12 (1997).
- van Hove and Tong (1979) M. A. van Hove and S. Y. Tong, Surface Crystallography by LEED: Theory, Computation, and Structural Results (Springer, 1979).
- Arblaster (1996) J. W. Arblaster, Platin. Met. Rev. 40, 62 (1996).
- (23) See Supplemental Material at http://link.aps.org/supplemental/10.1103/PhysRevLett.117.046101, for the tabulated bestfit values including the error margins of the LEED analyses for the various phases and graphs comprising all experimental and best-fit LEED spectra. Also experimental data files are made available for all phases.
- Pendry (1980) J. B. Pendry, J. Phys. C 13, 937 (1980).
- Kresse and Hafner (1993) G. Kresse and J. Hafner, Phys. Rev. B 47, 558 (1993).
- Kresse and Furthmüller (1996) G. Kresse and J. Furthmüller, Comput. Mater. Sci. 6, 15 (1996).
- Blöchl (1994) P. E. Blöchl, Phys. Rev. B 50, 17953 (1994).
- Kresse and Joubert (1999) G. Kresse and D. Joubert, Phys. Rev. B 59, 1758 (1999).
- Perdew et al. (1996) J. P. Perdew, K. Burke, and M. Ernzerhof, Phys. Rev. Lett. 77, 3865 (1996).
- Dudarev et al. (1998) S. L. Dudarev, G. A. Botton, S. Y. Savrasov, C. J. Humphreys, and A. P. Sutton, Phys. Rev. B 57, 1505 (1998).
- Van Hove et al. (1981) M. Van Hove, R. Koestner, P. Stair, J. Biberian, L. Kesmodel, I. Bartos, and G. Somorjai, Surf. Sci. 103, 218 (1981).
- Schmidt et al. (2002) A. Schmidt, W. Meier, L. Hammer, and K. Heinz, J. Phys.: Cond. Matt. 14, 12353 (2002).
- Samsonov (2012) G. Samsonov, Handbook of the Physicochemical Properties of the Elements (Springer, 2012).
- Giovanardi et al. (2008) C. Giovanardi, A. Klein, A. Schmidt, L. Hammer, and K. Heinz, Phys. Rev. B 78, 205416 (2008).
- Heinz and Hammer (2009) K. Heinz and L. Hammer, Prog. Surf. Sci. 84, 2 (2009).
- (36) P. Ferstl, M. Arman, J. Knudsen, E. Lundgren, F. Mittendorfer, J. Redinger, M. Schneider, and L. Hammer, To be published.
- Gauthier et al. (1985) Y. Gauthier, Y. Joly, R. Baudoing, and J. Rundgren, Phys. Rev. B 31, 6216 (1985).
- Baudoing et al. (1986) R. Baudoing, Y. Gauthier, M. Lundberg, and J. Rundgren, J. Phys. C 19, 2825 (1986).
- Heinz et al. (1996) K. Heinz, R. Döll, and M. Kottcke, Surf. Rev. Lett. 3, 1651 (1996).
- Gauthier (1996) Y. Gauthier, Surf. Rev. Lett. 3, 1663 (1996).
- Gauthier et al. (1998) Y. Gauthier, P. Dolle, R. Baudoing-Savois, W. Hebenstreit, E. Platzgummer, M. Schmid, and P. Varga, Surf. Sci. 396, 137 (1998).
- Ferstl et al. (2016b) P. Ferstl, T. Schmitt, M. A. Schneider, L. Hammer, A. Michl, and S. Müller, Phys. Rev. B 93, 235406 (2016b).
- Reuter and Scheffler (2001) K. Reuter and M. Scheffler, Phys. Rev. B 65, 035406 (2001).
- Rogal and Reuter (2007) J. Rogal and K. Reuter, in VT-142 RTO AVT/VKI Lecture Series (NATO Research and Technology Organisation, 2007) pp. 2–1.