Ferromagnetic spin fluctuations in the filled skutterudite SrFe4As12 revealed by 75As NMR-NQR measurements
Abstract
75As nuclear magnetic resonance (NMR) and nuclear quadrupole resonance (NQR) measurements have been carried out to investigate the magnetic and electronic properties of the filled skutterudite metallic compound SrFe4As12. The temperature dependence of Knight shift determined by the NQR spectrum under a small magnetic field ( 0.5 T) shows the similar temperature dependence of the magnetic susceptibility which exhibits a broad maximum at 50 K. The nuclear spin-lattice relaxation rate divided by temperature, 1/, increases with decreasing temperature and exhibits a broad maximum at 70 K, similar to the case of . The temperature dependence of and is reasonably explained by a simple model where we assume a concave-shaped band structure near the Fermi energy. Based on a Korringa ratio analysis using the and data, ferromagnetic spin fluctuations are found to exist in SrFe4As12. These results indicate that SrFe4As12 can be characterized to be a metal with ferromagnetic correlations and also the peculiar band structure responsible for the suppression of and at low temperatures.
I I. Introduction
The investigation of physical properties of filled skutterudite-structure compounds has a long history which started with the discovery of LaFe4P12 by Jeitschiko et al. in 1977 Jeitschko1977 . The compound crystallizes in a body-centered cubic structure with the space group , and is now known to have a wide variety of compounds with the general formula ( = alkali metal, alkaline earth metal, lanthanide, and actinide; = Fe, Ru, Os, Co, Rh, Ir, and Pt; = P, As, Sb, and Ge). These compounds have received much attention since they exhibit rich physical properties that include superconductivity, metal-insulator transition, ferromagnetism, antiferromagnetism, hybridization gaps (Kondo insulator behavior), nonfermi-liquid behavior, quadrupolar ordering, and field-induced heavy-fermion states Sales2005 ; Shirotani1997 ; Sekine1998 ; Leithe-Jasper2003 ; Schnelle2008 ; Ishida2005 ; Matsuoka2005 ; Matsumura2005 ; Nakai2005 ; Matsumura20071 ; Shimizu2007 ; Tou2011 ; Magishi2014 ; Kawamura2018 , as well as excellent thermoelectric properties Sales1996 .
These intriguing physical phenomena are mainly owing to electrons in rare-earth or electrons in transition metals hybridized with electrons of elements, as well as the characteristic cage structure in the compounds. Many studies in rare-earth-filled skutterudite compounds have been carried out to investigate the role of the -electrons on physical properties. Instead, few studies on electron systems have been performed so far. Most studies on electron systems focus on iron-antimony filled skutteudite compounds Fe4Sb12 and found the interesting magnetic properties which largely depend on the number of valence electrons of the ions. In the case of = monovalent Na and K ions, a weak ferromagnetism with a Cuire temperature of = 85 K has been observed Leithe-Jasper2003 ; Leithe-Jasper2004 , while no magnetic order has been reported for the case of divalent alkaline-earth ions such as Ca, Sr, and Ba, where ferromagnetic spin fluctuations are considered to play an important role Schnelle2005 ; Schnelle2008 ; K . On the other hand, the importance of antiferromagnetic spin fluctuations are pointed out in the trivalent ion system of LaFe4Sb12 Schnelle2008 ; Gippius2006 . Although it would be important to systematically study these physical properties of electron systems by changing ions such as P and As for further deep understandings of the role of electrons, not much studies have been carried out because of the difficulty in preparing those compounds.
Recently, new filled-skutterudite arsenide compounds SrAs12 ( = Fe, Ru, Os) have been synthesized using a high-pressure synthesis technique Nishine2017 , which provides a new opportunity of systematic studies of the role of electrons with different ions as well as the effects from the different electron of 3, 4 and 5. For 5 electron system, SrOs4As12 was found to be a new superconductor with a transition temperature of = 4.8 K Nishine2017 . For 3 and 4 electron systems, on the other hand, SrFe4As12 and SrRu4As12 do not exhibit superconductivity down to 2 K, although the electrical resistivities show metallic behavior Nishine2017 . As for the magnetic properties for 3 systems, comparative studies have been performed. The static magnetic susceptibility of the isostructural compound BaFe4As12 shows a broad maximum at 50 K. Above , follows the Curie-Weiss (CW) law with an effective magnetic moment of 1.46 /Fe and a negative Weiss temperature of -57 K Sekine2015 . Together with the observation of a large Sommerfeld coefficient of the electronic specific heat ( = 62 mJ mol-1K-2), Sekine suggested that BaFe4As12 is a nearly ferromagnetic metal Sekine2015 . On the other hand, in the case of SrFe4As12, although the static magnetic susceptibility exhibits a broad maximu at 50 K and follows the CW law with = 1.36 /Fe very similar to the case of BaFe4As12, the positive Weiss temperature of 36 K has been reported, indicating a different magnetic spin correlations in comparison with the case of BaFe4As12. A large = 58 mJ mol-1K-2 is also observed in SrFe4As12 which suggests strong electron correlation effects, as well as the case of BaFe4As12.
Motivated by the reported interesting magnetic properties in SrFe4As12, we have carried out nuclear magnetic resonance (NMR) and nuclear quadrupole resonance (NQR) measurements which are powerful techniques to investigate the magnetic and electronic properties of materials from a microscopic point of view. It is known that the temperature dependence of the nuclear spin-lattice relaxation rate (1/) reflects the wave vector -summed dynamical susceptibility. On the other hand, NMR spectrum measurements, in particular the Knight shift , give us information on static magnetic susceptibility . Thus from the temperature dependence of 1/ and , one can obtain valuable insights about magnetic fluctuations in materials. In this paper, we report the results of 75As NMR and NQR measurements performed for investigating the spin fluctuations in SrFe4As12. Our analysis, based on the modified Korringa relation, reveals electron correlations enhanced around ferromagnetic (FM) wavenumber = 0 in SrFe4As12. The characteristic temperature dependence of and 1/ was reasonably explained by a simple model where a concave-shaped band structure near the Fermi energy is assumed.
II II. Experimental
Polycrystalline SrFe4As12 samples were prepared at high temperatures and high pressures using a Kawai-type double-stage multianvil high-pressure apparatus Nishine2017 . NMR and NQR measurements of 75As ( = , = 7.2919 MHz/T, 0.29 barns) nuclei were conducted using a lab-built phase-coherent spin-echo pulse spectrometer. The 75As-NMR spectra were obtained by sweeping the magnetic field at a fixed frequency = 37 MHz, while 75As-NQR spectra were measured in steps of frequency by measuring the intensity of the Hahn spin echo. The 75As nuclear spin-lattice relaxation rate (1/) was measured with a saturation recovery method. at each temperature () was determined by fitting the nuclear magnetization versus time using the exponential function for 75As NQR, where and are the nuclear magnetization at time after the saturation and the equilibrium nuclear magnetization at , respectively.
III III. Results and discussion
III.1 A. 75As NMR and NQR spectra
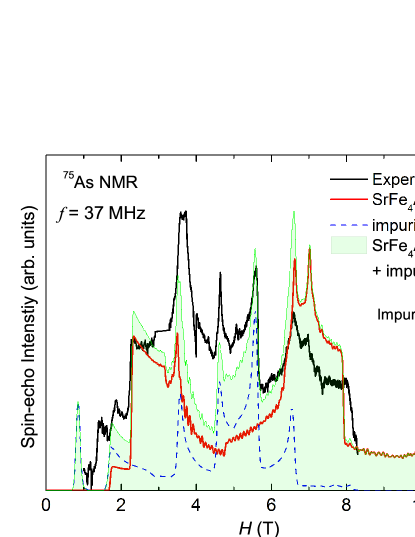
Figure 1 shows the field-swept 75As-NMR spectrum in SrFe4As12 at = 4.3 K. The typical NMR spectrum can be described by a nuclear spin Hamiltonian which is a sum of the nuclear Zeeman () and electric quadrupole () interactions:
| (1) |
where
| (2) |
and
| (3) |
in the coordinate of the principal , , and axes of electric field gradient (EFG). Here is the applied field, is Planck’s constant, is nuclear quadrupole frequency defined by = /2 where is the quadrupole moment of the As nucleus, is the EFG at the As site, is the asymmetry parameter of the EFG, and and are the polar and azimuthal angles between the direction of the applied field and the axis of EFG, respectively.
Different from the case of a nuclear spin = 3/2 with larger Zeeman interaction and small perturbed quadrupolar interaction where a central transition and two satellite peaks can be expected, a complex NMR spectrum is observed in SrFe4As12. This is due to a strong quadrupole interaction and a finite asymmetric parameter of the EFG tensor at the As site. In order to reproduce the complex NMR spectrum, we calculated a powder-pattern NMR spectrum by diagonalizing exactly the nuclear spin Hamiltonian without using perturbation theory. The calculated spectrum with the NMR frequency = 37 MHz, NQR frequency = 54.8 MHz and = 0.4 reasonably reproduces the characteristic shape of the observed spectrum, as shown by the red curve in Fig. 1. However, we notice that, in addition to the calculated spectrum (red curve), there is another contribution (12 spectral weight) of 75As NMR spectrum with = 23.6 MHz and = 0 to the total NMR spectrum. This contribution is assigned to the impurity phase of arsenic metal impurity .
The principal axis of EFG at the As site cannot be determined from NMR spectrum measurements on the powder compound. Tou et al. Tou2005 have determined the principal axis of the EFG at the Sb sites in the isostructural PrOs4Sb12 compound from NMR measurements using a single crystal, which reports that, although there is one crystallographically equivalent Sb site in the filled skutterudite structure, there are three different Sb sites with the principal axis parallel to [100], [010], and [001] of the crystal, respectively, due to the local symmetry of the 24g site of the Sb ions. The same conclusion for the direction of the EFG at the Sb sites in CeOs4Sb12 has been reported from Sb NMR using an oriented powder sample Yogi2009 . Since the crystal structure of the Sb compounds is the same with that of SrFe4As12, we consider the directions of EFG at the As sites are the same.
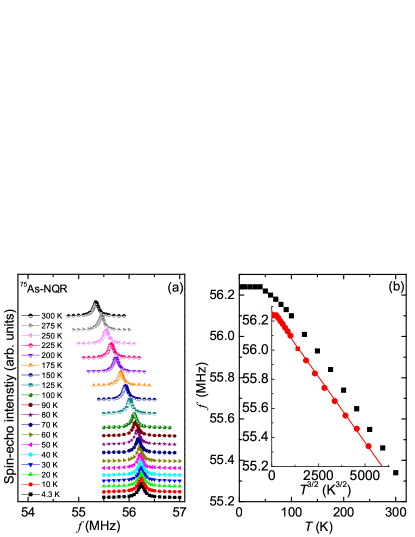
In NQR spectrum under zero magnetic field for = 3/2 (only in ), one expects a single transition line at a frequency of . Using the = 54.8 MHz and = 0.4 at = 4.3 K estimated from the analysis of the NMR spectrum, one expects the NQR line at 56.3 MHz which is actually observed as shown in Fig. 2 (a). The temperature dependence of the NQR spectra from 4.3 K to 300 K is also presented in the figure. Although the peak position slightly shifts to lower frequency with increasing temperature above 40 K, the linewidth of the NQR spectra (full-width at half maximum, 140 kHz) is nearly independent of temperature and no broadening or splitting has been observed. This indicates that there are no any structural or magnetic phase transitions from 4 K to 300 K in SrFe4As12. The temperature dependence of determined from the peak positions of the NQR spectra is shown in Fig. 2 (b). Similar temperature dependence of is observed in many filled skutterudite compounds Matsumura2007 ; Shimizu2007 ; Magishi2014 ; Nowak2009 ; Nowak2011 ; Yogi2014 where the temperature dependence at higher temperatures is found to obey an empirical relation with a fitting parameter . This temperature dependence is considered to be due to thermal lattice expansion alphaQ . As shown in the inset of Fig. 2 (b), the temperature dependence of in SrFe4As12 also follows the relation with K-3/2. The origin of the deviation from the relation below 40 K is not clear at present, but one of the possible origins could be due to the quench of the isotropic lattice expansion, as has been discussed in Ref. Matsumura2007, .
III.2 B. 75As Knight shift
Determination of the Knight shift from the complex NMR spectrum shown in Fig. 1 is relatively difficult due to the strong quadrupole interaction and relatively large asymmetric parameter value, along with the presence of the impurity phase. Usually is estimated from NMR spectrum which is performed under magnetic field large enough to the quadrupole interaction. In the case of SrFe4As12, at the As site is more than 50 MHz. This would require a magnetic field of more than 30 T (corresponding to the NMR frequency of 218 MHz) which is not easily accessible. In addition, small changes in and produce a change in , making the determination of difficult from the simulation of NMR spectrum. Here, without using the usual method, we have succeeded in obtaining the Knight shift data from NQR spectrum under small magnetic fields lower than 0.5 T. A similar measurement has been performed on the filled skutteruride compounds Fe4Sb12 ( = Sr, Ca) by Sakurai K . In the case of = 0, the NQR resonance frequency [] under a small magnetic field can be written by Dean1954
| (4) |
where is at = 0 and = . Under magnetic fields, the random distribution of produces the rectangular shape of the powder-pattern spectrum where = 0 (and also ) produce both higher- and lower-frequency edges. By measuring the external magnetic field dependence of the edge position of the NQR spectrum, one can determine the coefficient of the second term of eq. (4), , and thus the Knight shift since the value is known. In the case of 0, is given by
| (5) |
Here one has a factor in the second term, which depends on the value of . is not equal to unity due to the mixing of the eigen states and originating from the finite value of in . In order to determine , one needs to know the value of . To determine the value, we have calculated the resonance frequency corresponding to the lower-frequency edge position [see Fig. 3(a)] under different magnetic fields by strictly diagonalizing for = 0.4. This calculation provides a value of = 7.1417. Then we determined to be 0.9794 using = 7.2919 MHz/T for 75As nucleus.

Figure 3 (a) shows typical NQR spectra observed at = 0 and 0.5 T at = 4.3 K where the rectangular shape of the powder pattern spectrum under = 0.5 T is clearly seen. The small peaks (at 50 and 63 MHz) on both sides of the central rectangular spectrum are due to the mixing of states and as a result of zero-order mixing effect PQR . In fact, these features of the observed spectrum are relatively well reproduced by the calculated powder-pattern spectrum with = 54.8 MHz, = 0.4 and = 0.5 T, as shown by the blue curve in Fig. 3 (a). The inset of Fig. 3 (a) shows a typical magnetic field dependence of at the lower edge position (indicated by the black arrow), exhibiting a clear linear behavior. From the slope of -6.73 0.18 MHz/T, the Knight shift at 4.3 K was determined to be -5.7 2.5 . Although the error 40 is relatively large, this is much better than the case of NMR spectrum from which we could not determine . It is also noted that we did not include any anisotropy in the Knight shift in the calculated spectrum which reproduces the observed one as shown above. This suggests that, although one expects an anisotropic part in the Knight shift due to the local symmetry of the Fe ions (trigonal), the anisotropy is not significant and could not be detected within our experimental uncertainty. Therefore, the Knight shift discussed below is considered as an isotropic part of Knight shift.
Following the above method, we determined for each temperature whose temperature dependence is shown in Fig. 3 (b). The temperature dependence of seems to be similar to that of which shows a broad maximum at 50 K. This maximum is observed as a minimum in the data due to the negative hyperfine coupling constant as described below. The NMR shift consists of temperature dependent spin shift and independent orbital shift ; = + where is proportional to the spin part of magnetic susceptibility () via hyperfine coupling constant , = . Here is Avogadro’s number and = 2 is the number of the nearest neighbor Fe ions at the As site. The hyperfine coupling constant is estimated to be = -2.24 0.6 kOe/ from the slope in the so-called - plot shown in the inset of Fig. 3 (b). The obtained is comparable to -1.87 kOe/ at the Sb site reported in SrFe4Sb12 and CaFe4Sb12 K . The transferred hyperfine coupling is due to the coupling between Fe-3 spins and As nucleus through the Fe-As covalent bond. is estimated to be -3.3 1.1 . Here we assumed that the observed is almost ascribed to the spin part since the temperature independent part of the susceptibility is estimated to be less than 1 of even at 300 K from the analysis based on a Curie-Weiss fitting of the data.
III.3 C. 75As spin-lattice relaxation rate 1/
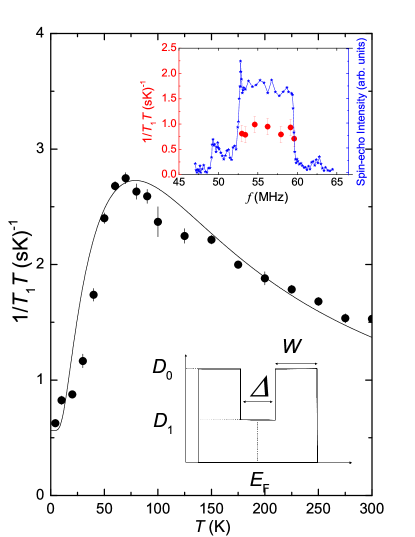
Figure 4 shows the temperature dependence of the 75As spin-lattice relaxation rate divided by temperature (1/) measured at the peak positions of the NQR spectra under zero magnetic field. 1/ increases gradually with decreasing temperature, and exhibits a broad maximum at 70 K, slightly higher than 50 K observed in . Below 70 K, 1/ decreases rapidly with decreasing temperature. Similar suppression of 1/ at low temperatures is observed in many filled skutterudite compounds, which has been discussed in terms of pseudo-gap behavior at low temperatures Magishi2014 ; Matsumura2005 ; K ; Matsumura2007 ; Toda2008 . In order to analyze the temperature dependence of , we calculated it based on a simple model where we adopt a concave-shaped band structure shown in the inset of Fig. 4. In this model, the Fermi energy () is assumed to be at the center of the dip, and , , the density of states and characterize the band structure near . A similar calculation for CePt4Ge12 has been reported previously Toda2008 . Using the formula,
| (6) |
where is the Fermi distribution function, we calculated with a set of parameters of = 88 K, = 220 K, and 1/0 = 0.38, which reasonably reproduces the experimental data, as shown by the black curve in Fig. 4. This indicates that the suppression of below can be explained by the rigid peculiar band structure modeled. We also calculated the temperature dependence of using the same model. The solid line in Fig. 3 (b) is the calculated result utilizing the same set of parameters used for the fitting, where = -3.3 is used. Although the fit is not quite satisfactory, the model seems to capture the behavior of qualitatively. It is noted that a slightly different set of parameters ( = 88 K, = 100 K, and = 0.38) improves the fitting as shown by the green broken line in Fig. 3 (b). At present, it is not clear the reason why the different sets of parameters are needed to fit each data set well. Since our model is very crude, one could improve the fit if more detailed band structure were available. Further studies, such as band calculation and angle-resolved photoemission spectroscopy measurement will be needed to confirm the peculiar band structure proposed from the present study and also obtain the detailed information of the band structure.
III.4 D. Ferromagnetic spin fluctuations

Now we discuss the magnetic fluctuations in SrFe4As12 based on the and the spin part of the Knight shift () data. Here we apply a Korringa ratio analysis to extract the character of spin fluctuations. Within a Fermi liquid picture, is proportional to the square of the density of states at the Fermi energy () and is proportional to (), leading to the Korringa relation of = = . Here is the electron gyromagnetic ratio. For the 75As nucleus, Ks. The Korringa ratio , which reflects the deviations from , can reveal information about electron correlations in the material Moriya1963 ; Narath1968 . It is noted that we have included a factor of 2 in the Korringa ratio by taking the effect of the number of the nearest neighbor Fe irons into consideration. represents the situation of uncorrelated electrons. However, enhancement of ( 0) increases 1/ but has little or no effect on , which probes only the uniform ( = 0). Thus 1 indicates antiferromagnetic (AFM) spin correlations. In contrast, FM spin correlations produces 1. Therefore, the predominant feature of magnetic correlations, whether AFM or FM, can be determined by the Korringa ratio . Figure 5 shows the temperature dependence of the Korringa ratio . seems to be nearly temperature independent with most values around 0.02, although the value of at 200 K is slightly higher than others. values much smaller than unity clearly evidence dominant ferromagnetic fluctuations in SrFe4As12. A similar, but slightly smaller, value of = 0.005 has been reported in SrFe4Sb12 and CaFe4Sb12 K . These results indicate that the change in ligand does not significantly affect the magnetic properties of the skutterudite compounds, although the magnetic properties largely depend on the number of the valence electrons of the ions in Fe as described in Introduction.
In this analysis, we have assumed that 1/ is isotropic. In order to check the anisotropy in 1/, we have measured the position dependence of 1/ in the As NQR spectrum under a magnetic field of 0.5 T. As shown in the upper inset of Fig. 4, we do not observe significant change in 1/ at different positions (i.e., different ) of the spectrum within our experimental uncertainty, indicating that is nearly isotropic. In addition, it should be noted that the observed 1/ is the sum of two contributions: the spin and orbital relaxation rates. As a result, the estimated values for can be considered to be upper limits on , indicating even stronger FM correlations in SrFe4As12 than expected from the above values.
IV IV. Summary
In summary, we have carried out 75As NMR and NQR measurements on the filled skutterudite SrFe4As12. No broadening or splitting of the NQR spectra observed around 56 MHz confirms no phase transition in SrFe4As12. Using the NQR spectra under small magnetic field, we have succeeded in determining Knight shift whose temperature dependence shows a minimum at 50 K corresponding to the maximum in the magnetic susceptibility . The nuclear spin-lattice relaxation rate divided by temperature, 1/, also exhibits a broad maximum at 70 K, slightly higher than . Those temperature dependences have been reasonably explained by the simple model in which a concave-shaped band structure near the Fermi energy is assumed. The Korringa ratio parameter is found to be much smaller than unity, revealing the existence of ferromagnetic fluctuations. Our NMR data clearly indicate that SrFe4As12 is a metal with ferromagnetic spin correlations. Similar concave-shaped DOS has been observed in other skutterudite compounds which do not exhibit ferromagnetic order although strong ferromagnetic fluctuations have been revealed Matsumura2007 ; Magishi2014 . These results may suggest that the characteristic concave-shaped DOS would be relevant to the absence of ferromagnetic order in those systems. Finally, it is worth to mention that the isostructural compound SrOs4As12 is a superconductor with a of 4.8 K Nishine2017 . Quite recently a similar compound with the same structure, CaOs4P12, has been suggested to be a BCS-type superconductor with = 2.5 K Kawamura2018 . It would be very interesting to perform NMR and NQR measurements on SrOs4As12 and CaOs4P12 for investigating their magnetic fluctuations, as well as superconducting properties, from a microscopic point of view.
V Acknowledgments
The authors thank Mamoru Yogi for helpful discussions. The research was supported by the U.S. Department of Energy (DOE), Office of Basic Energy Sciences, Division of Materials Sciences and Engineering. Ames Laboratory is operated for the U.S. DOE by Iowa State University under Contract No. DE-AC02-07CH11358. Part of this work was supported by JSPS KAKENHI Grant Number 23340092.
References
- (1) W. Jeitschko and D. Braun, Acta Crystallogr., Sect. B 33, 3401 (1977).
- (2) B. C. Sales, Filled skutterudites, in , edited by K. A. Gschneidner Jr., J.-C. Bunzli, and V. K. Pecharsky (Elsevier Science, Amsterdam, 2003), Vol. 33, Chap. 211, and references there in.
- (3) I. Shirotani, T. Uchiumi, K. Ohno, C. Sekine, Y. Nakazawa, K. Kanoda, S. Todo, and T. Yagi, Phys. Rev. B 56, 7866 (1997).
- (4) C. Sekine, T. Uchiumi, I. Shirotani, and T. Yagi, Phys. Rev. Lett. 79, 3218 (1997).
- (5) A. Leithe-Jasper, W. Schnelle, H. Rosner, N. Senthilkumaran, A. Rabis, M. Baenitz, A. Gippius, E. Morozova, J. A. Mydosh, and Y. Grin, Phys. Rev. Lett. 91, 037208 (2003).
- (6) W. Schnelle, A. Leithe-Jasper, H. Rosner, R. Cardoso-Gil, R. Gumeniuk, D. Trots, J. A. Mydosh, and Y. Grin, Phys. Rev. B 77, 094421 (2008).
- (7) K. Ishida, H. Murakawa, K. Kitagawa, Y. Ihara, H. Kotegawa, M. Yogi, Y. Kitaoka, Ben-Li Young, M. S. Rose, D. E. MacLaughlin, H. Sugawara, T. D. Matsuda, Y. Aoki, H. Sato, and H. Harima, Phys. Rev. B 71, 024424 (2005).
- (8) E. Matsuoka, K. Hayashi, A. Ikeda, K. Tanaka, T. Takabatake, and M. Matsumura, J. Phys. Soc. Jpn. 74, 1382 (2005).
- (9) M. Matsumura, G. Hyoudou, H. Kato, R. Nishioka, E. Matsuoka, H. Tou, T. Takabatake, and M. Sera, J. Phys. Soc. Jpn. 74, 2205 (2005).
- (10) Y. Nakai, K. Ishida, D. Kikuchi, H. Sugawara, and H. Sato, J. Phys. Soc. Jpn. 74, 3370 (2005)
- (11) M. Matsumura, H. Kato, T. Nishioka, E. Matsuoka, K. Hayashi, and T. Takabatake, J. Magn. Magn. Mater. 310, 1035 (2007).
- (12) M. Shimizu, H. Amanuma, K. Hachitani, H. Fukazawa, Y. Kohori, T. Namiki, C. Sekine, and I. Shirotani, J. Phys. Soc. Jpn. 76, 104705 (2007).
- (13) H. Tou, Y. Inaoka, M. Doi, M. Sera, K. Asaki, H. Kotegawa, H. Sugawara, and H. Sato, J. Phys. Soc. Jpn. 80, 074703 (2011).
- (14) K. Magishi, R. Watanabe, A. Hisada, T. Saito, K. Koyama, J. Phys. Soc. Jpn. 83, 84712 (2014).
- (15) Y. Kawamura, S. Deminami, L. Salamakha, A. Sidorenko, P. Heinrich, H. Michor, E. Bauer, and C. Sekine, Phys. Rev. B 98, 024513 (2018).
- (16) B. C. Sales, D. Mandrus, and R. K. Williams, Science 272, 1325 (1996).
- (17) A. Leithe-Jasper, W. Schnelle, H. Rosner, M. Baenitz, A. Rabis, A. A. Gippius, E. N. Morozova, H. Borrmann, U. Burkhardt, R. Ramlau, U. Schwarz, J. A. Mydosh, Y. Grin, V. Ksenofontov, and S. Reiman, Phys. Rev. B 70, 214418 (2004).
- (18) W. Schnelle, A. Leithe-Jasper, M. Schmidt, H. Rosner, H. Borrmann, U. Burkhardt, J. A. Mydosh, and Y. Grin, Phys. Rev. B 72, 020402(R) (2005).
- (19) A. Sakurai, M. Matsumura, H. Kato, T. Nishioka, E. Matsuoka, K. Hayashi, and T. Takabatake, J. Phys. Soc. Jpn. 77, 063701 (2008).
- (20) A. Gippius, M. Baenitz, E. Morozova, A. Leithe-Jasper, W. Schnelle, A. Shevelkov, E. Alkaev, A. Rabis, J. Mydosh, Y. Grin, and F. Steglich, J. Magn. Magn. Mater. 300, 403(E) (2006).
- (21) K. Nishine, Y. Kawamura, J. Hayashi, and C. Sekine, Jpn. J. Appl. Phys. 56, 05FB01 (2017).
- (22) C. Sekine, T. Ishizaka, K. Nishine, Y. Kawamura, J. Hayashi, K. Takeda, H. Gotou, and Z. Hiroi, Phys. Procedia 75, 383 (2015).
- (23) 75As NQR measurements of the impurity phase show that NQR frequency is = 23.6 MHz, = 0, and 1/ 0.5 (sK)-1 from 4.3 K up to 150 K. Since these values are close to = 22.757 MHz and 1/ 0.68 (sK)-1 in arsenic metal AsMetal1 ; AsMetal2 , the impurity phase could be assigned to arsenic metal.
- (24) T. J. Bastow, J. Phys.: Condens. Matter 11, 569 (1999).
- (25) D. E. Jellison and P. C. Taylor, Solid State Commun. 27, 1025 (1978).
- (26) H. Tou, M. Doi, M. Sera, M. Yogi, Y. Kitaoka, H. Kotegawa, G.-q. Zheng, H. Harima, H. Sugawara, H. Sato, Physica B 359-361, 892 (2005).
- (27) M. Yogi, H. Niki, M. Yashima, H. Mukuda, Y. Kitaoka, H. Sugawara, and H. Sato, J. Phys. Soc. Jpn. 78, 053703 (2009).
- (28) M. Matsumura, G. Hyoudou, M. Itoh, H. Kato, T. Nishioka, E. Matsuoka, H. Tou, T. Takabatake, and M. Sera, J. Phys. Soc. Jpn. 76, 084716 (2007).
- (29) B. Nowak, O. Żogał, A. Pietraszko, R. E. Baumbach, M. B. Maple, and Z. Henkie, Phys. Rev. B 79, 214411 (2009).
- (30) B. Nowak, O. Żogał, Z. Henkie, and M.B. Maple, Solid State Communications 151, 550 (2011).
- (31) M. Yogi, H. Niki, T. Kawata, and C. Sekine, JPS Conf. Proc. 3, 011046 (2014).
- (32) S. Takagi, H. Muraoka, T. D. Matsuda, Y. Haga, S. Kambe, R. E. Walstedt, E. Yamamoto, and Y. nuki, J. Phys. Soc. Jpn. 73, 469 (2004).
- (33) C. Dean, Phys. Rev. 96, 1053 (1954).
- (34) T. P. Das and E. L. Hahn, Nuclear Quadrupole Resonance Spectroscopy in Solid State Physics, Supplement I (Academic Press Inc., New York, 1958).
- (35) M. Toda, H. Sugawara, K. Magishi, T. Saito, K. Koyama, Y. Aoki, H. Sato, J. Phys. Soc. Jpn. 77, 124702 (2008).
- (36) T. Moriya, J. Phys. Soc. Jpn. 18, 516 (1963).
- (37) A. Narath and H. T. Weaver, Phys. Rev. 175, 373 (1968).