The physical and chemical properties of the ophiuchi A dense core
Abstract
The physical and chemical properties of the Ophiuchi A core were studied using 1.3 mm continuum and molecular lines such as C18O, C17O, CH3OH and H2CO observed with the Submillimeter Array (SMA). The continuum and C18O data were combined with the single-dish data obtained with the IRAM 30m telescope and the James Clerk Maxwell Telescope (JCMT), respectively. The combined 1.3 mm continuum map reveals three major sources, SM1, SM1N and VLA1623 embedded in the extended emission running along the north-south direction, and two additional compact condensations in the continuum ridge connecting SM1 and VLA1623. The spatial distribution of the C18O emission is significantly different from that of the continuum emission; the C18O emission is enhanced at the eastern and western edges of the continuum ridge, with its peak brightness temperature of 40–50 K. This supports the picture that the -Oph A core is heated externally from the nearby stars Oph S1 and HD147889. In contrast, the C18O intensity is lower than 15–20 K at the center of the ridge where the continuum emission is bright. The C18O abundance decreases inside the ridge, and shows anti-correlation with the N2H+ abundance. However, both C18O and N2H+ show strong depletion at the Class 0 protostar VLA1623, implying that the dense gas surrounding VLA1623 is colder than the freeze-out temperature of N2. The blue- and red-shifted components of CH3OH and H2CO lines are seen at SM1, suggesting outflow activity of embedded source in SM1, although the spatial distributions do not show clear bipolarity.
1 Introduction
It is well established that the formation of low-mass stars occurs from the collapse of gravitationally-bound molecular cloud cores (e.g. Shu et al., 1987). Cores before the onset of star formation are called “pre-protostellar cores” or “pre-stellar cores”. Physical and chemical properties of prestellar cores on the verge of star formation are particularly interesting because they provide us the clues to understand the initial conditions of star formation.
The Ophiuchus cloud complex at a distance of 137.31.2 pc (Ortiz-León et al., 2017) is one of the closest molecular clouds with ongoing low-mass star formation. The Ophiuchus main cloud L1688 consists of several regions labeled from A to F (e.g. Loren et al., 1990); among them, the -Oph A core is the most prominent core in the millimeter and submillimeter continuum emission (e.g. Motte et al., 1998; Wilson et al., 1999; Johnstone et al., 2000). The continuum images show that the -Oph A is a curved ridge consisting of a chain of condensations labeled SM1, SM1N, SM2 and VLA1623. Except VLA1623, which is a widely-studied Class 0 object (Andre et al., 1993), the other condensations in the -Oph A core have been considered to be starless, because there was no clear signature of star formation. However, recent high resolution and sensitivity observations with the Acatama Large Millimeter/Sub-Milimeter Array (ALMA) at Band 7 have revealed that SM1 contains a spatially compact continuum emission component with a size of 40 AU (Friesen et al., 2014). Friesen et al. (2014) also claimed that SM1 is protostellar because of the X-ray and radio detection toward this source. Later ALMA observations at Band 3 discovered another compact continuum source between SM1 and VLA1623 (Kirk et al., 2017). On the other hand, Nakamura et al. (2012) combined the data obtained with the Submillimeter Array (SMA) and single-dish, and found additional small condensations within SM1. Their results demonstrated the importance of filling the short-spacing data in order to find the small-scale condensations buried in the extended emission.
In order to examine the evolutionary stage of the condensations, kinematic information and chemical properties provided by the molecular line observations are helpful. However, most of the interferometric observations have been limited toward the Class 0 protostar VLA1623 (e.g. Murillo & Lai, 2013; Murillo et al., 2013)
In this paper, we present the 1.3 mm continuum and C18O (2–1) images obtained with the combination of the SMA and the single-dish data. Our combined images successfully recovered from large-scale to small-scale (5″) emission from the -Oph A region. We also present the SMA images of the C17O, CH3OH, and H2CO from the SM1 region.
2 Observations
2.1 SMA data of the -Oph A ridge
The SMA data of the 1.3 mm continuum and the C18O (2–1) line were obtained from the SMA data archive. The observations were made on August 5, 2005 in the compact configuration. The primary beam size (FWHM) of the SMA 6-m antennas at 1.3 mm is 54″. The -Oph A ridge that is prominent in the continuum map (e.g. Motte et al., 1998) was covered with the 4-pointing mosaic (Figure 1). The spectral correlator that consists of 24 chunks of 104 MHz bandwidth covers 2 GHz bandwidth in each of the two sidebands separated by 10 GHz. The C18O line was observed simultaneously with the CO (2–1) and 13CO (2–1) lines. The spectral resolution of the chunks with the C18O and 13CO lines is 203 kHz per channel, which corresponds to the velocity resolution of 0.264 km s-1. The rest of the channels are covered with the uniform resolution of 812 kHz (1.048 km s-1). The absolute flux density scale was determined from the observations of Callisto and Uranus. A pair of nearby quasars, 1626-298 and 1517-243, were used to calibrate the relative amplitude and phase. The bandpass was calibrated by Jupiter and 3c454.3. The visibility data were calibrated using the MIR package in IDL. The continuum data were obtained by averaging the line-free chunks of both sidebands. To improve the signal-to-noise ratio, the continuum data of the upper and lower sidebands were combined.
2.2 Single-dish data
The 1.3 mm continuum data of the -Oph A region were taken with the IRAM 30m telescope by Motte et al. (1998). The observational details are described in Motte et al. (1998). The continuum image has an effective beam resolution of 13″and 1 sigma noise level of 10 mJy beam-1. The single-dish data of the C18O (2–1) line were obtained through the JCMT science archive. The C18O observations were conducted on May 3, 1999 using the RxA3 receiver. The backend was a Digital Autocorrelating Spectrometer that was configured to have a spectral resolution of 82.1 kHz (0.1067 km s-1). The FWHM beam size of the JCMT at a frequency of the C18O line is 22″. The 6′ 6′area including the entire region of the -Oph A ridge was observed in the on-the-fly mode. The raw data were calibrated and gridded to the data cube using the “ORAC-DR” pipeline (Cavanagh et al., 2008) in the Starlink software. The resultant rms noise level of the data cube is 0.7 K per channel.
2.3 Combining Single-dish and Interferometer data
In order to fill the short spacing information that was not sampled by the interferometer, the SMA continuum data were combined with the IRAM 30m data, and the SMA C18O data cube were combined with the JCMT data cube. We used the MIRIAD package and followed the procedure described in Takakuwa (2003), which is based on the description of combining single-dish and interferometric data in Vogel et al. (1984). The combined maps were deconvolved using the CLEAN-based algorithm, MOSSDI (Sault et al., 1996). The synthesized beam is 5231 (P.A. = 6.1) for the continuum map and that is 4934 (P.A. = 6.1) for the C18O map.
2.4 The SMA observations toward SM1
The additional SMA observations toward one of the submillimeter sources, SM1, were done on Mar. 7 and 9 in 2016 in the compact configuration. The two tracks were conducted with different frequency settings, one including the CH3OH (5k–4k) lines at 241.8 GHz, and the other including the H2CO (31,2–21,1) line at 225.698 GHz, H2CO (31,3–21,2) line at 211.211 GHz and C17O (2–1) line at 224.714 GHz. The 4 GHz bandwidth in each sideband was covered by 48 chunks of 104 MHz bandwidth. The spectral resolution of the chunks with the CH3OH, H2CO, and C17O lines was 204 kHz (0.264 km s-1) per channel. The bright quasar, 3c273, was observed as a bandpass calibrator, and the nearby quasar, 1517-243, was used as phase and amplitude calibrators. The flux calibrators of the first track were Callisto and Ganymede, and those of the second track were Europa and MWC349A. The visibility data were calibrated using the MIR package, and imaged using the MIRIAD package. The synthesized beam sizes are 3324 for the CH3OH data cube, 4027 for the H2CO (31,3–21,2) data cube, 3324 for the H2CO (31,2–21,1) data cube and 3725 for C17O data cube. The 1 rms noise level is 0.09 Jy beam-1 per channel in CH3OH and H2CO data cube, and that of the C17O data cube is 0.07 Jy beam-1. Only the two CH3OH lines with the lowest energy levels (50– A, = 34.8 K and 5-1–4-1 E, = 40.4 K) were detected. Both H2CO lines (31,3–21,2, = 32.1 K and 31,2–21,1, = 33.4 K) were detected in the SMA observations, but we only present the H2CO (31,3–21,2) line, since the lines having similar energy levels show similar structures. The continuum data were obtained by averaging the line-free chunks of both sidebands. The data of two sidebands were combined in order to improve the signal-to-noise ratio. In addition, the continuum visibility data of the two tracks are also combined. The synthesized beam and the 1 rms noise level of the continuum map are 3929 (P.A. = -9.1) and 2.7 mJy beam-1, respectively.
3 Results and analysis
3.1 1.3 mm continuum
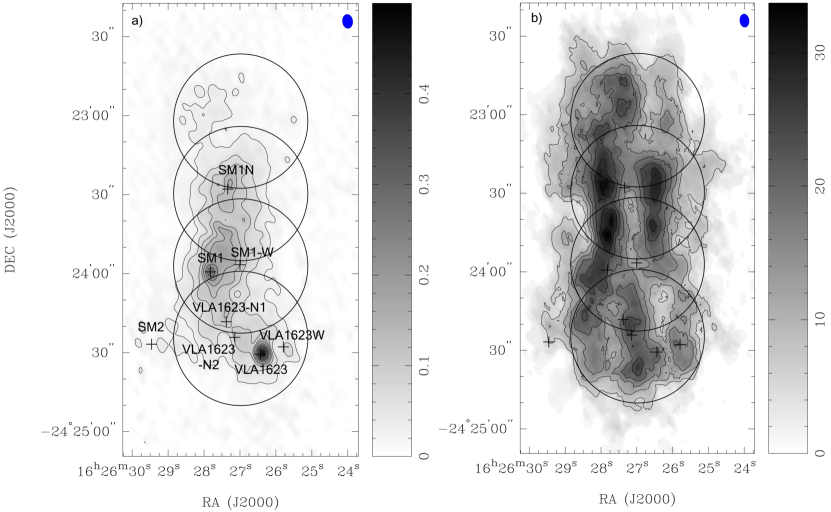
Figure 1a shows the 1.3 mm continuum emission from -Oph A region obtained by the combination of the IRAM 30 m data and the SMA interferometer data. The continuum emission shows the N-S ridge similar to the single-dish map presented in Mezger et al. (1992), Andre et al. (1993) and Motte et al. (1998). There are three major components, VLA1623, SM1, and SM1N. Our high resolution map having an angular resolution of 5″reveals that each source has internal structure. The brightest source in this region is VLA1623, a well-studied class 0 protostar (e.g. Andre et al., 1993). The recent studies by Murillo & Lai (2013) and Chen et al. (2013) showed that VLA1623 consists of three sources, VLA1623A, B and W, which are suggested to be a triple non-coeval system. In our continuum map, VLA1623A and B, having a separation of 1″, are not spatially resolved. On the other hand, VLA1623W is identified as a separate peak.
The emission from the second brightest source, SM1, shows a well-defined peak. Recent ALMA observations at 359 GHz (Friesen et al., 2014) have revealed that this source is very compact, having a size of only 0.31″( 42 au at 137 pc). The compact source is surrounded by the extended structure having an elongation toward the north-western direction. In the SM1 region, Nakamura et al. (2012) reported three condensations. The brightest one, a1, corresponds to the continuum peak of our map. The other two, a2 and a3, are not clearly seen in our map, probably because of the low intensity contrast of these components and the lower angular resolution of our map. VLA1623 and SM1 are connected by the curved emission ridge, having two local peaks labeled as VLA1623-N1 and N2. In contrast to SM1 and VLA1623, the northern source SM1N is spatially extended and contains no compact component, which is consistent with the 359 GHz results of Friesen et al. (2014). The emission from SM2 is less significant, because this source is located beyond the area covered by our 4-pointing mosaic. The 3mm continuum map in Kirk et al. (2017) have the similar structure as our continuum map; both the extended filament around north-east of SM1 and VLA1623-N1 are clearly seen in their map.
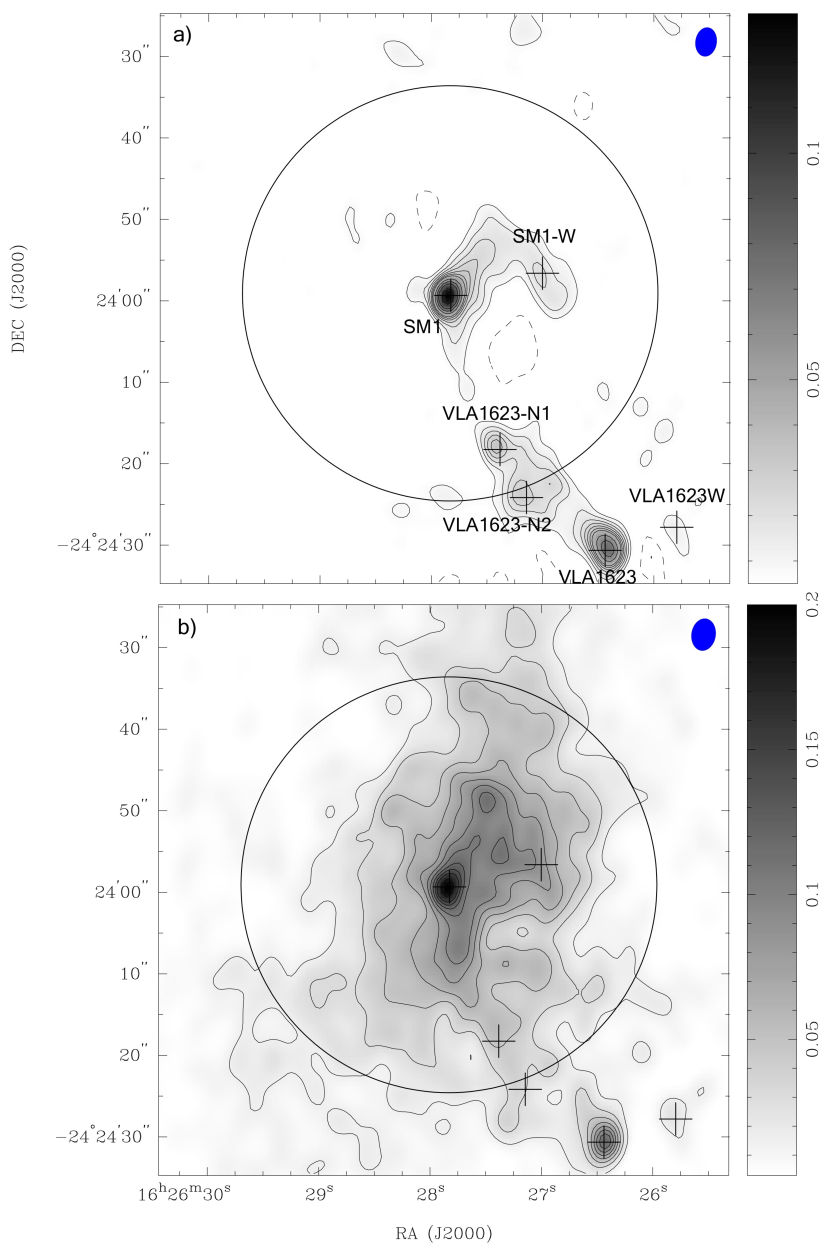
Figure 2a shows the continuum map of the SM1 region observed with the SMA in 2016. With higher sensitivity thanks to the wider bandwidth, two sources, VLA1623-N1 and N2, are clearly seen in this map. The SMA data are also combined with the IRAM 30m data (Figure 2b) The combined map recovers well the extended emission around the SM1 peak. The continuum emission extends to the north of SM1, which is consistent with the 340 GHz results of Nakamura et al. (2012). However, the small scale condensations a2 and a3 reported by Nakamura et al. (2012) are not clearly seen in our maps. Instead, our SMA map shows the local intensity maximum to the west of SM1, which is labeled as SM1-W. Instead of being obvious in the SMA map (Figure 2a), VLA1623-N1, -N2 and SM1-W are not significant in the combined map (Figure 2b) because of the rather high-level emission from the extended component.
| Source | R.A. | Dec. | Sp | St | FWHM | P.A. | Massaa The uncertainty in the mass calculation derived from the 1 error in the measured flux is 10. | MBE |
|---|---|---|---|---|---|---|---|---|
| (J2000) | (J2000) | (Jy beam-1) | (Jy) | (arcsec) | (degrees) | (M⊙) | (M⊙) | |
| VLA1623 | 16:26:26.44 | -24:24:30.65 | 0.50 | 0.86 | 324 | 7.3 | 0.41 | 0.010 |
| VLA1623-N1**The parameters for VLA1623-N1, VLA1623-N2 and SM1-W are determined from the SMA map (Figure 2a) only. | 16:26:27.38 | -24:24:18.26 | 0.049 | 0.11 | 4718 | 44.3 | 0.05 | 0.014 |
| VLA1623-N2**The parameters for VLA1623-N1, VLA1623-N2 and SM1-W are determined from the SMA map (Figure 2a) only. | 16:26:27.15 | -24:24:24.17 | 0.06 | 0.31 | 6853 | 60.1 | 0.15 | 0.02 |
| VLA1623W | 16:26:25.80 | -24:24:27.81 | 0.14 | 0.32 | 5524 | 14.4 | 0.15 | 0.017 |
| SM1 | 16:26:27.83 | -24:23:59.34 | 0.19 | 0.59 | 5842 | -9.3 | 0.28 | 0.018 |
| SM1-W**The parameters for VLA1623-N1, VLA1623-N2 and SM1-W are determined from the SMA map (Figure 2a) only. | 16:26:27.00 | -24:23:56.61 | 0.02 | 0.17 | 12240 | 36.4 | 0.08 | 0.038 |
The coordinates, peak flux density, total flux, size, and position angle of each source were determined from the single Gaussian component fitting using the MIRIAD task IMFIT. The size and position angle of each source are derived after deconvolved with the beam. The parameters of VLA1623-N1, -N2 and SM1-W are derived from the SMA map shown in Figure 2a, while those of VLA1623, VLA1623W, and SM1 are from the combined map shown in Figure 2b. The derived parameters are listed in Table 1.
3.2 C18O (2–1)
The integrated intensity map of the C18O obtained by combining the JCMT data and the SMA data is presented in Figure 1b. Although the C18O emission comes from the N-S ridge of the -Oph A, its spatial distribution is significantly different from that of the continuum; the C18O emission is bright in the eastern and western edges of the ridge, and rather faint at the center of the ridge where the continuum emission is bright.
In the northern part, the anti-correlation between the C18O and continuum is significant; the continuum peak SM1N is located between two bright ridges of the C18O. In the southern part, there is a third ridge of C18O emission connecting SM1 and VLA1623. However, the C18O does not follow the curved ridge traced by the 1.3 mm continuum. In addition, locations of the C18O peaks do not coincide with the continuum peaks. On the other hand, the C18O peak coincides with the continuum peak at VLA1623W.
Since our C18O map contains the short-spacing information obtained with the JCMT, the lack of bright emission at the center of the ridge is not the effect of spatial filtering of the interferometer. The CO and 13CO lines observed in the -Oph molecular cloud often show the self-reversal line profile, which could produce intensity drop at the line of sight at high optical depth. However, the observed C18O line does not show such a self-reversal profile. Such an anti-correlation between the C18O and continuum was not clear in the previous single-dish observations (Liseau et al., 2010; White et al., 2015) due to their angular resolutions. Recently, Liseau et al. (2015) deconvolved their C18O (3–2) image, and improved the angular resolution from 19 to 7. Their deconvolved C18O image also reveals the anti-correlation with the continuum distribution. Moreover, by comparing our C18O integrated intensity map with the N2H+ map from Di Francesco et al. (2004), we found that the most of the N2H+ emission comes from the region between two C18O ridges (Figure 3). The highest N2H+ emission occurs across SM1N and SM1, where the C18O emission is missing. The spatial distribution of the C18O is anti-correlated with that of N2H+ except the southern ridge including VLA1623-N1 and VLA1623-N2.
| Source | |||||||
|---|---|---|---|---|---|---|---|
| (cm-2) | (cm-2) | (cm-2) | () | () | (10-9) | (10-8) | |
| VLA1623 | 5.8 | 2.5 | 7.8 | 4.3 | 1.4 | 3.6bbThe C17O abundance is calculated from the SMA data only. | 1.3ccThe C18O abundance is derived by multiplying the C17O abundance estimated from the SMA data by the 18O/17O abundance ratio, 3.65 (Penzias, 1981). |
| VLA1623-N1 | 2.7 | 5.2 | 54.2 | 24.4 | 20.2 | 2.4bbThe C17O abundance is calculated from the SMA data only. | 0.88ccThe C18O abundance is derived by multiplying the C17O abundance estimated from the SMA data by the 18O/17O abundance ratio, 3.65 (Penzias, 1981). |
| VLA1623-N2 | 2.4 | 4.5 | 60.1 | 18.8 | 25.1 | 6.0bbThe C17O abundance is calculated from the SMA data only. | 2.2ccThe C18O abundance is derived by multiplying the C17O abundance estimated from the SMA data by the 18O/17O abundance ratio, 3.65 (Penzias, 1981). |
| VLA1623W | 1.5 | 2.1 | 6aaThe flux of the N2H+(C17O) emission is below the 3 noise level. | 14.2 | 3.9aaThe flux of the N2H+(C17O) emission is below the 3 noise level. | 1.7aaThe flux of the N2H+(C17O) emission is below the 3 noise level.bbThe C17O abundance is calculated from the SMA data only. | 0.62ccThe C18O abundance is derived by multiplying the C17O abundance estimated from the SMA data by the 18O/17O abundance ratio, 3.65 (Penzias, 1981). |
| SM1 | 5.4 | 10.2 | 17.0 | 19.1 | 3.2 | 2.4bbThe C17O abundance is calculated from the SMA data only. | 0.88ccThe C18O abundance is derived by multiplying the C17O abundance estimated from the SMA data by the 18O/17O abundance ratio, 3.65 (Penzias, 1981). |
| SM1-W | 2.2 | 6.6 | 65.5 | 3.8 | 20.5 | 5.2aaThe flux of the N2H+(C17O) emission is below the 3 noise level.bbThe C17O abundance is calculated from the SMA data only. | 1.9ccThe C18O abundance is derived by multiplying the C17O abundance estimated from the SMA data by the 18O/17O abundance ratio, 3.65 (Penzias, 1981). |
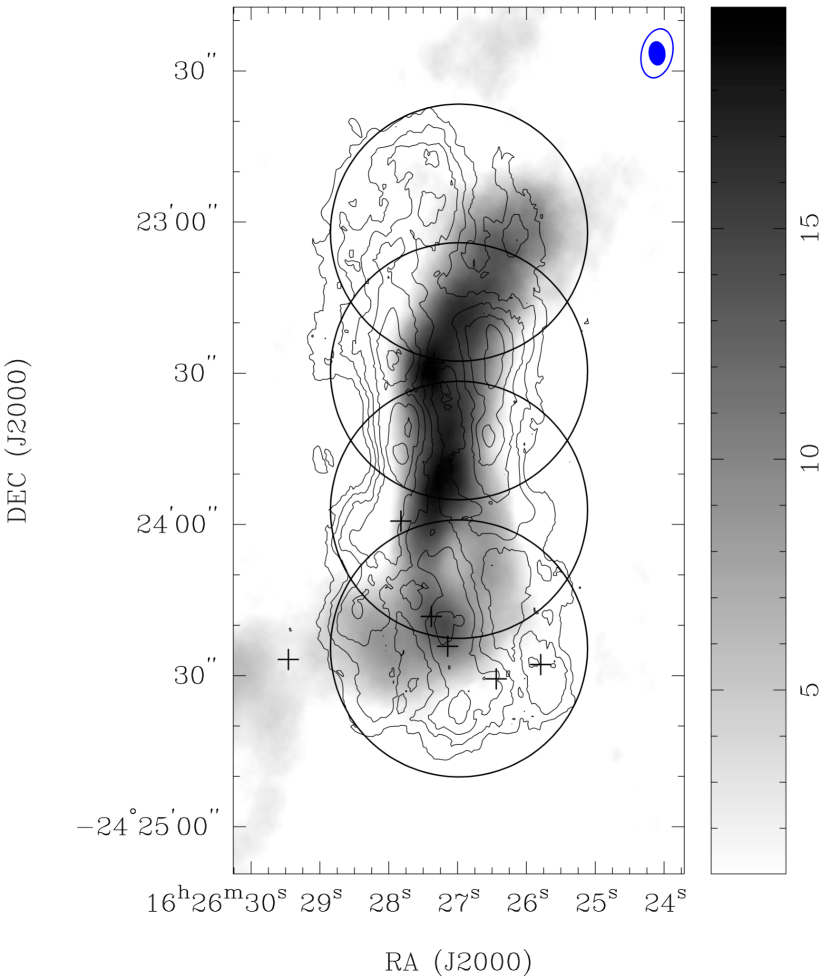
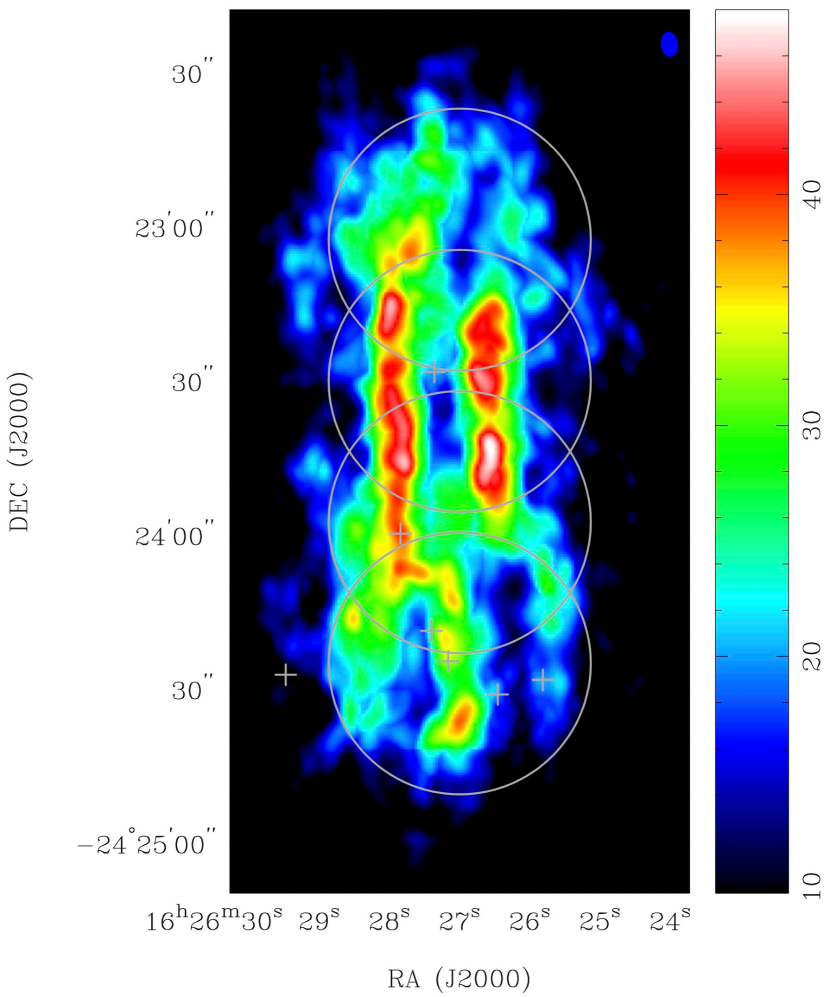
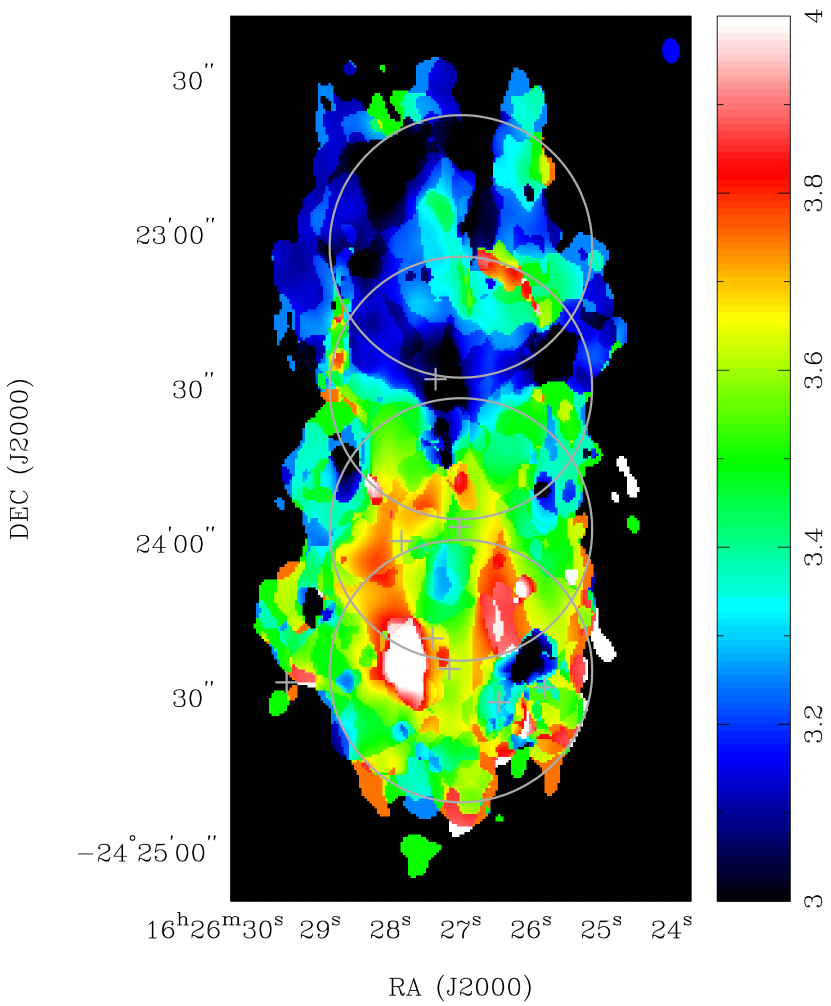
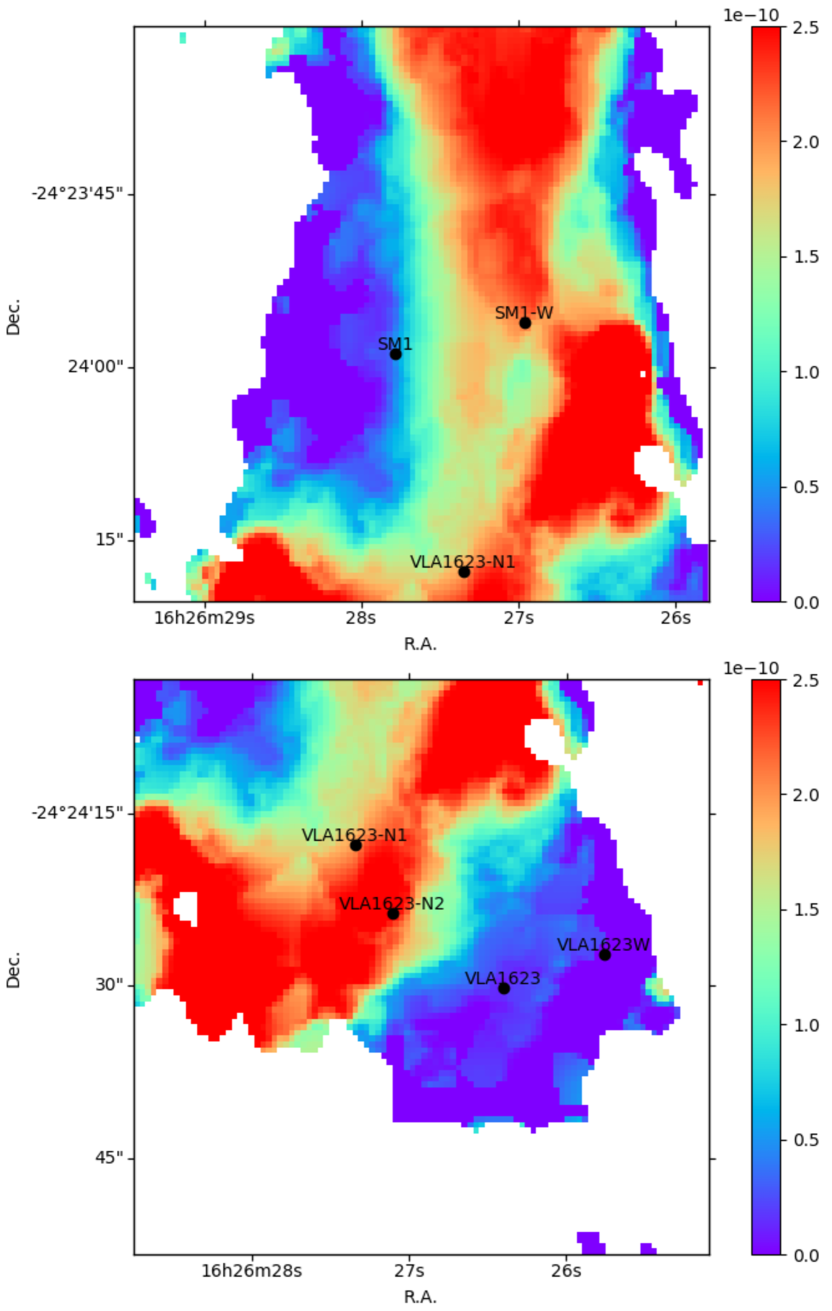
The C18O peak intensity map shown in figure 4 indicates that the prominent C18O ridges have high brightness temperature of 40 K; whereas, in the rest region, the temperature is roughly 25 K or below. A notable thing is that, except SM1, where the temperature is roughly 40 K, major dust condensations are located in the regions with lower brightness temperature; VLA1623-N1 and VLA1623-N2 are in the region with 30 K, and SM1N, VLA1623, and VLA1623W are in the regions of 25K.
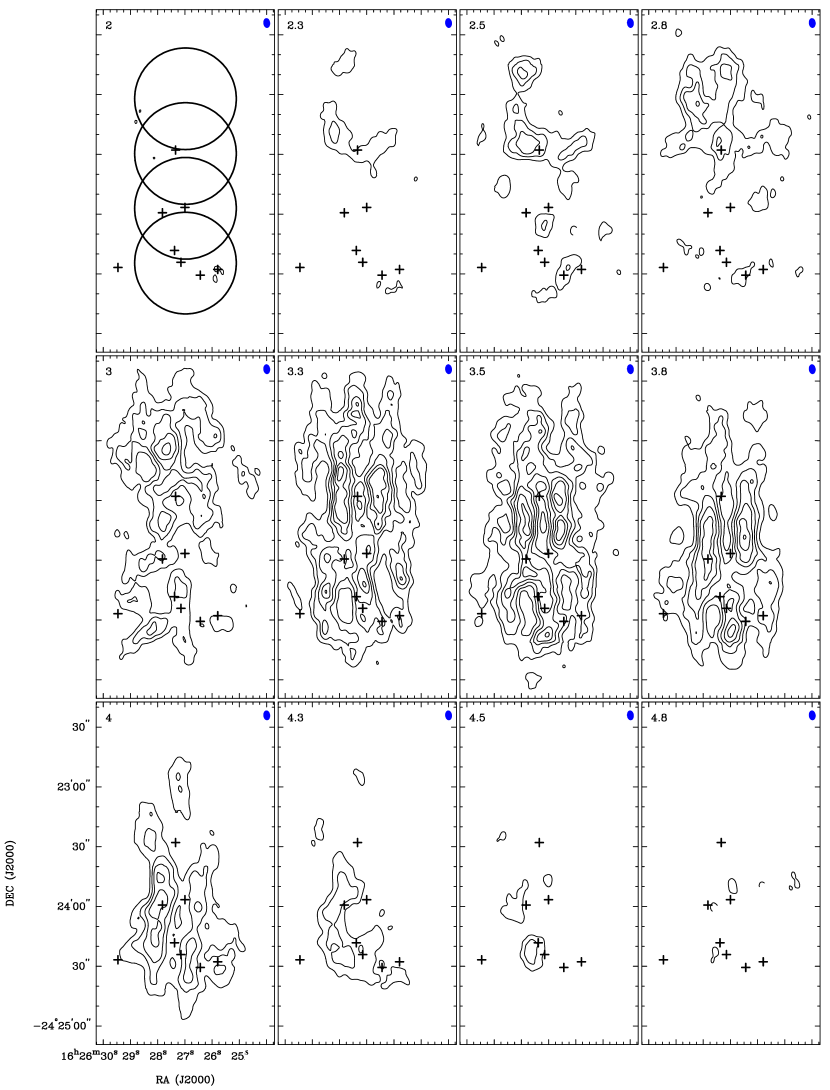
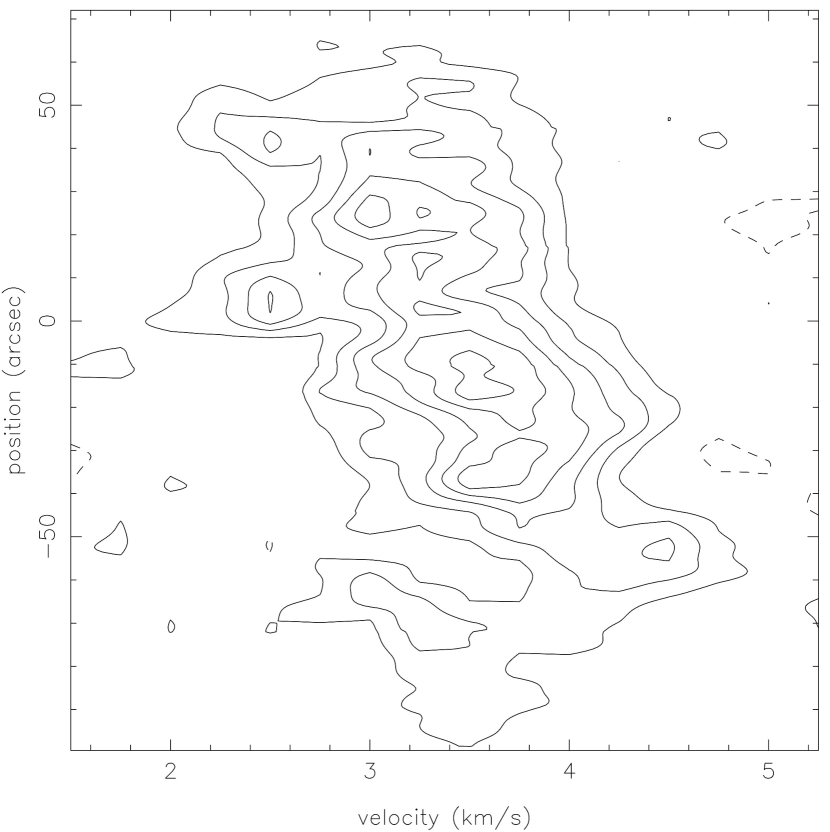
The channel map (Figure 5) and the position-velocity map along the N-S cut through R.A. = 16h26m27s (Figure 6) show that there is a significant velocity gradient along the -Oph A ridge. The velocity centroid in the northern part of the ridge is at VLSR 3.1 km s-1, and gradually changes to 3.7 km s-1 at the position of SM1, which is consistent with the C18O (3–2) results of Liseau et al. (2010). The southern redshifted component shows an arc-like feature at 4.3 km s-1. This arc-like feature follows the eastern edge of the continuum arc connecting SM1 and VLA1623 (see Panel 10 of Figure 5). Bergman et al. (2011) have also shown that the chemical properties are different between the northern part and southern part of the ridge. The deuterated species like HDCO, D2CO and N2D+ are abundant in the southern part with 3.7 km s-1, but are deficient in the northern part with 3.1 km s-1.
The abrupt velocity change near SM1N in moment 1 map (Figure 7) is likely to be originated from the third component at VLSR 2.9 km s-1, which is clearly seen in the H2CO position-velocity and profile maps in Bergman et al. (2011). This component is not clearly seen in the position-velocity map of C18O (3–2) in Bergman et al. (2011), while clearly seen in our C18O (2–1) position-velocity map. Furthermore, the 2.9 km s-1 component has the C-shaped pattern seen in the mom1 map and channel map, and might be related to the methanol rich gas, which also shows C-shaped morphology in larger scale (Bergman et al., 2011; Garay et al., 2002). Overall, it is likely that the -Oph A ridge consists of three components with different velocities and chemical properties; the northern component at 3.1 km s-1 which is deficient in deuterated species, the southern deuterium-rich component at 3.7 km s-1, and the north-western component at 2.9 km s-1 having high methanol abundance.
3.3 C18O and N2H+ Abundance
The column density of H2 in -Oph A can be determined from 1.3 mm continuum emission by the formula
| (1) |
where Sν is the 1.3 mm flux density, is the solid angle of the beam, is the mean molecular weight, mH is the mass of the atomic hydrogen, is the dust opacity per unit mass. (assumed to be 0.005 cm2 g-1, which is the same value used by Motte et al. (1998) for pre-stellar clumps and cores), and B is the Plank function at the dust temperature, which is assumed to be 27 K (Andre et al., 1993).
On the other hand, by following Mangum & Shirley (2015), the C18O and N2H+ column densities can be derived from the local thermodynamic equilibrium (LTE) assumptions,
| (2) |
and,
| (3) |
where and are the major and minor axes of the beam (FWHM in arcseconds), respectively, is the excitation temperature, is the optical depth, is flux density, and is the velocity interval. Since C18O is not optically thin in the -oph A region, the optical depth of the C18O emission was estimated using the C18O (2–1) and C17O (2–1) data observed with the JCMT (Gurney et al., 2008). Unfortunately, the C17O dataset covers only the 50″ 50″areas centered at SM1 and VLA1623. Therefore, we could not derive the optical depth of the C18O in the SM1N region. We followed the method described in the appendix B of Ladd et al. (1998). The 18O/17O abundance ratio was assumed to be 3.65 (Penzias, 1981). Because the JCMT data were sampled in a 10″grid, the optical depth were calculated by interpolating the data points. The calculation showed that C18O is optically thick in most of the -Oph A region with the highest value of 5.5 at 5″W of SM1. As for N2H+ lines, Di Francesco et al. (2004) showed that the total optical depth of the N2H+ line is larger than unity in the -Oph A region. Therefore, the N2H+ column density was calculated from the “isolated” 101-012 component at 93.176265 GHz with optically thin assumption and divided by its relative intensity, which is . The excitation temperature of the C18O formula in each pixel was derived from the peak intensity map (Figure 4). The excitation temperature of N2H+ was assumed to be 15 K, based on the result of HFS (HyperFine Structure) fitting in Di Francesco et al. (2004). In order to calculate the abundances, the resolution of the H2 column density map derived from the continuum data was adjusted to be the same as those of the C18O map and N2H+ map, respectively. After dividing C18O column density and N2H+ column density by H2 columns density, we derived the abundance distribution over the -Oph A region.
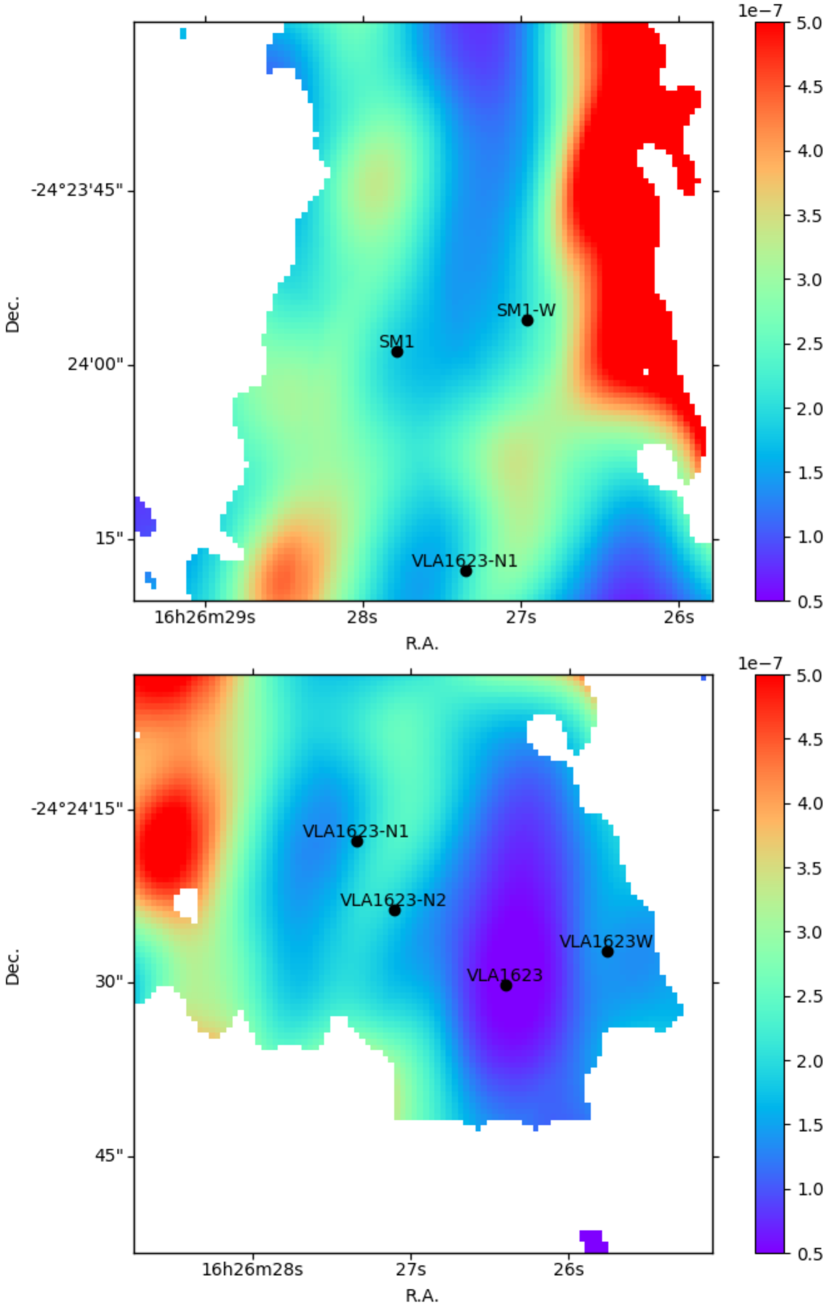
The C18O abundance distribution in the -Oph A region is presented in Figure 8 and the N2H+ abundance distribution in the same region is presented in Figure 9. The column densities of H2, C18O and N2H+ and the abundances of C18O and N2H+ at each source position are listed in Table 2 for comparison. As shown in Figure 8, the C18O abundance decreases significantly at the central N-S ridge and the position of VLA1623. The C18O abundances at those regions are below 210-7. On the other hand, the C18O abundance value often used in the interstellar medium is 1.7–210-7 (Frerking et al., 1982; Wannier, 1980). The higher value of 4.810-7 is also suggested from the CO abundance of 2.710-4 (Lacy et al., 1994; Jørgensen et al., 2005) and [16O/18O] = 560 (Wilson & Rood 1994). The C18O abundance values measured in the N-S ridge and VLA1623 are a factor of 5–10 lower than the interstellar values. On the other hand, the C18O abundance values at SM1, VLA1623-N1, VLA1623-N2, and VLA1623-W are 210-7, which is comparable to that of the interstellar value.
The N2H+ abundance varies between different sources among -Oph A. Di Francesco et al. (2004) suggest it is due to different evolutionary stage of each source. The N2H+ abundance is enhanced in the northern part of the ridge and the C-shaped region including VLA1623-N1 and VLA1623-N2. It drops significantly to the eastern edge of the ridge and the southwestern part including VLA1623. It should be noted that the N2H+ abundance is very low, 1.410-11 at the position of VLA1623, toward which the C18O abundance is also the lowest.
3.4 C17O, CH3OH and H2CO at SM1
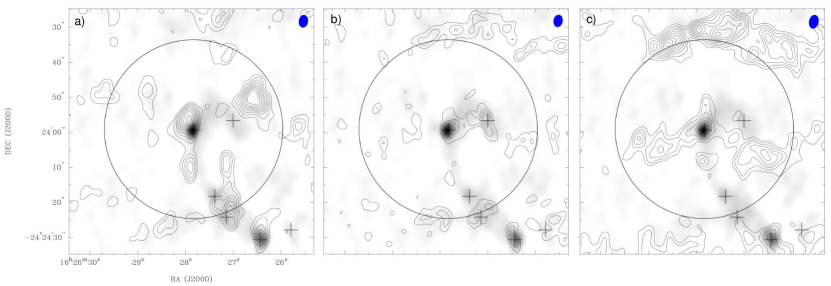
The C17O (2–1), which is typically optically thin, can be used to probe the high-density region near SM1. The optical depth of C17O in the -oph A region was obtained from the calculation of the optical depth of C18O in section 3.3. The (C17O) has maximum value of 1.5 at 5″W of SM1 and is smaller than unity in most part of the -oph A region. The integrated intensity map of C17O in the SM1 field is presented in Figure 10a. The C17O emission extends from SM1 through VLA1623-N2, VLA1623-N1, and reaches to VLA1623. The overall distribution of the C17O follows that of the continuum emission. The C17O peak at VLA1623 coincide well with the continuum peak. On the other hand, the C17O peak at SM1 appears at 3″northeast of the continuum peak. The emission component at 15″NW of SM1 is more than 17, but there is no counterpart of this component in the continuum or other molecular lines. The missing flux of the C17O was estimated by comparing the flux value of the SMA map convolved to the JCMT beam and that observed with the JCMT. It turned out that the C17O flux recovered by the SMA is only 3 of the single-dish flux. This indicates that most of the C17O emission comes from the spatially extended component and very little from the envelope of SM1.
We calculated the C17O abundance from the continuum and C17O data observed with the SMA by following the similar steps described in section 3.3. The Tex is assumed to be 27 K. The C17O fractional abundances are 3.610-9, 2.410-9, 2.410-9 and 610-9 at VLA1623, SM1, VLA1623-N1 and VLA1623-N2, respectively. After multiplying by the 18O/17O relative abundance of 3.65 (Penzias, 1981), the derived C18O abundances are 1.310-8 at VLA1623, 8.810-9 at SM1 and VLA1623-N1,and 2.210-8 at VLA1623-N2, which are significantly lower than those estimated in the previous section using the combined C18O and continuum data. Because the abundance values derived here use the SMA data alone, they are the local values at the compact sources. It is likely that the C18O abundance in the compact sources are more than one order of magnitude lower than the interstellar value, even at the positions of SM1, VLA1623-N1,and VLA1623-N2.
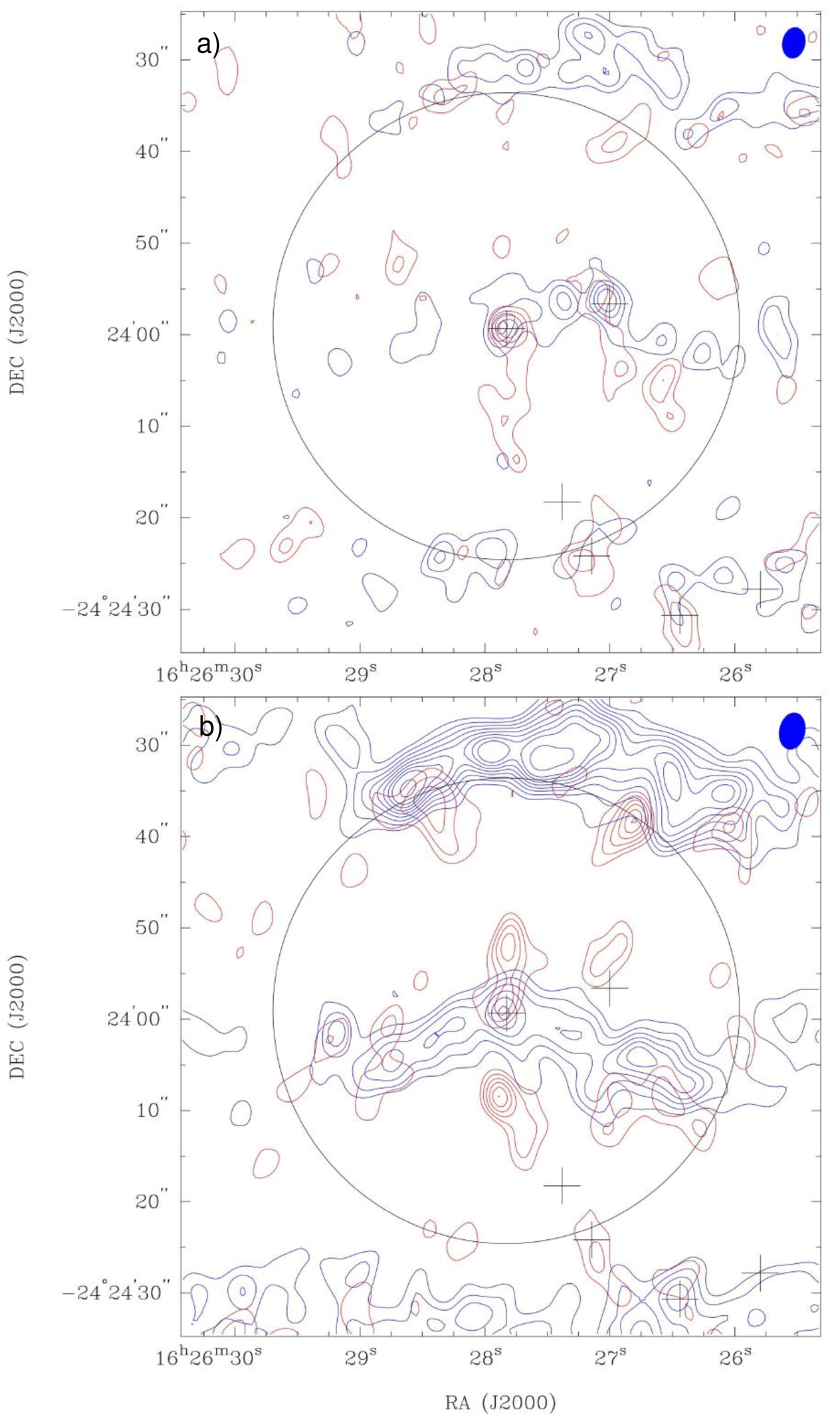
The CH3OH and H2CO show a localized emission peak at the position of SM1 (Figure 10b and 10c). These line also show a localized peak toward VLA1623. The CH3OH shows the secondary peak at SM1-W. The CH3OH emission is also seen near VLA1623-N2. The spatial distribution of the CH3OH emission correlate well with that of the continuum emission, except for the missing counterpart of VLA1623-N1. On the other hand, the spatial distribution of the H2CO is different; the emission extends to the southeast and southwest of SM1. There is no counterpart of VLA1623-N1 and VLA1623-N2 in the H2CO map. In addition, the H2CO shows very bright emission at 30″N of SM1, which corresponds to the northern edge of our field of view. This emission component is also seen in the CH3OH. The location of these components corresponds to the southern edge of the 2.9 km s-1 component seen in the single-dish maps of H2CO and CH3OH (Bergman et al., 2011). Since CH3OH and H2CO are good tracers for molecular outflow(e.g. Bachiller et al., 2001; Gerin et al., 2015), we searched for the signature of outflow in this region. The CH3OH and H2CO emission was separated into the blue-shifted part and red-shifted part (Figure 11). Both blue-shifted and red-shifted components are seen in the vicinity of SM1. However, their spatial distributions do not show clear bipolarity.
4 discussions
4.1 Nature of the Small condensations
Determining the fate of small condensations such as SM1, VLA1623-N1, -N2 and SM1-W in the dense core will benefit the understanding of low-mass star forming process. The mass of each condensation is derived from the total flux listed in Table 1, using the formula,
| (4) |
where is the total flux, is the distance to the source, is the dust mass opacity and is the Plank function at a given temperature. The dust mass opacity is assumed to be 0.005 cm2 g-1, which is the same as in Motte et al. (1998). The dust temperature is assumed to be 27 K (Andre et al., 1993). The masses of those condensations are in the range of 10-2–10-1 M⊙. For comparison, the mass of the critical Bonnor-Ebert sphere (Bonnar, 1956) is calculated from
| (5) |
where k is the Boltzmann constant, T is the gas kinetic temperature, G is the gravitational constant, m is the mean molecular mass, and is the critical radius. The critical radius is simply assumed to be the same as the semi major axis of each source. The temperature is assumed to be 27 K, which is the same as that used in the mass calculation. As shown in Table 1, the masses of all the condensations exceed the Bonnor-Ebert mass, which implies those condensations are gravitationally bounded.
VLA1623 and VLA1623W have already been identified as non-coeval multiple system (Murillo & Lai, 2013). The recent ALMA observation by Friesen et al. (2014) also found compact structure in SM1. In addition, SM1 is also associated with the source detected in X-ray and radio at 5 GHz (Gagne et al., 2004), These imply that SM1 has already harbored a protostar. VLA1623-N1 has similar properties as SM1. This source is identified as a compact emission source 10 by Kirk et al. (2017) in their 3 mm image observed with the ALMA. In addition, the position of the X-ray source, J162627.4-242418, which is one of the unidentified X-ray sources in Gagne et al. (2004), coincides with that of VLA1623-N1. Recently, Kawabe et al. (2018) studied the properties of SM1 and VLA1623-N1 based on the multi-wavelength observations from radio to X-ray, and proposed that these sources are proto brown dwarfs or in the very early phase of low-mass protostars. On the other hand, there is no clear counterpart of VLA1623-N2 and SM1-W in the ALMA images at 3 mm (Kirk et al., 2017) and 1.3 mm (Kawabe et al., 2018). The 3 mm image of Kirk et al. (2017) shows some hint of faint condensation at the position of VLA1623-N2. In order to search for the counterpart of VLA1623-N2, we have examined the 3 mm continuum image that was made of two datasets available from the ALMA data archive. The resulting image (Figure 12 in Appendix A) has higher sensitivity and resolution than those of the 3 mm image in Kirk et al. (2017). However, our new 3 mm image does not show clear evidence of compact source at the position of VLA1623-N2. The 1.3 mm image presented in Kawabe et al. (2018) also does not show the corresponding source. In addition, there is no counterpart of this source in the X-ray (Gagne et al., 2004) nor in the radio (Leous et al., 1991; Gagne et al., 2004). Although the water maser source is found at R.A.(J2000) = 16h26m27.028s and Dec. (J2000) = 24∘24′24.284″(Yu & Chernin, 1997), which is only 1.6″W of VLA1623-N2, it is unlikely that VLA1623-N2 harbor a protostar. Another condensation SM1-W does not have a clear counterpart in the ALMA images of 3 mm (Kirk et al., 2017), 1.3 mm (Kawabe et al., 2018), and 0.84 mm (Friesen et al., 2014) as well. This source is not detected in the X-ray (Gagne et al., 2004) nor in the radio (Leous et al., 1991; Gagne et al., 2004). The absence of compact condensation implies that VLA1623-N2 and SM1-W are still in the prestellar stage.
4.2 Physical condition and CO depletion
As shown in Figure 4, the peak intensity of the C18O is enhanced to T 40–50 K at the edges of the -Oph A ridge, while it is lower than 30 K toward the center of the ridge. The higher temperature in the edges is likely due to external heating by stellar UV and X-ray photons. One of the possible heating sources is Source 1 (herafter Oph S1) at 1.5′(12,000 au) E of SM1N. Oph S1 having a lumnosity of 1600 (Wilking et al., 2005) is known to be a binary with a B4 primary and companion with a K magnitude of 8.3 (Simon et al., 1995), and is emitting both strong non-thermal radio and X-ray emission (Gagne et al., 2004). The UV as well as higher energy photons reach the eastern surface of the -Oph A ridge and heat the eastern edge of the ridge. Another heating source is the B2 star HD147889 with 4500 (Greene & Young, 1989), which is 15′(0.5 pc) to the southwest and behind the -Oph A ridge (Liseau et al., 1999). This source is likely to be responsible in heating the ridge from the west. Since the continuum emission from mid-infrared, far-infrared, to millimeter in the -Oph A region is modeled well with the external heating of S1 and HD147889 (Liseau et al., 2015), it is natural to consider that the molecular gas in the -Oph A ridge is also heated from these two stars.
On the other hand, the C18O intensity drops significantly toward the continuum ridge; especially, it is below 15 K in the region between SM1 and SM1N. In this region, the abundances of the C18O and N2H+ show clear anti-correlation. Similar anti-correlation between C18O (3–2) and N2H+ (3–2) is also seen in Liseau et al. (2015). These imply that the gas temperature in the center of the -Oph A ridge, where the external radiation is shielded, is lower than the CO freeze-out temperature of 25 K (Öberg et al., 2005). In the cold and dense environment, N2, a parent molecule of N2H+, is also expected to freeze-out. Since the desorption energy ratio of N2 and CO measured in the recent laboratory experiments is 0.9 (Öberg et al., 2005; Fayolle et al., 2016), the N2 freeze-out temperature is only a few degrees lower than that of CO. The clear anti-correlation between C18O and N2H+ implies that sufficient amount of N2 is in the gas-phase. This is probably because that the area with the C18O–N2H+ anti-correlation is still starless (Kirk et al., 2017) and the freeze-out timescales of molecules are long enough to differentiate the gas-phase abundance of CO and N2. As a result, the N2H+ abundance increases after CO, which is the main destructor of N2H+, disappears. SM1 is located at the eastern edge of the C18O depletion zone. Although the C18O abundance at the position of SM1 derived from the combined maps of the continuum and C18O, 1.910-7, is not very low as compared to the interstellar value of 1.7–4.810-7, this is because of the spatially extended emission along the line of sight. The C18O abundance at SM1 is a factor of 20 lower if it is derived from the SMA data. This suggests that the CO depletion is also significant in the dense gas envelope of SM1. The C18O abundance shows the lowest value of 4.310-8 toward VLA1623. Although the C18O line traces the rotating disk around VLA1623A, there is no C18O emission from VLA1623B and the envelope surrounding this binary system (Murillo & Lai, 2013; Murillo et al., 2013). This implies that most of the dense gas surrounding the VLA1623A&B binary system is colder than the CO freeze-out temperature. Interestingly, the N2H+ also shows the lowest abundance at VLA1623. This implies that the temperature of the dense gas surrounding VLA1623 is lower than the freeze-out temperature of N2. Once both CO and N2 freeze-out completely, the N2H+ abundance does not increase when the gas is heated by the newly born star. Since the desorption energy of N2 does not differ significantly from that of CO, the N2 desorption area is expected to be comparable to the CO desorption area. In such a case, N2H+ is easily destructed by the CO desorbed from grains, and cannot have enough abundance to be observed.
Molecular clouds irradiated externally by nearby stars are often found in high-mass star forming regions. For example, molecular gas in the S255-S257 system is located between two HII regions, S255 and S257, and forms an elongated ridge compressed and illuminated by two HII regions (Minier et al., 2006). The dense gas ridge of this system harbors a cluster of YSOs with more than one hundred members (Ojha et al., 2011). The morphology of molecular ridge and the spatial distribution of the YSOs suggest that the star formation activity in this system is induced by the compression from two HII regions. On the other hand, dense molecular ridge irradiated by two early type stars in both sides is barely seen in the low-mass star forming regions; -Oph A is almost a unique example. In the case of -Oph A, the effect of external sources is moderate. Molecular gas is interacting with the Photon Dominated Region (PDR) around the nearest star S1. The Hii region around this star has a diameter of 20″(Andre et al., 1988), which is much smaller than the size of the PDR. The curved ridge morphology observed in the C18O (3–2) follows the outer edge of the spherical shell of the PDR around S1 traced by H2, [Oi] (Larsson & Liseau, 2017), and [Cii] (Mookerjea et al., 2018), suggesting that the molecular ridge has been compressed by the PDR. However, our C18O (2–1) data do not show the kinematical signature of external compression.
5 conclusions
We have studied the physical and chemical conditions of the -Oph A region using the 1.3 mm continuum, and molecular lines such as C18O (2–1) and N2H+(1–0). The 1.3 mm continuum and C18O (2–1) data observed with the SMA were combined with the data obtained with the IRAM 30 m telescope and JCMT, respectively, in order to fill the short-spacing information. Our main conclusions are summarized as follows.
-
1.
The combined 1.3 mm map reveals that the three major sources, VLA1623, SM1, and SM1N are embedded in the extended emission running along the north-south direction. VLA1623 and SM1 contain the spatially compact components, while SM1N does not have a compact component. The continuum emission around the SM1 peak is extended toward the northwest direction. The secondary peak, SM1-W, to the west of the SM1 peak implies the presence of small-scale clumps. However, the location of SM1-W does not coincide with those of the clumps reported in Nakamura et al. (2012).
-
2.
In addition to VLA1623 and SM1, two compact condensations, VLA1623-N1 and VLA1623-N2, are identified in the continuum ridge connecting VLA1623 and SM1. In addition, VLA1623W is also identified as a separate peak. All of the small condensations identified in the -Oph A region are gravitationally bounded. Among the newly discovered small condensations, VLA1623-N1 has a X-ray counterpart and is likely to harbor a young stellar object. On the other hand, VLA1623-N2 and SM1-W are starless.
-
3.
The spatial distribution of the C18O is significantly different from that of the continuum; the C18O emission is enhanced at the eastern and western edges of the continuum ridge. The brightness temperature of the C18O line is enhanced to 40–50 K in the eastern and western edges. This is consistent with the picture that the gas in the -Oph A ridge is heated externally by the nearby B-stars Oph S1 and HD147889.
-
4.
On the other hand, the gas in the inner dense ridge remains cold. The C18O intensity drops below 15 K in the region between SM1 and SM1N. In this region, the C18O abundance decreases and shows clear anti-correlation with the N2H+ abundance.
-
5.
Both C18O and N2H+ abundances decrease significantly toward the Class 0 protostar VLA1623. This implies that most of the dense gas surrounding VLA1623 is colder than the freeze-out temperature of N2, which is a few degrees lower than that of CO.
-
6.
The velocity structure of C18O suggests that the -oph A ridge consists of three components with different systemic velocities. These three velocity components are known to have different chemical properties; the northern component at 3.1 km s-1 is deficient in deuterated species, the southern component at 3.7 km s-1 is rich in deuterated species, and the north-western component at 2.9 km s-1 shows high abundance in methanol (Bergman et al., 2011; Garay et al., 2002).
-
7.
The CH3OH shows the blue-shifted and red-shifted components in the vicinity of SM1. These components are likely to trace the outflow activity of the embedded protostar in SM1. The similar components are also seen in the H2CO. However, the spatially extended H2CO emission does not show clear bipolarity.
Appendix A The 3 mm ALMA continuum map of the -oph A ridge
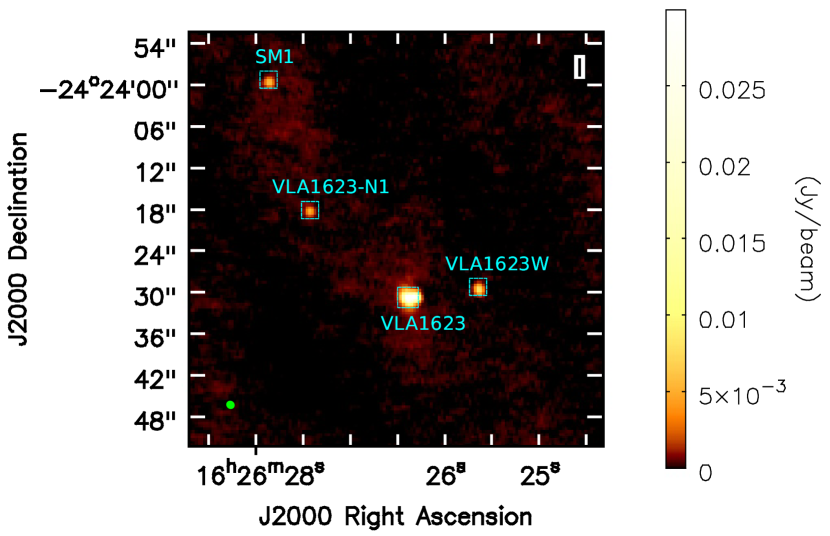
In Figure 12, we present the 3mm continuum map of the -oph A ridge, which is made by combining ALMA data from two projects (Project code = 2013.1.00187.S and 2016.1.01468.S). The ALMA datasets were obtained from ALMA Science Archive. The first Band 3 observations from project 2013.1.00187.S were made during cycle 2 on January 31, 2015. The array consisted of 37 antennas with relatively compact configuration. The field center is at the position of VLA1623. The continuum data were obtained at 101, 103, and 113 GHz, each covering a bandwidth of 2GHz. The total integration time is 60.48 seconds. The detail of the observation is also described in Kirk et al. (2017).
The second Band 3 observations from project 2016.1.01468.S were made during cycle 4 on November 16, 2016. The array was in C40-4 configuration. The field is also centered at the position of VLA1623. The observation covers frequency range from 108.72 GHz to 110.94 GHz. The total integration time is 241.92 seconds
CASA (Mcmullin et al., 2007) was used to calibrate and reduce both datasets. We concatenated two calibrated datasets and used “tclean” in the mfs (multi-frequency synthesis) mode to generate the combined 3 mm continuum map. The robust weighting of 0.5 was adopted, providing the synthesized beam size of 1110. The rms noise level of the 3 mm continuum image is 0.18 mJy beam-1.
References
- Andre et al. (1988) Andre, P., Montmerle, T., Feigelson, E. D., Stine, P. C., & Klein, K.-l. 1988, ApJ, 335, 940
- Andre et al. (1993) Andre, P., Ward-Thompson, D., & Barsony, M. 1993, ApJ, 406, 122
- Bachiller et al. (2001) Bachiller, R., Pérez Gutiérrez, M., Kumar, M. S. N., & Tafalla, M. 2001, A&A, 372, 899
- Bergman et al. (2011) Bergman, P., Parise, B., Liseau, R., & Larsson, B. 2011, A&A, 527, A39
- Bonnar (1956) Bonnar, W. B. 1956, MNRAS, 116, 351
- Cavanagh et al. (2008) Cavanagh, B., Jenness, T., Economou, F., & Currie, M. 2008, AN, 329, 295
- Chen et al. (2013) Chen, X., Arce, H. G., Zhang, Q., et al. 2013, ApJ, 768, 110
- Currie et al. (2014) Currie, M. J., Berry, D. S., & Jenness et al., T. 2014, in Astronomical Data Analysis Software and Systems XXIII, Vol. 485, 391
- Di Francesco et al. (2004) Di Francesco, J., Andre, P., & Myers, P. C. 2004, ApJ, 617, 425
- Fayolle et al. (2016) Fayolle, E. C., Balfe, J., Loomis, R., et al. 2016, ApJ, 816, L28
- Frerking et al. (1982) Frerking, M. A., Langer, W. D., & Wilson, R. W. 1982, ApJ, 262, 590
- Friesen et al. (2014) Friesen, R. K., Di Francesco, J., Bourke, T. L., et al. 2014, ApJ, 797, 27
- Gagne et al. (2004) Gagne, M., Skinner, S. L., & Daniel, K. J. 2004, ApJ, 613, 393
- Garay et al. (2002) Garay, G., Mardones, D., Rodriguez, L. F., Caselli, P., & Bourke, T. L. 2002, ApJ, 567, 980
- Gerin et al. (2015) Gerin, M., Pety, J., Fuente, A., et al. 2015, A&A, 577, L2
- Greene & Young (1989) Greene, T. P., & Young, E. T. 1989, ApJ, 339, 258
- Gurney et al. (2008) Gurney, M., Plume, R., & Johnstone, D. 2008, PASP, 120, 1193
- Ho et al. (2004) Ho, P. T. P., Moran, J. M., & Lo, K. Y. 2004, ApJ, 616, L1
- Johnstone et al. (2000) Johnstone, D., Wilson, C. D., Moriarty‐Schieven, G., et al. 2000, ApJ, 545, 327
- Jørgensen et al. (2005) Jørgensen, J. K., Schöier, F. L., & van Dishoeck, E. F. 2005, A&A, 435, 177
- Kawabe et al. (2018) Kawabe, R., Hara, C., Nakamura, F., et al. 2018, arXiv:1810.00573
- Kirk et al. (2017) Kirk, H., Dunham, M. M., Francesco, J. D., et al. 2017, ApJ, 838, 114
- Lacy et al. (1994) Lacy, J. H., Knacke, R., Geballe, T. R., & Tokunaga, A. T. 1994, ApJ, 428, L69
- Ladd et al. (1998) Ladd, E. F., Fuller, G. A., & Deane, J. R. 1998, ApJ, 495, 871
- Larsson & Liseau (2017) Larsson, B., & Liseau, R. 2017, A&A, 608, A133
- Leous et al. (1991) Leous, J. A., Feigelson, E. D., Andre, P., & Montmerle, T. 1991, ApJ, 379, 683
- Liseau et al. (2010) Liseau, R., Larsson, B., Bergman, P., et al. 2010, A&A, 510, A98
- Liseau et al. (1999) Liseau, R., White, G. J., Larsson, B., et al. 1999, A&A, 344, 342
- Liseau et al. (2015) Liseau, R., Larsson, B., Lunttila, T., et al. 2015, A&A, 578, A131
- Loren et al. (1990) Loren, R. B., Wootten, A., & Wilking, B. A. 1990, ApJ, 365, 269
- Mangum & Shirley (2015) Mangum, J. G., & Shirley, Y. L. 2015, PASP, 127, 266
- Mcmullin et al. (2007) Mcmullin, J. P., Waters, B., Schiebel, D., Young, W., & Golap, K. 2007, in Astronomical Data Analysis Software and Systems XVI, Vol. 376, 127
- Mezger et al. (1992) Mezger, P., Sievers, A., Zylka, R., et al. 1992, A&A, 265, 743
- Minier et al. (2006) Minier, V., Peretto, N., Longmore, S. N., et al. 2006, Proceedings of the International Astronomical Union, 2, 160
- Mookerjea et al. (2018) Mookerjea, B., Sandell, G., Vacca, W., Chambers, E., & Güsten, R. 2018, A&A, 616, A31
- Motte et al. (1998) Motte, F., Andre, P., & Neri, R. 1998, A&A, 336, 150
- Murillo & Lai (2013) Murillo, N. M., & Lai, S.-P. 2013, ApJ, 764, L15
- Murillo et al. (2013) Murillo, N. M., Lai, S.-P., Bruderer, S., Harsono, D., & van Dishoeck, E. F. 2013, A&A, 560, A103
- Nakamura et al. (2012) Nakamura, F., Takakuwa, S., & Kawabe, R. 2012, ApJ, 758, L25
- Öberg et al. (2005) Öberg, K. I., van Broekhuizen, F., Fraser, H. J., et al. 2005, ApJ, 621, L33
- Ojha et al. (2011) Ojha, D. K., Samal, M. R., Pandey, A. K., et al. 2011, ApJ, 738, 156
- Ortiz-León et al. (2017) Ortiz-León, G. N., Loinard, L., Kounkel, M. A., et al. 2017, ApJ, 834, 141
- Penzias (1981) Penzias, A. A. 1981, ApJ, 249, 518
- Sault et al. (1996) Sault, R. J., Staveley-Smith, L., & Brouw, W. N. 1996, A&AS, 120, 375
- Shu et al. (1987) Shu, F. H., Adams, F. C., & Lizano, S. 1987, ARA&A, 25, 23
- Simon et al. (1995) Simon, M., Ghez, A. M., Leinert, C., et al. 1995, ApJ, 443, 625
- Takakuwa (2003) Takakuwa, S. 2003, NRO Technical Report, No.65
- Vogel et al. (1984) Vogel, S. N., Wright, M. C. H., Plambeck, R. L., & Welch, W. J. 1984, ApJ, 283, 655
- Wannier (1980) Wannier, P. G. 1980, ARA&A, 18, 399
- White et al. (2015) White, G. J., Drabek-Maunder, E., Rosolowsky, E., et al. 2015, MNRAS, 447, 1996
- Wilking et al. (2005) Wilking, B. A., Meyer, M. R., Robinson, J. G., & Greene, T. P. 2005, AJ, 130, 1733
- Wilson et al. (1999) Wilson, C. D., Avery, L. W., Fich, M., et al. 1999, ApJ, 513, L139
- Yu & Chernin (1997) Yu, T., & Chernin, L. M. 1997, ApJ, 479, L63