Collisionless shock acceleration of narrow energy spread ion beams from mixed species plasmas using 1 m lasers
Abstract
Collisionless shock acceleration of protons and C6+ions has been achieved by the interaction of a 1020 W/cm2, 1 m laser with a near-critical density plasma. Ablation of the initially solid density target by a secondary laser allowed for systematic control of the plasma profile. This enabled the production of beams with peaked spectra with energies of 10-18 MeV/a.m.u. and energy spreads of 10-20 with up to 3x10⁹ particles within these narrow spectral features. The narrow energy spread and similar velocity of ion species with different charge-to-mass ratio are consistent with acceleration by the moving potential of a shock wave. Particle-in-cell simulations show shock accelerated beams of protons and C6+ ions with energy distributions consistent with the experiments. Simulations further indicate the plasma profile determines the trade-off between the beam charge and energy and that with additional target optimization narrow energy spread beams exceeding 100 MeV/a.m.u. can be produced using the same laser conditions.
pacs:
I I. Introduction
The ability to study the properties of high energy density matter in the laboratory is expanding our understanding of the physics associated with inertial fusion targets, planetary interiors, and astrophysical systems Kraus et al. (2017); Hurricane et al. (2016); Ross et al. (2017). Laser-produced ion beams have proven an invaluable tool for both creating and probing such high energy density matter Clark et al. (2000); Patel et al. (2003); Dyer et al. (2008); Fernández et al. (2014); Nilson et al. (2006). Traditionally, these beams have been accelerated via the target normal sheath acceleration (TNSA) mechanism which produces a continuous exponentially decreasing energy spectrum Snavely et al. (2000). In the pursuit of new applications and increased precision, significant effort has gone into exploring other schemes to extend the maximum ion energy and reduce the energy spread to 1-10 Tikhonchuk et al. (2005); Bulanov et al. (2008); Esirkepov et al. (2004); Hegelich et al. (2006); Palmer et al. (2011); Henig et al. (2009); Kar et al. (2012); Palaniyappan et al. (2015). Recently, proof-of-principle experiments have shown that such narrow energy spread proton beams, containing particles, can be accelerated up to 20 MeV in tailored near-critical density plasmas via an electrostatic shock wave driven in a hydrogen gas jet plasma by a 10 m CO2 laser Haberberger et al. (2012); Tresca et al. (2015). While these results are promising, CO2 lasers are not commonly available. Furthermore, it is desirable to produce beams with higher charge and particle energy, which generally requires operating at higher densities and intensities. This can only be achieved by using more ubiquitous solid-state high intensity lasers at a wavelength of 1 m.
Here, we report for the first time on collisionless shock acceleration (CSA) experiments with a 1 m laser that produced proton and ion beams with narrow energy spreads E/E of 10-20 centered at 10-18 MeV/a.m.u. and with a total number of particles in these peaks up to . To produce a plasma density profile suitable for CSA, we have used a secondary laser to ablate a Mylar (C10H8O4) foil. For this profile we observed similar velocity distributions of accelerated protons and heavier ions, consistent with the reflection from the moving potential of an electrostatic shock. The number of particles within the narrow distributions of accelerated ions is larger than obtained in previous CSA experimentsHaberberger et al. (2012). Two-dimensional (2D) particle-in-cell (PIC) simulations that model the laser interaction with a CH plasma for the experimental conditions show CSA of multiple ion species with spectra consistent with observations. Analysis of simulation results reveal that the plasma density profile determines the trade-off between energy gain and number of accelerated particles, by controlling the velocities of the shock and of the expanding plasma. This suggests that further control over the density profile could allow beams to be tuned according to application needs.
II II. Collisionless shock formation
The formation of a collisionless electrostatic shock requires the creation of a localized region of higher pressure within a plasma with Silva et al. (2004); Fiuza et al. (2012); Medvedev (2014). The interaction of a high-intensity laser with a near-critical density plasma can efficiently produce these conditionsFiuza et al. (2012). As this region of high pressure expands, it can drive a shock wave with velocity into the surrounding lower pressure plasma. Here is defined in the upstream plasma frame, denotes the shock Mach number, and for the ion sound speed depends on the electron temperature, , the ion mass, , and the ion charge state, , of the plasma. The shock can reflect upstream ions if its electrostatic potential, , is larger than the kinetic energy of the in-flowing ions, i.e. . Provided this criterion is satisfied, the shock can reflect ions of different charge-to-mass () ratios to a velocity . The final ion velocity will result from contributions from both shock reflection and sheath acceleration (which depends on the plasma profile) and can be written as .
To produce high-energy ( 10 MeV/a.m.u.) ion beams with moderate strength shocks (, the plasma needs to be heated to 1 MeV to drive a shock with 0.1 c. Balancing the energy density of the laser with that of the target, can be estimated as Fiuza et al. (2012),
| (1) |
where is the laser pulse duration, is the target thickness, is the electron density, is the critical density for 1 m light and is the normalized vector potential of the laser. At high laser intensity () the coupling of the laser to the target, , can be optimized to values of for a peak electron density near the relativistic critical density Gong et al. (2016). To explore CSA in this high intensity regime, experiments were performed at the Titan laser facility.
III III. Experiment
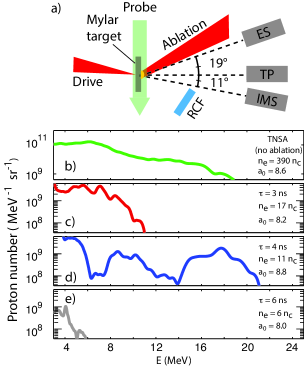
As seen in Fig. 1 a), to produce a near-critical density target, the 0.5 m thick Mylar foil was first irradiated by the 10 ns long, 1 m wavelength ablation laser focused to a diameter of 550 m and an average peak intensity 1.21011 W/cm2. This approach was pursued in order to produce plasmas with peak densities of 10 and lengths m required to obtain T 1 MeV using a drive laser per Eq. (1). The ablation of material creates a density gradient and an associated quasi-uniform sheath field that allows the shock reflected ions to exit the target with their narrow energy spread largely preservedGrismayer et al. (2008); Fiuza et al. (2013). After the target expansion, an high-intensity drive laser, with a wavelength of 1 m and a duration of 1 ps, was focused onto the plasma to generate the shock wave. The longitudinal position of the target was varied by up to 150 m. This changed the full width half maximum (FWHM) of the laser spot from 5-9 m and peak from , respectively.
To optimize the CSA process, the peak plasma density and profile were changed by varying the delay, , between the beginning of the ablation laser and the high-intensity short pulse drive laser. Shadowgraphic measurements of the foil ablationSup , were found to be consistent with radiation hydrodynamic calculations using the code HYDRAMarinak et al. (2001). These calculations indicate that the peak density decreases from 16.7 to 6.1 and the FWHM target thickness increases from 18 to 44 m as was increased from 3 to 6 ns. An imaging magnetic spectrometer (IMS)Chen et al. (2010) was used to measure the accelerated ion spectrum along the axis of laser propagation. The measured proton spectra as a function of delay between the ablation and drive laser are shown in Fig. 1 b-e). With the ablation laser off, the proton spectrum is characteristic of the TSNA mechanism and extends to maximum of 19 MeV (Fig. 1 b)). With the ablation laser on, the delay was then increased on consecutive shots. For ns, Fig. 1 c), the cutoff energy decreases to 11 MeV. This is attributed to the increasing rear scale length of the target, which reduces the TNSA field. Interestingly, at ns, Fig. 1 d) shows that two spectrally narrow and distinct peaks appear at 10 and 18 MeV, respectively, in contrast to the usual TNSA continuum. This suggests an additional acceleration mechanism is present and capable of accelerating narrow distributions of protons to energies comparable to the maximum TNSA cutoff energy. Compared to the unablated foil, at ns, the number of escaping electrons was observed to increase 4Sup .This is consistent with the increased laser coupling and heating required to produce CSA protons. For ns, Fig. 2 e), no protons 5 MeV were observed. These results clearly show an optimal acceleration regime at ns, indicating that the production of narrow energy distributions is sensitive to the plasma density profile at this time.
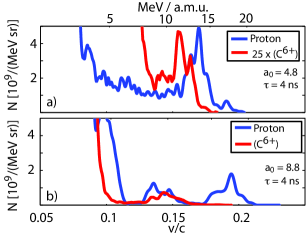
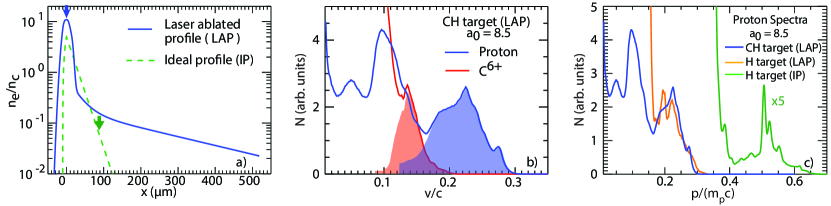
Figure 2 and additional spectra detailed in the supplemental material show that at = 4 ns, spectra with narrow peaks of protons were consistently observed at energies between 7.9 and 17.7 MeV. At this delay, a narrow distribution of heavier ions with a peak velocity within 30 of the proton peak velocity was also consistently seen. The observation of multiple species of ions with different charge-to-mass ratios being accelerated to similar velocities and into narrow distributions is consistent with the reflection and acceleration from a moving potential associated with a collisionless shock and not expected to result from TNSA. Differential filtering of the IMS image plate detector allowed for discrimination between proton and heavier ion spectral featuresSup . Due to having the same Z/A ratio, differentiating between C6+ and O8+ ions using the IMS or TP was not possible. The ion signal is assumed to be comprised predominantly of C6+ ions as the Mylar target has 2.5X more carbon than oxygen ions.
While the production of narrow distributions of protons and ions at similar velocities was consistently observed at a = 4 ns, the spectral shape and peak energy of these distributions was observed to vary shot to shot and to be sensitive to the incident laser spot size. Shot to shot the energy and energy spread of the higher velocity peak was observed to vary between 11.3-17.7 MeV and 8.5-15.8, respectively, as the incident a0 was varied between 8.1 and 8.8. Additionally, as seen in Fig 2 a) and b), at the same incident laser power the spectral distribution of protons was observed to change when the spot size was increased and the incident a0 reduced to 4.8. The variation in energy and spectral shape is thought to arise from differences in laser-plasma coupling and heating. This is influenced by shot to shot variations in the laser focusing and resulting intensity due to the thermal lensing of the laser, the plasma density profile, self-focusing and target alignment. Similar energy variation is common in other high-intensity laser plasma acceleration schemes Fuchs et al. (2005).
Within the FWHM of the proton peaks at 13.5 and 17.7 MeV observed in Fig. 2 a-b), the total number of protons was estimated to be 3.20.9 and 1.0, respectively. Measurements at these conditions show a proton beam divergence of 24∘. The number of accelerated protons observed is substantially higher () than obtained in previous CSA experiments conducted at lower densities and intensities with 10 m wavelength lasers. Moreover, the higher energy, narrow spread, peak shown in Fig. 2 b) contains similar (80) charge to the TNSA beam shown in Fig. 1 b) at the same energy and bandwidth. This shows that CSA can represent a significant advantage for applications requiring narrow energy spread beams, since it would avoid the beam transmission losses and added complexity associated with energy selection techniques of broadband TNSA beams. Experiments using magnetic-field based techniques to reduce the bandwidth of TNSA beams have been limited to 0.1 transmission efficienciesToncian et al. (2006); Schollmeier et al. (2008). Recent simulations of more advanced electro-optics indicate that under optimal conditions the transmission efficiency at 60-200 MeV can approach 5-20 Schillaci et al. (2016a); Masood et al. (2014). At energies between 5 and 8 MeV, the transmission through a set of four quadrapoles was inferred to range between 15-100 Schillaci et al. (2016b).
IV IV. Simulations
In order to better understand how the laser-ablated density profile (LAP) and multi-ion species plasma impact the scaling of ion acceleration with laser intensity, 2D PIC simulations with OSIRIS 3.0 Fonseca et al. (2002) were performed. The simulations modeled the interaction of the drive laser pulse (m, ps, and ) with a CH plasma for the experimentally expected profile obtained with HYDRA at ns (Fig. 3 a)). The LAP has a peak density and a FWHM thickness m, followed by a long low-density exponential profile with a scale-length of m at the rear side. In order to simulate the temporal dynamics of the interaction, a long and narrow simulation box was used that extended 830 m and 10 m in the direction along and transverse to the laser propagation, respectivelysim .
The simulations confirm the formation of an electrostatic shock with , that reflects both protons and ions from the upstream plasma to . Shock reflection starts near the peak density of the plasma (blue arrow in Fig. 3 a)) soon after the laser reaches peak intensity. The sharp change in the density profile near at the rear side of the plasma (where the ablation laser is absorbed) leads to the generation of a localized space-charge electric field. As shock reflected protons ( ions) experience this field they gain an additional velocity . The differences in are mostly due to the different Z/A ratio of the two species. After this region, the typical TNSA field is strongly suppressed due to the long density scale-length, and the maximum velocity remains the same. This leads to a final velocity of the ions within of the proton velocity, similar to the experiments. Moreover, the final particle spectra obtained is also consistent with the experimental observations, showing peaks with energies (and energy spreads) of MeV () for protons and MeV/a.m.u. () for ions (Fig. 3 b)). The energy spread is mostly determined by the temporal evolution of the shock, which slows down due to dissipation by ion reflection Macchi et al. (2012). The (slice) energy spread at each reflection point is significantly smaller, 19 for C6+ and 8 for protons.
Simulations conducted with the same laser and electron density profile, but with a pure hydrogen plasma, show that the spectrum of reflected protons is very similar to the case of a CH plasma (Fig. 3 c)). This indicates that the presence of multiple ion species does not significantly affect the maximum obtainable velocity. However, the presence of multiple ion species is found to change the expansion dynamics downstream of the shock, inducing modulations in the lower energy portion of the spectrum, as seen in Fig. 3 b) and in some of the experimental results. This will be discussed in more detail elsewhere.
The impact of the experimental LAP on particle acceleration was investigated by comparing these results with those obtained in simulations where the same laser interacts with a hydrogen target with the theoretical ideal profile (IP) discussed in Ref. Fiuza et al. (2012). The IP has a sharp linear rise over m on the front side, followed by a exponential profile on the rear side with a scale-length m (Fig. 3 a)). The FWHM thickness of the target is m. For a fixed density profile, it was found that a peak density maximizes the energy gain by CSA. For these conditions, the laser absorption and electron temperature is higher than with the LAP, as described by Eq. (1). An electrostatic shock is formed with . At such high velocity, the shock cannot efficiently reflect the upstream protons initially. In this case, CSA requires the upstream protons to be first accelerated in the controlled TNSA field, which reduces their kinetic energy in the shock frame. For the density scale-length m, protons acquire , before they are reflected by the shock. The final proton beam energy is MeV with (Fig. 3 c)), consistent with the CSA energy scaling Fiuza et al. (2012). While the energy obtained with the IP is significantly higher, the total number of protons contained in the reflected beam is smaller than in the LAP. This is because efficient reflection only begins at the rear side of the target near as seen in Fig. 3 a).
These results indicate that the plasma profile controls both the charge and energy of CSA beams. Laser ablation of thinner foils (0.5 m) may allow the production of plasmas with 5 and L 17.5 m that, with the laser used in these experiments, is estimated to produce 80 MeV proton beams. Simulations indicate that further tuning of the rear-side density scale-length to 20 m would produce proton beams with 100 MeV, but with less charge.
V V. Conclusions
In conclusion, we report on the first experimental evidence of efficient CSA of narrow distributions of protons and heavier ions using a high-intensity 1 m wavelength laser with a peak 8.5. By tuning the plasma profile using laser-ablation, beams with energies up to 18 MeV/a.m.u., energy spreads of , containing up to particles were produced. The number of particles in these distributions was 10 higher than previous CSA work conducted with 10 m wavelength laser systems. These results demonstrate the ability of CSA to efficiently accelerate high yield, narrow distributions of ions to meet the needs of applications. Additionally, the simultaneous acceleration of ion beams with different Z/A ratios to similar velocities offers a promising source for more accurately diagnosing the electromagnetic fields of high-energy-density plasmas. Results from PIC simulations are consistent with the experimental data and reveal that the control of the plasma profile allows the optimization of the beam charge or energy, depending on the application needs. Precise shaping of near-critical density plasma profiles would allow the generation of MeV/a.m.u. with the same laser system. This could be achieved in the future by reducing the foil thickness, by changing the wavelength of the photons used to ablate the target (e.g. x-rays), or by directly fabricating the profile via 3D printing.
We wish to thank H. Chen, and A. Hazi for their support of these experiments, and C. Curry, A. Kemp and C. Roedel for valuable discussions. This work and the use of the Jupiter Laser Facility was performed under the auspices of the U.S. Department of Energy (DOE) under Contract No. DE-AC52-07NA27344, with support from the LDRD Program (15-LW-095). Additional support was provided by U.S. DOE under contract numbers DE- AC02-76SF00515,DE-SC0010064,and DE-NA0001944, the DOE Office of Science, FES under FWP 100237, FWP 100182, FWP 100331 and SCW1575-1, NNSA grant no. DE-NA0002950, NSF grant 1734315, and NSERC grant no. RGPIN-2014-05736. The work at UCLA was supported by NNSA grant DE-NA0003873. The authors acknowledge the OSIRIS Consortium, consisting of UCLA and IST (Portugal) for the use of the OSIRIS 3.0 framework and the visXD framework. Simulations were conducted on Mira (ALCF) through an ALCC award and on Vulcan (LLNL).
References
- Kraus et al. (2017) D. Kraus, J. Vorberger, A. Pak, N. J. Hartley, L. B. Fletcher, S. Frydrych, E. Galtier, E. J. Gamboa, D. O. Gericke, S. H. Glenzer, E. Granados, M. J. MacDonald, A. J. MacKinnon, E. E. McBride, I. Nam, P. Neumayer, M. Roth, A. M. Saunders, A. K. Schuster, P. Sun, T. van Driel, T. Döppner, and R. W. Falcone, Nature Astronomy 1, 606 (2017).
- Hurricane et al. (2016) O. A. Hurricane, D. A. Callahan, D. T. Casey, E. L. Dewald, T. R. Dittrich, T. Döppner, S. Haan, D. E. Hinkel, L. F. Berzak Hopkins, O. Jones, A. L. Kritcher, S. Le Pape, T. Ma, A. G. MacPhee, J. L. Milovich, J. Moody, A. Pak, H. S. Park, P. K. Patel, J. E. Ralph, H. F. Robey, J. S. Ross, J. D. Salmonson, B. K. Spears, P. T. Springer, R. Tommasini, F. Albert, L. R. Benedetti, R. Bionta, E. Bond, D. K. Bradley, J. Caggiano, P. M. Celliers, C. Cerjan, J. A. Church, R. Dylla-Spears, D. Edgell, M. J. Edwards, D. Fittinghoff, M. A. Barrios Garcia, A. Hamza, R. Hatarik, H. Herrmann, M. Hohenberger, D. Hoover, J. L. Kline, G. Kyrala, B. Kozioziemski, G. Grim, J. E. Field, J. Frenje, N. Izumi, M. Gatu Johnson, S. F. Khan, J. Knauer, T. Kohut, O. Landen, F. Merrill, P. Michel, A. Moore, S. R. Nagel, A. Nikroo, T. Parham, R. R. Rygg, D. Sayre, M. Schneider, D. Shaughnessy, D. Strozzi, R. P. J. Town, D. Turnbull, P. Volegov, A. Wan, K. Widmann, C. Wilde, and C. Yeamans, Nat Phys 12, 800 (2016).
- Ross et al. (2017) J. S. Ross, D. P. Higginson, D. Ryutov, F. Fiuza, R. Hatarik, C. M. Huntington, D. H. Kalantar, A. Link, B. B. Pollock, B. A. Remington, H. G. Rinderknecht, G. F. Swadling, D. P. Turnbull, S. Weber, S. Wilks, D. H. Froula, M. J. Rosenberg, T. Morita, Y. Sakawa, H. Takabe, R. P. Drake, C. Kuranz, G. Gregori, J. Meinecke, M. C. Levy, M. Koenig, A. Spitkovsky, R. D. Petrasso, C. K. Li, H. Sio, B. Lahmann, A. B. Zylstra, and H.-S. Park, Phys. Rev. Lett. 118, 185003 (2017).
- Clark et al. (2000) E. L. Clark, K. Krushelnick, J. R. Davies, M. Zepf, M. Tatarakis, F. N. Beg, A. Machacek, P. A. Norreys, M. I. K. Santala, I. Watts, and A. E. Dangor, Phys. Rev. Lett. 84, 670 (2000).
- Patel et al. (2003) P. K. Patel, A. J. Mackinnon, M. H. Key, T. E. Cowan, M. E. Foord, M. Allen, D. F. Price, H. Ruhl, P. T. Springer, and R. Stephens, Phys. Rev. Lett. 91, 125004 (2003).
- Dyer et al. (2008) G. M. Dyer, A. C. Bernstein, B. I. Cho, J. Osterholz, W. Grigsby, A. Dalton, R. Shepherd, Y. Ping, H. Chen, K. Widmann, and T. Ditmire, Phys. Rev. Lett. 101, 015002 (2008).
- Fernández et al. (2014) J. Fernández, B. Albright, F. Beg, M. Foord, B. Hegelich, J. Honrubia, M. Roth, R. Stephens, and L. Yin, Nuclear Fusion 54, 054006 (2014).
- Nilson et al. (2006) P. M. Nilson, L. Willingale, M. C. Kaluza, C. Kamperidis, S. Minardi, M. S. Wei, P. Fernandes, M. Notley, S. Bandyopadhyay, M. Sherlock, R. J. Kingham, M. Tatarakis, Z. Najmudin, W. Rozmus, R. G. Evans, M. G. Haines, A. E. Dangor, and K. Krushelnick, Phys. Rev. Lett. 97, 255001 (2006).
- Snavely et al. (2000) R. A. Snavely, M. H. Key, S. P. Hatchett, T. E. Cowan, M. Roth, T. W. Phillips, M. A. Stoyer, E. A. Henry, T. C. Sangster, M. S. Singh, S. C. Wilks, A. MacKinnon, A. Offenberger, D. M. Pennington, K. Yasuike, A. B. Langdon, B. F. Lasinski, J. Johnson, M. D. Perry, and E. M. Campbell, Phys. Rev. Lett. 85, 2945 (2000).
- Tikhonchuk et al. (2005) V. T. Tikhonchuk, A. A. Andreev, S. G. Bochkarev, and V. Y. Bychenkov, Plasma Physics and Controlled Fusion 47, B869 (2005).
- Bulanov et al. (2008) S. S. Bulanov, A. Brantov, V. Y. Bychenkov, V. Chvykov, G. Kalinchenko, T. Matsuoka, P. Rousseau, S. Reed, V. Yanovsky, D. W. Litzenberg, K. Krushelnick, and A. Maksimchuk, Phys. Rev. E 78, 026412 (2008).
- Esirkepov et al. (2004) T. Esirkepov, M. Borghesi, S. V. Bulanov, G. Mourou, and T. Tajima, Phys. Rev. Lett. 92, 175003 (2004).
- Hegelich et al. (2006) B. M. Hegelich, B. J. Albright, J. Cobble, K. Flippo, S. Letzring, M. Paffett, H. Ruhl, J. Schreiber, R. K. Schulze, and J. C. Fernández, Nature 439, 441 (2006).
- Palmer et al. (2011) C. A. J. Palmer, N. P. Dover, I. Pogorelsky, M. Babzien, G. I. Dudnikova, M. Ispiriyan, M. N. Polyanskiy, J. Schreiber, P. Shkolnikov, V. Yakimenko, and Z. Najmudin, Phys. Rev. Lett. 106, 014801 (2011).
- Henig et al. (2009) A. Henig, S. Steinke, M. Schnürer, T. Sokollik, R. Hörlein, D. Kiefer, D. Jung, J. Schreiber, B. M. Hegelich, X. Q. Yan, J. Meyer-ter Vehn, T. Tajima, P. V. Nickles, W. Sandner, and D. Habs, Phys. Rev. Lett. 103, 245003 (2009).
- Kar et al. (2012) S. Kar, K. F. Kakolee, B. Qiao, A. Macchi, M. Cerchez, D. Doria, M. Geissler, P. McKenna, D. Neely, J. Osterholz, R. Prasad, K. Quinn, B. Ramakrishna, G. Sarri, O. Willi, X. Y. Yuan, M. Zepf, and M. Borghesi, Phys. Rev. Lett. 109, 185006 (2012).
- Palaniyappan et al. (2015) S. Palaniyappan, C. Huang, D. C. Gautier, C. E. Hamilton, M. A. Santiago, C. Kreuzer, A. B. Sefkow, R. C. Shah, and J. C. Fernández, 6, 10170 EP (2015).
- Haberberger et al. (2012) D. Haberberger, S. Tochitsky, F. Fiuza, C. Gong, R. A. Fonseca, L. O. Silva, W. B. Mori, and C. Joshi, Nat Phys 8, 95 (2012).
- Tresca et al. (2015) O. Tresca, N. P. Dover, N. Cook, C. Maharjan, M. N. Polyanskiy, Z. Najmudin, P. Shkolnikov, and I. Pogorelsky, Phys. Rev. Lett. 115, 094802 (2015).
- Silva et al. (2004) L. O. Silva, M. Marti, J. R. Davies, R. A. Fonseca, C. Ren, F. S. Tsung, and W. B. Mori, Phys. Rev. Lett. 92, 015002 (2004).
- Fiuza et al. (2012) F. Fiuza, A. Stockem, E. Boella, R. A. Fonseca, L. O. Silva, D. Haberberger, S. Tochitsky, C. Gong, W. B. Mori, and C. Joshi, Phys. Rev. Lett. 109, 215001 (2012).
- Medvedev (2014) Y. V. Medvedev, Plasma Physics and Controlled Fusion 56, 025005 (2014).
- Gong et al. (2016) C. Gong, S. Y. Tochitsky, F. Fiuza, J. J. Pigeon, and C. Joshi, Phys. Rev. E 93, 061202 (2016).
- Grismayer et al. (2008) T. Grismayer, P. Mora, J. C. Adam, and A. Héron, Phys. Rev. E 77, 066407 (2008).
- Fiuza et al. (2013) F. Fiuza, A. Stockem, E. Boella, R. A. Fonseca, L. O. Silva, D. Haberberger, S. Tochitsky, W. B. Mori, and C. Joshi, Physics of Plasmas 20, 056304 (2013).
- (26) See supplemental material .
- Marinak et al. (2001) M. M. Marinak, G. D. Kerbel, N. A. Gentile, O. Jones, D. Munro, S. Pollaine, T. R. Dittrich, and S. W. Haan, Phys. Plasmas 8, 2275 (2001).
- Chen et al. (2010) H. Chen, A. U. Hazi, R. van Maren, S. N. Chen, J. Fuchs, M. Gauthier, S. L. Pape, J. R. Rygg, and R. Shepherd, Review of Scientific Instruments 81, 10D314 (2010).
- Fuchs et al. (2005) J. Fuchs, P. Antici, E. d’Humières, E. Lefebvre, M. Borghesi, E. Brambrink, C. A. Cecchetti, M. Kaluza, V. Malka, M. Manclossi, S. Meyroneinc, P. Mora, J. Schreiber, T. Toncian, H. Pépin, and P. Audebert, Nat. Phys. 2, 48 (2005).
- Toncian et al. (2006) T. Toncian, M. Borghesi, J. Fuchs, E. d’Humières, P. Antici, P. Audebert, E. Brambrink, C. A. Cecchetti, A. Pipahl, L. Romagnani, and O. Willi, Science 312, 410 (2006).
- Schollmeier et al. (2008) M. Schollmeier, S. Becker, M. Geißel, K. A. Flippo, A. Blažević, S. A. Gaillard, D. C. Gautier, F. Grüner, K. Harres, M. Kimmel, F. Nürnberg, P. Rambo, U. Schramm, J. Schreiber, J. Schütrumpf, J. Schwarz, N. A. Tahir, B. Atherton, D. Habs, B. M. Hegelich, and M. Roth, Phys. Rev. Lett. 101, 055004 (2008).
- Schillaci et al. (2016a) F. Schillaci, M. Maggiore, L. Andó, G. Cirrone, G. Cuttone, F. Romano, V. Scuderi, L. Allegra, A. Amato, G. Gallo, G. Korn, R. Leanza, D. Margarone, G. Milluzzo, and G. Petringa, Journal of Instrumentation 11, P08022 (2016a).
- Masood et al. (2014) U. Masood, M. Bussmann, T. E. Cowan, W. Enghardt, L. Karsch, F. Kroll, U. Schramm, and J. Pawelke, Applied Physics B 117, 41 (2014).
- Schillaci et al. (2016b) F. Schillaci, L. Pommarel, F. Romano, G. Cuttone, M. Costa, D. Giove, M. Maggiore, A. Russo, V. Scuderi, V. Malka, B. Vauzour, A. Flacco, and G. Cirrone, Journal of Instrumentation 11, T07005 (2016b).
- Fonseca et al. (2002) R. A. Fonseca, L. O. Silva, F. S. Tsung, V. K. Decyk, W. Lu, C. Ren, W. B. Mori, S. Deng, S. Lee, T. Katsouleas, and J. C. Adam (Springer Berlin Heidelberg, Berlin, Heidelberg, 2002) pp. 342–351.
- (36) The simulation resolved this domain with cells, used a time step fs, 16 particles/species/cell, cubic particle shapes, and ran for ps. The boundary conditions were open/absorbing in the longitudinal direction and periodic transversely .
- Macchi et al. (2012) A. Macchi, A. S. Nindrayog, and F. Pegoraro, Phys. Rev. E 85, 046402 (2012).