Reading the structure of amorphous materials from diffraction patterns and neighbor distribution functions
Abstract
An exact analytical expression for the static structure factor in disordered materials is derived from Fourier transformed neighbor distribution decompositions in real space, and permits to reconstruct the function in an iterative fashion. The result is successfully compared to experimental data of archetypal glasses or amorphous materials (GeS2, As2Se3, GeTe), and links quantitatively knowledge of structural information on short and intermediate -range order with the motifs found on the diffraction patterns in reciprocal space. The approach furthermore reveals that only a limited number of neighbor shells is sufficient to reasonably describe the structure factor for 2 Å-1. In the limit of the high momentum transfer, the oscillation characteristics of the interference function are related with new informations on the short-range order of disordered materials.
Diffraction methods form the basis of our common understanding of materials. The determination of crystal structures has provided a foundation for considerable characterization of chemical bonding, cohesion, and functionalities in solid- or liquid-state science with applications in e.g. physico-chemistry, biology and geology. In contrast to crystals which display well-defined diffraction patterns and sharp Bragg peaks induced by the periodic arrangement of atoms, glasses and liquids exhibit broad and diffuse peaks that result from their intrinsic disordered structure. For such materials and with changing momentum transfer , there have been many attempts to extract from the relevant resulting coherent diffraction function, that is, the static structure factor , information on short- (SRO) and intermediate-range order (IRO) and a conventional means uses probabilistic atomic distribution functions to infer the microscopic structure review .
Within this framework, the key quantity is the pair correlation function which measures the probability of finding an atom at a position relative to a reference atom taken to be at the origin hansen . Relating in detail the real space structure properties encoded in and the shape and peak positions or amplitudes of the measured remains a challenging task but has inspired a certain recent number of insightful contributions in the field contrib1 ; contrib2 ; contrib3 ; contrib4 , many years after the early attempts of Warren warren and Bernal bernal . In fact, only certain specific signatures can be detected and related to some structural features. The first sharp diffraction peak (FSDP) at low momentum transfer (1 Å-1) reveals for instance some ordering at intermediate length scales elliott ; bychkovfsdp that might manifest in e.g. voids and depends on pressure and temperature. Similarly, principal peak (PP) characteristics are thought to be linked to the presence of extended range order Nature_salmon ; salmon2 . Such features continue, however, to be discussed given that the established correlations remain essentially at a qualitative level and are largely material dependent.
Here we show that with the assistance of computer simulated structural models of glasses, the decomposition into neighbor distribution functions in real space permits to reconstruct as a series expansion the structure factor, and an exact analytical expression for is obtained from Fourier transformation. Such expressions exist for imperfect crystals with weak disorder guinier but here it is the first time that a similar approach is used for disordered materials such as glasses. This not only links quantitatively information on ordering with characteristics of the structure factor , but also reveals what aspects of structure directly influence tyical features observed experimentally at different momentum transfer. We first concentrate on the amorphous system As2Se3 before investigating the degree of generality of the findings on other chalcogenide glasses such as GeS2 and GeTe (see Supplementary materials section suppl ). The high limit of the analytical expression leads to another exact result that permits to fully characterize the typical oscillations observed in the experimental interference function =[.
The starting point of the approach uses the definition hansen of the structure factor given by :
| (1) |
where is the atomic number density. The system is considered as being isotropic and homogeneous so that integration can be applied on the vector norms only, this being particularly adapted for disordered systems simulated in a cubic box of size down to wavelength somewhat larger than . It is well known however that equ. (1) fails to describe properly crystalline or lamellar phases, as recently reemphasized in a pedagogical fashion struct .
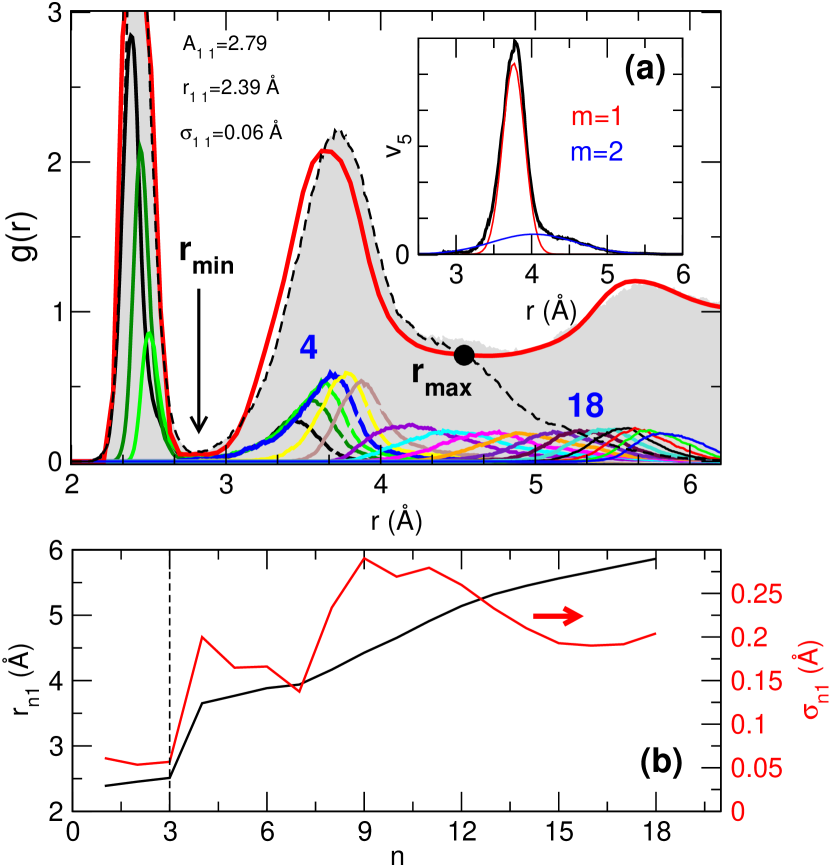
We propose that the pair distribution function can be decomposed into a series of neighbor distribution functions (1 N) as exemplified in different liquids and glasses neigh1 ; bychkov ; neigh3 (Fig. 1a). For each atom, distributions are constructed from molecular dynamics (MD) based trajectories by sorting the neighbours according to the bond length. We assume that such distribution functions can be reconstructed by Gaussians with amplitudes , mean distances (first moments) and variances . Note that the index (1) signals that up to Gaussian functions might be used to fit a given distribution function so that the total number of Gaussians is +-1. In the forthcoming, applications to different systems have shown that not more than =3 Gaussians are needed to reproduce accurately a function calculated from the MD simulations, and in most of the situations is sufficient, especially at short distance (see below).
Using such distributions, a direct calculation shows that equ. (1) can be exactly computed and leads to the interference function:
where and represent the Voigt functions voigt for the Gaussian component associated to the neighbour distribution :
and Lnm being also equal to the real and imaginary parts of the Fadeeva function expansion with defined from the complex error function :
| (5) |
In the thermodynamic limit, equation (Reading the structure of amorphous materials from diffraction patterns and neighbor distribution functions) is an exact result and its validity can be checked for a variety of disordered systems with increasing .
First, we examine the convergence of the series expansion (equ. (Reading the structure of amorphous materials from diffraction patterns and neighbor distribution functions)) on amorphous As2Se3 but verify before that the pair correlation function can be decomposed into such Gaussian neighbour functions . Figure 1a shows a calculated pair correlation function obtained from First Principles MD simulations (top) asse which reproduces very accurately experimental results from neutron scattering in real space salmon1 . The analysis up to 18 neighbors shows that corresponding neighbor functions can be decomposed into Gaussian distributions (inset) with both and increasing with (Fig. 1b), and a sharp increase for both quantities at signals the 3-fold coordinated As based network structure asse . Such parameters are then used to recalculate the total structure factor using equ. (Reading the structure of amorphous materials from diffraction patterns and neighbor distribution functions). Note that because there is an overlap between the different functions , at fixed the decomposition of is only valid up to (broken curve Fig. 1a). For a fixed and , additional neighbors are indeed missing (N+1,N+2,…) in order to have exactly , and this defines a minimal momentum transfer for the validity of equ. (Reading the structure of amorphous materials from diffraction patterns and neighbor distribution functions).
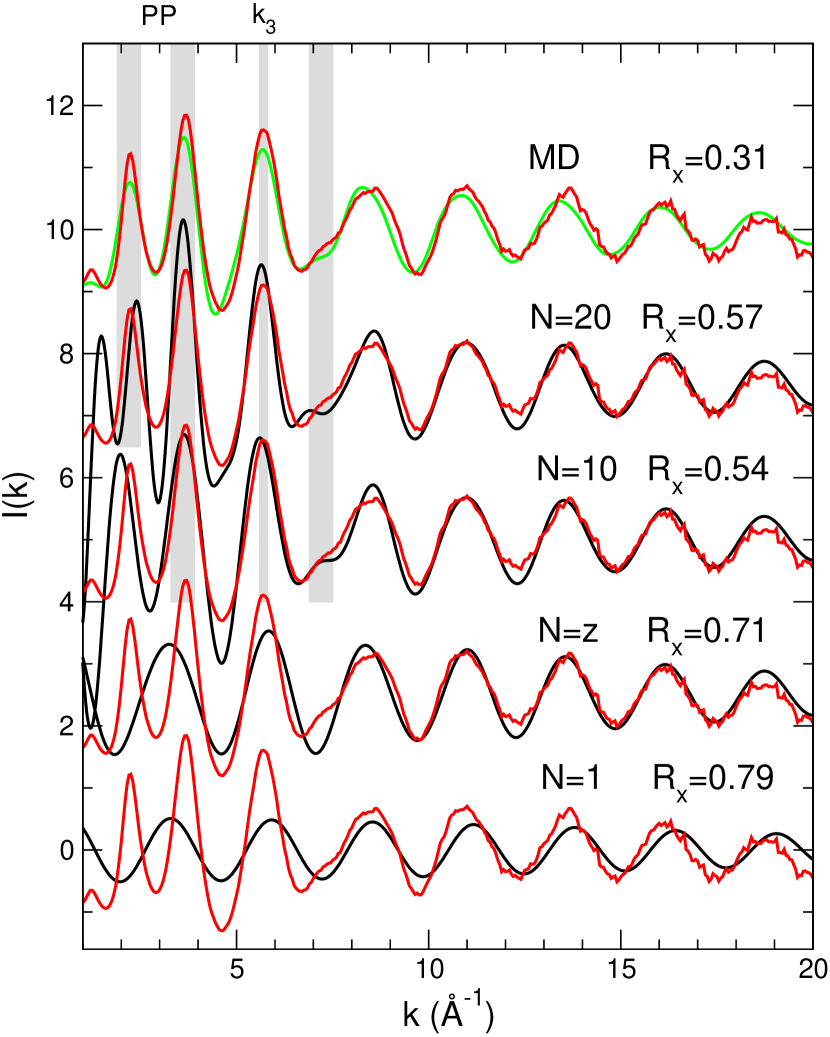
Figure 2 shows the obtained results with increasing for the interference function . The latter permits to blow up the oscillations at large momentum transfer in order to check for the accuracy of the series expansion (Reading the structure of amorphous materials from diffraction patterns and neighbor distribution functions). Quite obviously, a single neighbor decomposition =1 (using the parameters given in Fig. 1b) leads only to a poor reproduction of , including the oscillations at large . Instead, equ. (Reading the structure of amorphous materials from diffraction patterns and neighbor distribution functions) reveals that such oscillations can be only obtained i) for multiple Gaussians having slightly different mean distances and ii) when the number of Gaussians satisfies +-1=, being related to the coordination number of the system and determined from the number of functions found for with the minimum of (three in Fig. 1a). In the present case, a calculation of the coordination number from such functions using the condition +-1 leads to =2.33 which is compatible with experiments (=2.30 salmon1 ). One also notices that for 7 Å-1 any further evolution with increasing is barely visible up to =20 (Fig. 2), the contributions with larger in this range of momentum transfer leading to 0 suppl . This results from the mathematical properties of the Fadeeva function which lead to i) for the considered parameters and range of momentum transfer , and ii) to a rapid decay to zero of with , this effect being even enhanced with increasing due to the jump observed between first and second shell of neighbors (e.g. =3 in Figure 1b). As a consequence, we arrive to the mathematical conclusion that the large behaviour of is dominated by the first coordination shell or SRO of the system.
Using the series expansion, it is now insightful to analyze the experimental diffraction pattern salmon1 with growing in order to extract information on SRO and IRO elements. We find that the PP region (2-5 Å-1) depends on , a near convergence being achieved for 20 and has now a profile that is similar to the one calculated from MD asse , albeit the secondary PP at 3.5 Å-1 is already correctly reproduced (position, amplitude) for =10. The third prominent peak at =5.8 Å-1 is obviously related to first and second neighbor shell atoms () given the negligible contributions to for 1020 suppl . The decomposition also reveals that a typical shoulder peak observed at 7.2 Å-1 can be unambiguously assigned with second shell correlations because it is absent for , has a significant contribution for 47 and becomes negligibly small for larger suppl . A standard means quantifying more precisely the accuracy of the approach builds on the Wright parameter which evaluates a squared deviation between experimental and theoretical data wright . Corresponding numbers are given in Fig. 2. Here, the increase of leads to a decrease of (albeit almost constant between =10 and 20), thus indicating that the agreement of equ. (Reading the structure of amorphous materials from diffraction patterns and neighbor distribution functions) should continuously improve with growing . As a final comment, one should note that 5.64 Å for =20 (and = 1.1 Å-1). The reproduction of the FSDP region (1.5 Å-1) might be investigated but important oscillations remain for each contributions (20) so that a near convergence of equ. (Reading the structure of amorphous materials from diffraction patterns and neighbor distribution functions) is not achieved for this range of momentum transfer.
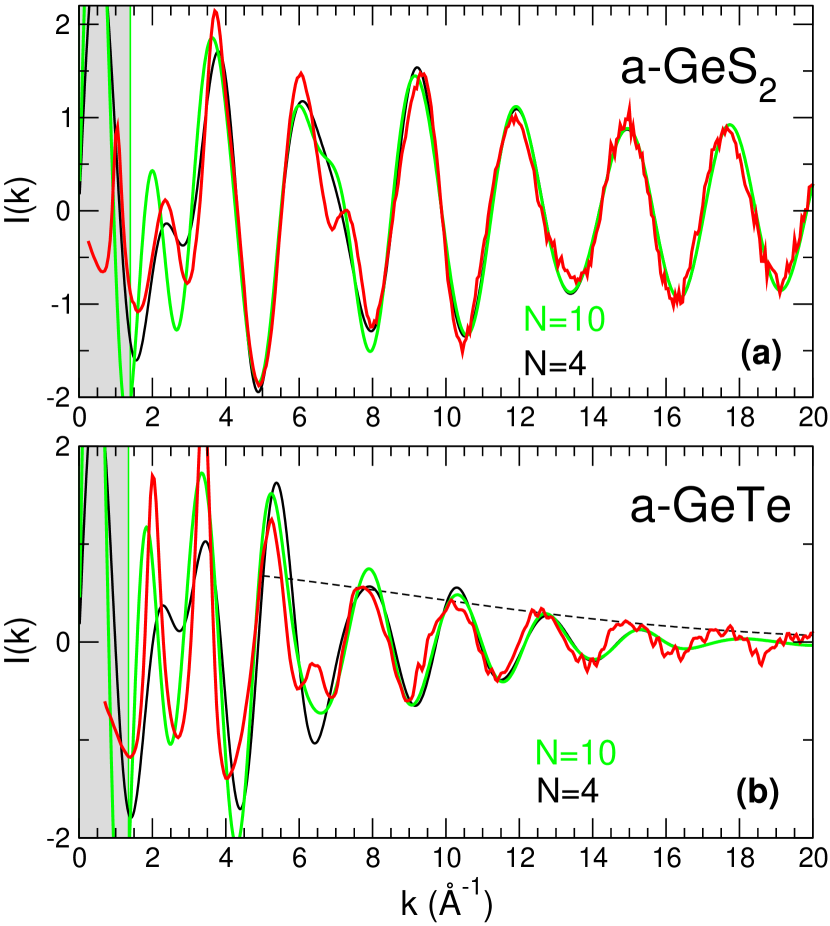
The degree of generality of equ. (Reading the structure of amorphous materials from diffraction patterns and neighbor distribution functions) can now be verified for other systems such as amorphous GeS2 and GeTe. Figure 3 shows the obtained results for the interference function for two expansions (=4 and 10). A close inspection reveals that the series expansion (equ. (Reading the structure of amorphous materials from diffraction patterns and neighbor distribution functions)) is largely material dependant because a large domain can be described only from the first neighbors (=4) in GeS2 whereas this is not the case for GeTe. Note that the quality of the MD simulations is nearly the same, as detected from the reproduction of the pair correlation function suppl . However, the slight shift between theory and experiments occuring at large in a-GeTe is indicative of the well-known bond length mismatch as theory usually overestimates the Ge-Te bond distance gete_vdw with respect to experiments ghezzi . For this system, the two peaks of the PP region (1.8-4 Å-1) is conveniently described by second shell neighbor distributions (=10).
An exact expression for the high momentum transfer limit can be obtained by performing an expansion suppl of the Fadeeva function expansion (equ. (Reading the structure of amorphous materials from diffraction patterns and neighbor distribution functions)) at , and behaves as :
| (6) |
where the terms beyond the first shell are negligible because of the jump increase of , and furthermore (single Gaussians for a given ). If one also assumes that is nearly constant for the first shell of neighbors (, Fig. 1b) and by convenience, one obtains the compact form :
| (7) |
| System | (Å) | (Å) | Reference |
|---|---|---|---|
| a-As2Se3 | 2.370.17 | 2.39 | salmon1 |
| a-GeS2 | 2.220.16 | 2.21 | salmon2 |
| a-GeSe2 | 2.320.04 | 2.36 | Nature_salmon |
| a-GeTe | 2.660.07 | 2.61 | ghezzi |
| l-GeTe4 (820 K) | 2.680.04 | 2.73 | prb2014 |
| l-H2O (300 K) | 2.800.15 | 2.81 | sope |
| l-Te (623 K) | 2.680.05 | 2.77 | bychkov |
where one has assumed that increases linearly in the first shell (, Fig. 1b) where is a bond distance increment (typically =0.06 Å) and is the average bond distance. Given the value of the different atomic parameters, the arguments of the trigonometric functions have the property so that the periodicity of the interference function at large is dominated by = and connects to the SRO characteristics (average first neighbor distance) of the material. Corresponding results determined from experimental data are given in Table 1 and provide a good agreement with the distances that are directly obtained from the principal peak position of the measured pair correlation function . The modulation in equ. (7) has a periodicity of = which provides a measure of both the coordination number and but such a modulation is barely visible from the considered range (Fig. 3). The exponential decay provides information on the spatial extent of the neighbor distributions and also a measure of the rigidity of the SRO geometrical units because a small value will induce a small bond variability. Qualitatively, the decay of for amorphous GeTe (Fig. 3) can now be linked with the presence of more softer units which leads to larger values for as also independently verified from the calculated Ge-centred bond angle distribution which exhibits a broader distribution around 109∘, as compared to selenides or sulphides gete_vdw . Using equ. (7), a fit to the data at large at the maximum of the oscillations up to the maximal available -range (20-35 Å-1) salmon1 ; salmon2 ; ghezzi leads to =0.098 Å, 0.063 Å, 0.12 Å for As2Se3, GeS2, GeTe respectively, smaller than the one performed on the experimental data of water (=0.163 Å, sope ). An increased exponential decay of (equ. (7)) is, indeed, visible in the liquid state bychkov ; prb2014 ; sope , and is driven by the larger value of induced by the increased atomic motion which broadens the typical peaks of the pair correlation function.
In the low limit, a similar expansion of equ. (Reading the structure of amorphous materials from diffraction patterns and neighbor distribution functions) permits to access to the long wavelength limit (0) and that can be expanded from equs. (Reading the structure of amorphous materials from diffraction patterns and neighbor distribution functions) and (Reading the structure of amorphous materials from diffraction patterns and neighbor distribution functions).
where, by virtue of the definition of from number fluctuations hansen , it is only valid in the thermodynamic limit () thorpe ; mousseau .
In summary, we have shown that the numerical decomposition of the pair distribution function into neighbor distribution functions permits to reconstruct the structure factor as a series expansion, in a fashion that bears similarities with the pioneering work on crystals with weak disorder warren ; bernal ; guinier . Results not only indicate that a few shells of neighbors ( 20 atoms) are sufficient in order to describe over extended ranges in momentum transfer, they also provide a direct link between typical features observed in reciprocal space and the neighbour rank (i.e. ) which should certainly help for an improved analysis of experimental diffraction patterns of glasses. It would certainly be interesting to extend such an analysis to partial correlations and to other typical glass-forming materials or liquids. Work in this direction is in progress.
Acknowledgements : The author thanks C. Benmore, E. Bychkov, L. Cormier, G.J. Cuello, P.S. Salmon and A. Zeidler for useful discussions and for sharing their experimental data. French HPC Center ROMEO of Université Reims Champagne-Ardenne is acknowledged for supercomputing access.
References
- (1) H.E. Fischer, A.C. Barnes, P.S. Salmon, Rep. Progr. Phys. 69, 233 (2006).
- (2) J.P. Hansen, I.R. McDonald, Theory of simple liquids, Elsevier (2006).
- (3) C. Steimer, M V. Coulet, W. Welnic, H. Dieker, R. Detemple, C. Bichara, B. Beuneu, J. P. Gaspard, and M. Wuttig, Adv.Mater. 20, 4535 (2008).
- (4) S. Kohara, P.S. Salmon, Adv. Phys. X 1, 640 (2016).
- (5) M.J. Cliffe, M.T. Dove, D.A. Drabold, A.L. Goodwin Phys. Rev. Lett. 104, 125501 (2010)
- (6) A. Pandey, P. Biswas, D.A. Drabold, Sci. Reports 6, 33731 (2016).
- (7) B.E. Warren, J. Appl. Phys. 8, 645 (1937).
- (8) J.D. Bernal and R.H. Fowler, J. Chem. Phys. 1, 515 (1933).
- (9) S. R. Elliott, Nature (London) 354, 445 (1991)
- (10) E.Bychkov, C.J. Benmore, D.L. Price, Phys. Rev. B 72, 172107 (2005).
- (11) P.S. Salmon, R.A. Martin, P.E. Mason, G.J. Cuello, Nature 435, 75 (2005).
- (12) A. Zeidler, W. E. Drewitt, P. S. Salmon, A. C. Barnes, W. A. Crichton, S. Klotz, H. E. Fischer, C. J. Benmore, S. Ramos, and A. C. Hannon, J. Phys.: Condens. Matter 21, 474217 (2006).
- (13) A. Guinier, X-ray diffraction, W.H. Freeman (London, 1963).
- (14) see Supplementary materials section
- (15) K. Zhang, cond-mat arXiv: 1606.03610v2
- (16) M. Micoulaut, C. Otjacques, J-Y. Raty, C. Bichara, Phys. Rev. B 81, 174206 (2010).
- (17) J. Akola, R.O. Jones, S. Kohara, T. Usuki, E. Bychkov, Phys. Rev. B 81, 094202 (2010).
- (18) J.-Y. Raty, C. Otjacques, J. P. Gaspard, and C. Bichara, Solid State Sci. 12, 193 (2010).
- (19) S. Penner, Quantum molecular spectrum and gas emissivities (Addison Wesley, Reading, 1959).
- (20) S.M. Abrarov, B.M. Quine, J. Math. Res. 7, 44 (2014).
- (21) M. Bauchy, M. Micoulaut, M. Boero, C. Massobrio, Phys. Rev. Lett. 110, 165501 (2013).
- (22) S. Xin, J. Liu, P.S. Salmon, Phys. Rev. B 78, 064207 (2008).
- (23) A.C. Wright, J. Non-Cryst. Solids 159, 264 (1993).
- (24) G. E. Ghezzi, J.-Y. Raty, S. Maitrejean, A. Roule, E. Elkaim, and F. Hippert, Appl. Phys. Lett. 99, 151906 (2011).
- (25) M. Micoulaut, A. Piarristeguy, H. Flores-Ruiz, A. Pradel, Phys. Rev. B 96, 184204 (2017).
- (26) M. Micoulaut, M.-V. Coulet, A. Piarristeguy, M.R. Johnson, G. Cuello, C. Bichara, J.-Y. Raty, H. Flores-Ruiz, A. Pradel, Phys. Rev B 89, 174205 (2014).
- (27) L.B. Skinner, M. Galib, J.L. Fulton, C.J. Mundy, J.B. Parise, V.-T. Pham, G.K. Schenter, and C.J. Benmore, J. Chem. phys. 144, 134504 (2016).
- (28) A.M.R. de Graf, M.F. Thorpe, Acta Cryst. A 66, 22 (2010).
- (29) G.T. Barkema, N. Mousseau, Phys. rev. B 62, 4985 (2000).