wreich@mpifr-bonn.mpg.de
22institutetext: Department of Astronomy, Yunnan University, and Key Laboratory of Astroparticle Physics of Yunnan Province, Kunming, 650091, People’s republic of China
\vs\noReceived 20XX Month Day; accepted 20XX Month Day
Polarised radio emission associated with HESS J1912+101
Abstract
The shell-type TeV source HESS J1912+101 was tentatively identified as an old supernova remnant, but is missing counterparts at radio and other frequencies. We analysed the Sino-German Urumqi 6 cm survey and the Effelsberg 11 cm and 21 cm surveys to identify radio emission from HESS J1912+101 to clarify the question of a supernova origin. We find a partial shell of excessive polarisation at 6 cm at the periphery of HESS J1912+101. At 11 cm, its polarised emission is faint and suffers from depolarisation, while at 21 cm, no related polarisation is seen. We could not separate the shell’s total intensity signal from the confusing intense diffuse emission from the inner Galactic plane. However, a high-percentage polarisation of the shell’s synchrotron emission is indicated. Our results support earlier suggestions that HESS J1912+101 is an old supernova remnant. The synchrotron emission is highly polarised, which is typical for evolved supernova remnants of low surface-brightness.
keywords:
Radio continuum: ISM – ISM: individual objects: HESS J1912+101 – ISM: magnetic fields1 Introduction
SNR shock-fronts are major cosmic-ray acceleration sites in the Galaxy, where X-ray and TeV-emission indicates acceleration up to very high energies. The catalogue of Galactic supernova remnants (SNRs) by Green (2017) currently lists 295 objects. From the known SNRs, only a very small fraction is not visible in the radio range. Estimates of the total number of existing SNRs in the Galaxy predict about three times more objects than known today (Li et al. 1991; Tammann et al. 1994), which results from observational selection effects. Compact, young SNRs at large distance and evolved, faint, extended objects are hidden in the intense emission along the Galactic plane, where most SNRs are located. In recent years, some TeV emitting SNR candidates were discovered by HESS with no or faint counterparts in the X-ray or the radio range (H. E. S. S. Collaboration et al. 2018) indicating a preference for high-energy cosmic rays, which is unexpected. With increasing sensitivity, TeV telescopes will likely find more such objects. Their emission or upper limits at other wavelenths is needed to understand these sources.
HESS J1912+101 is an extended TeV object first reported by Aharonian et al. (2008), and recently, with more sensitive data, was shown to resemble a thick shell-type object (Puehlhofer et al. 2015; Gottschall et al. 2017; H. E. S. S. Collaboration et al. 2018). HESS J1912+101 is located in the Galactic plane with Galactic coordinates of at its centre, which means a Galactic designation G44.46-0.13. The shape is slightly elliptical with an extent of approximately . HESS J1912+101 was tentatively interpretated as an old SNR (Puehlhofer et al. 2015; Gottschall et al. 2017; H. E. S. S. Collaboration et al. 2018), although this interpretation remains inconclusive because of missing signatures at other wavelengths.
Recently, Su et al. (2017) supported the SNR interpretation for HESS J1912+101 based on the identification of associated shocked molecular gas and high-velocity HI. Su et al. (2017) derived a distance of 4.1 kpc to HESS J1912+101. These authors have also analysed the spectrum of HESS J1912+101 and used the model of Yamazaki et al. (2006) for the emission of TeV -rays from evolved SNRs to estimate its radio emission. This model predicts a high ratio of TeV to radio flux density for year old SNRs. Thus, Su et al. (2017) estimated a 1.4 GHz flux density of HESS J1912+101 in the range of 0.1 Jy to 0.7 Jy. For the putative radio shell of HESS J1912+101 this means a surface brightness at 1 GHz below Wm-2Hz-1sr-1, which is among the lowest SNR surface brightness values currently known. Such faint SNRs were all identified in low-emission areas, either well outside of the Galactic plane, e.g. G181.1+9.5 (Kothes et al. 2017), G156.2+5.7 (Reich et al. 1992; Xu et al. 2007), G65.2+5.7 (Reich et al. 1979; Xiao et al. 2009) or in the Galactic anticentre region, e.g. G152.4-2.1 and G190.9-2.2 (Foster et al. 2013) or G178.2-4.2 (Gao et al. 2011). As already mentioned, these faint SNRs are extremely difficult to find as discrete shell-type sources within the high level of confusing diffuse emission in the inner Galactic plane. Indeed, associated radio synchrotron emission has not been identified for HESS J1912+101 from available VLA continuum surveys (Puehlhofer et al. 2015; H. E. S. S. Collaboration et al. 2018). A possible association with the SNR candidate from the Clark Lake 30.9 MHz survey, G44.6+0.1, with a quoted flux density of 19 Jy (Kassim 1988b, a; Gorham 1990) was discussed by H. E. S. S. Collaboration et al. (2018). This Clark Lake source has no counterpart matching in strength and extent at any other radio frequency, what raises doubts on its reality.
The known faint low-surface brightness SNRs often show a very high percentage polarisation of the order of 50% or higher. Polarisation suffers less from confusion than total intensities, but depolarisation lowers the polarised signal from SNRs if they are too far away, the observing frequency is not high enough, or the angular resolution is too coarse. It is therefore of interest to check the area of HESS J1912+101 for possibly related polarised radio emission as an alternative to settle its SNR identification by the synchrotron emission process.
2 Data extraction
2.1 The Urumqi 6 cm and the WMAP K-band survey
We make use of the Sino-German 6 cm (4800 MHz) polarisation survey of the Galactic plane, which is the ground-based survey at the highest frequency currently available (Han et al. 2015). The survey was carried out with the Urumqi 25-m radio telescope of Xinjiang Astronomical Observatories, Chinese Academy of Sciences, between 2004 and 2009 and covers the northern Galactic plane for longitudes from to and latitudes of . The angular resolution of the survey is 95. The survey’s concept, its observation and the reduction and calibration procedures were discussed in some detail by Sun et al. (2007). The survey was published in three sections by Gao et al. (2010); Xiao et al. (2011); Sun et al. (2011). The Urumqi 6 cm survey maps are available for download 111http://zmtt.bao.ac.cn/6cm/. 6 cm flux densities of 3823 compact sources were published by Reich et al. (2014).
The 6 cm data of the area around HESS J1912+101 were extracted from the Urumqi survey section published by Sun et al. (2011), where we re-calculated the absolute polarisation level for the Urumqi data by using the meanwhile available 9-year release of the WMAP K-band 1.3 cm survey (Bennett et al. 2013) following the procedure described by Sun et al. (2007) and using the spectral indices for extrapolation by Sun et al. (2011). The sensitivity for this survey section is 1 mK Tb for total intensities and 0.5 mK Tb for polarised intensities. All Urumqi 6 cm survey maps or selected fields in Galactic or Equatorial coordinates with or without 9-year WMAP polarisation corrections are available from the MPIfR survey sampler 222http://www.mpifr-bonn.mpg.de/survey.html.
We also use the low-resolution WMAP K-band (22.8 GHz) data (Bennett et al. 2013) to directly show the polarisation properties in the HESS J1912+101 area almost free from Faraday rotation effects.
2.2 The Effelsberg 11 cm survey
We have used data from the Effelsberg 11 cm (2695 MHz) inner Galactic plane survey (Reich et al. 1984, 1990) and the polarisation maps (Junkes et al. 1987; Duncan et al. 1999) for a search of related radio emission in the field of HESS J1912+101. The Effelsberg 11 cm survey has an angular resolution of 43, a rms-sensitvity of 20 mK Tb for total intensities and 11 mK Tb for polarised intensities and is available for download like the Urumqi 6 cm survey and many other continuum and polarisation surveys from the MPIfR survey sampler2.
2.3 The Effelsberg 21 cm survey
We also inspected data from an unpublished section of the Effelsberg Medium Latutude Survey (EMLS) at 21 cm (1.4 GHz). The EMLS covers the northern Galactic plane within Galactic latitude (Uyanıker et al. 1998, 1999; Reich et al. 2004) and has an angular resolution of 94. The EMLS maps are on an absolute zero-level, where 21 cm data from the Stockert survey (Reich 1982; Reich & Reich 1986) and the DRAO survey (Wolleben et al. 2006) were added to total intensities and the polarisation data, respectively. The rms-sensitivity for total intensities is 15 mK Tb and limited by confusion, and about 8 mK Tb for Stokes and .
3 Results
3.1 Polarised intensities
3.1.1 Overview at 6 cm and 1.3 cm
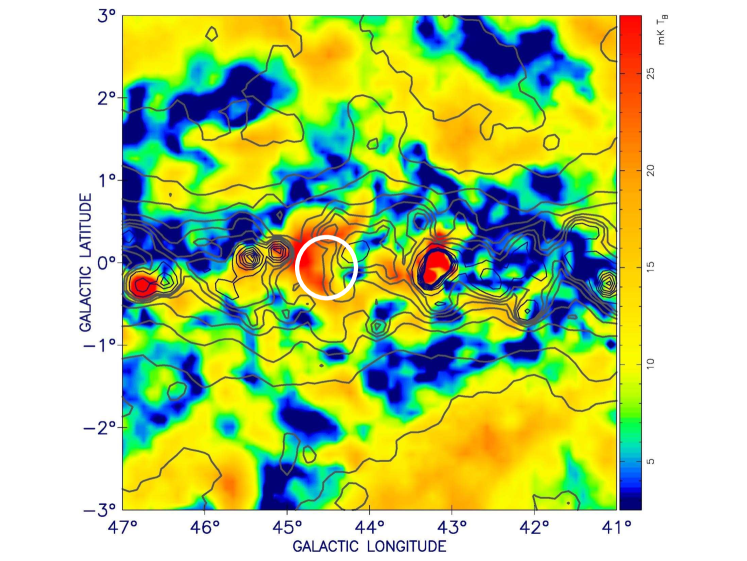
Figure 1 gives an overview of the 6 cm polarised intensities of a 6 section of the Galactic plane with HESS J1912+101 located in its centre. The Urumqi survey map includes extrapolated large-scale data from the WMAP 9-year K-band (1.3 cm) all-sky survey. Polarised and total intensities show the two known, very bright SNRs in the field, W49B and HC30, very clearly. Spurious instrumental polarisation close to strong sources is also visible. In addition, we note an outstanding polarised feature running along the eastern and north-eastern boundary of HESS J1912+101 as marked in Fig. 1. In this area, the arc is the strongest polarisation feature, next in strength to the polarised emission from the two known SNRs. The polarised arc is not related to any of the thermal HII-regions nearby, which are all very distant (Anderson et al. 2012). We argue in the following that this polarised arc or partial shell is related to HESS J1912+101 and indicates the existence of related synchrotron emission.
Figure 2 shows the corresponding WMAP 1.3 cm (K-band) polarisation data for the area of Fig. 1. The WMAP K-band data were convolved from to to enhance the signal-to-noise ratio. Polarised emission from the W49 area including W49B is visible, while polarised emission from HC30 is too faint to contrast from the diffuse emission. The diffuse polarised emission increases towards the Galactic plane and reaches a typical level of 150K Tb, which is also seen towards HESS J1912+101.
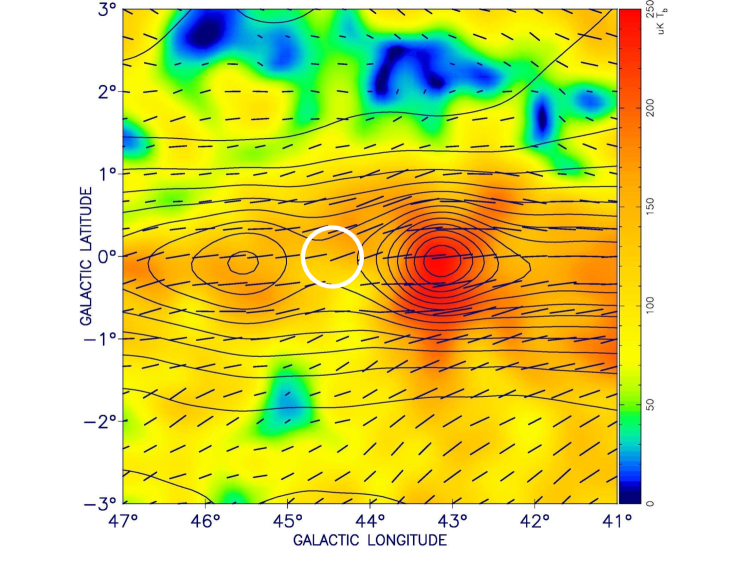
For a spectral index of = -2.7 (T), which Sun et al. (2011) found to be typical for polarised emission from this area, the expected polarised intensity at 6 cm then is about 10 mK Tb, which is indeed observed in some areas along the Galactic plane. However, a level near 10 mK Tb is only expected if the depolarisation properties at 6 cm are the same as at 1.3 cm, which is unlikely the case everywhere and thus lower 6 cm polarised intensities are seen as well in Fig. 1. The 6 cm polarised emission from the arc at the periphery of HESS J1912+101 including the diffuse polarised Galactic plane emission is about three times higher than expected from the K-band data.
We consider the possibility that a Faraday screen (FS) along the line-of-sight may have caused the excessive polarised emission from the polarised arc, which would make it an enhancement originating from a superposition of diffuse Galactic emission components along the line-of-sight and thus the coincidence with HESS J1912+101 is by chance.
Observed FSs in general cause a reduction of the polarised intensity compared to their surroundings. Foreground and background polarisation angles are similarly orientated parallel to the Galactic plane as expected from the large-scale Galactic magnetic field direction. Numerous FSs of this type were observed and analysed in the Urumqi survey publicatons (Sun et al. 2007; Gao et al. 2010; Xiao et al. 2011; Sun et al. 2011).
For the case that the foreground and background polarisation angles of a FS differ significantly and the FS rotates the background polarisation angle to align with the foreground angle, the polarised emission will exceed its surroundings. This scenario is possible, but valid for a narrow wavelength range only. For the polarised arc, this FS scenario requires that the magnetic field direction of the Galactic emission beyond the FS is inclined to the Galactic plane by 70 at least, when being very local, and up to 90, if more distant. However, the K-band polarisation angles, which were almost not affected by the rotation measure (RM) of the putative FS, because of the dependence of RM, do not show large deviations from the orientation along the Galactic plane (Fig. 2), so that the FS scenario can be ruled out.
We conclude that the maximum polarized Galactic 6 cm signal is that extrapolated from the K-band polarised emission. At K-band, Faraday rotation by a FS is not important, because too strong magnetic fields and thermal densities are required for sufficiently high rotation measures to have an effect on the K-band polarisation angles. Thus, the high 6 cm polarised emission from the arc can not result from a FS, which in turn means that its origin is excessive synchrotron emission.
3.1.2 6 cm polarisation
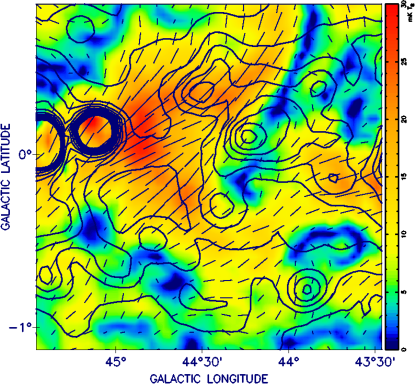
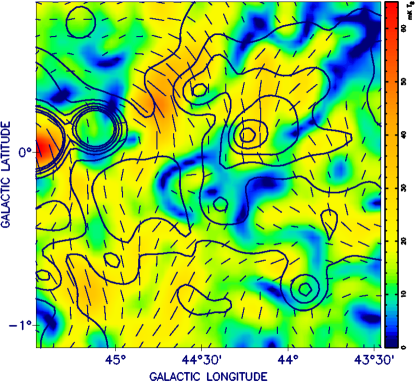
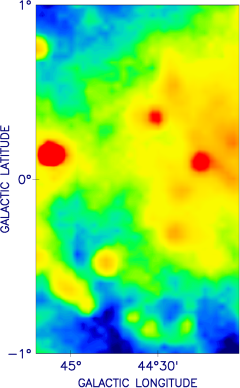
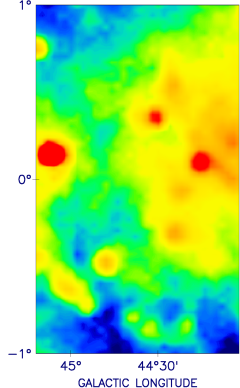
Figure 3 (left panel) shows radio emission details of the vicintity of HESS J1912+101 from the Urumqi 6 cm survey without large-scale emission from WMAP. The direction of the polarisation vectors are in B-field direction (E-vectors ), which is correct for the case that Faraday rotation is negligible (see Sect. 3.3). The strong extended HII-region G45.1+0.1 with a total integrated 6 cm flux density of about 6.9 Jy (Reich et al. 2014) shows some spurious instrumental polarisation at the periphery of the polarised shell. The distance of G45.1+0.1 was reported to be about 18 kpc (Anderson & Bania 2009) and therefore will not cause much depolarisation, because the polarised background beyond 18 kpc is very faint. However, its instrumental polarisation confuses with the emission from the polarised arc eventually causing slight distortions.
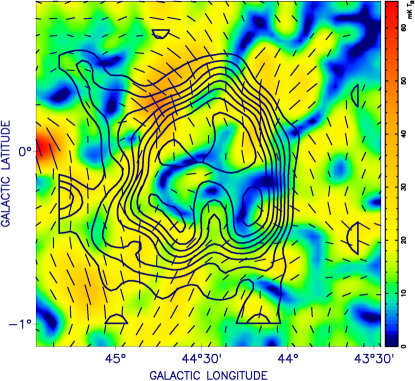
In Figure 3 (right panel), we add 6 cm polarisation bars in B-field direction to polarised intensities and TeV-emission contours from HESS J1912+101. The HESS data were slightly convolved from (Puehlhofer et al. 2015; H. E. S. S. Collaboration et al. 2018) to the angular resolution of the Urumqi survey of 95. The polarised arc follows the outer TeV contours of HESS J1912+101 and overlaps with HESS J1912+101 in its southern area. The polarised signal reaches a maximum of nearly 30 mK (including diffuse Galactic emission), which clearly exceeds the typical observed polarised emission from this area of the Galactic plane (see Fig. 1).
The and maps need a correction to the local zero-level to integrate the emission from the polarised arc. We have done this by subtracting and emission gradients across the field, then calculated the polarised emission and integrated it. The maximum polarised emission reduces to about 15 mK above the local zero-level. Because the zero-level and the emission boundaries are not exactly defined, the errors of the integrated polarised emission are significant. We measure Jy for the polarised arc at 6 cm.
3.1.3 11 cm polarisation
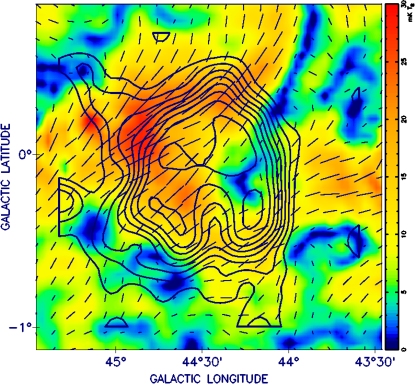
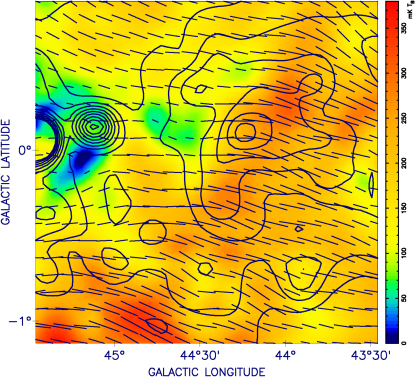
In Fig. 4 (left panel), we show 11 cm polarisation intensities of the HESS J1912+101 area convolved to the resolution of the Urumqi 6 cm map. This convolution increases the signal-to-noise ratio of the 11 cm data. The polarised emission at 11 cm disappears in the area of maximum polarisation at 6 cm and in the south, where the 6 cm polarised emission overlaps with HESS J1912+101 (Fig. 4, right panel). This indicates higher depolarisation at 11 cm compared to 6 cm, which is expected. The maximum polarised signal at 11 cm at resolution is about 60 mK and reduces to about 40 mK Tb when convolved to .
3.1.4 21 cm polarisation
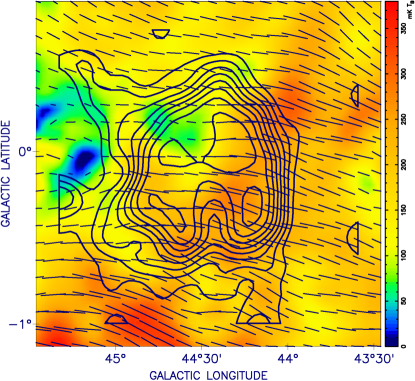
The 21 cm emission distribution in the field of HESS J1912+101 is shown in Fig. 5 (left panel). No correspondence between the polarised radio and the TeV emission is indicated (right panel). Distant 21 cm polarisation will be even more depolarised compared to 11 cm and we conclude that the visible polarised emission originates entirely in the foreground of HESS J1912+101. We do not know the maximum distance up to which polarised emission at 21 cm is seen. A broad filament-like polarised intensity minimum at 6 cm running from about towards north-east seems to have an emission counterpart at 21 cm, indicating a complex radiation tranfer along the line-of-sight. This feature seems not to be related to HESS J1912+101.
3.2 Total-intensity emission
Both, the Urumqi 6 cm and the Effelsberg 11 cm total-intensity maps reveal intense diffuse emission along the Galactic plane and also show numerous strong slightly extended sources distributed around Galactic latitude . These maps do not show any extended total intensities obviously related to HESS J1912+101. As already mentioned, there is no signature of HESS J1912+101 in the high angular resolution 21 cm VLA surveys as well.
As shown, the polarised 6 cm arc is from an emitting synchrotron source. We made attempts to identify the corresponding total-intensity component, but were not successful. We may use indirect arguments to constrain its properties by subtracting the scaled 6 cm polarised arc emission from total intensity maps to see its impact on the observed emission by comparing with the emission after subtracting the total intensity model. We used the 11 cm total intensity map including large-scale background emission from the Stockert 11 cm survey (Reif et al. 1987) at its original resolution of 43 in Fig. 6. We subtracted the baselevel corrected 6 cm polarised arc scaled by a factor of 10, which we calculate for a spectral index = -2.5 and polarisation, and also a factor of 20 for the case of polarisation, from the total-intensity 11 cm map to compare the differences. The resulting maps are shown in Fig. 6. There is no indication of a distinct shell superimposed on large-scale diffuse emission, rather then a smooth depression of the diffuse total intensities. The thick arc merges with the more extended diffuse Galactic emission. However, for polarisation fractions of 20% and below, the model arc becomes so strong in total-intensity that after subtraction minima in the survey map relative to the source-free areas at higher or lower latitudes results. This is unlikely a real scenario. This way, we get a constraint of the arcs total-intensity contribution to the emission seen from this area.
From the measured 6 cm polarised intensity of Jy, we estimate a total flux density for an average of polarisation of Jy at 6 cm for the area of the arc. The total flux density from HESS J1912+101, however, may be higher as discussed in Sect. 4.

3.3 Rotation measure
We have calculated RMs from the 11 cm and 6 cm polarisation angles at angular resolution. We are interested in the RM of the polarised arc and therefore used the 11 cm and 6 cm Stokes and maps corrected for a local zero-level (see Sect. 3.1.2) before calculating polarisation angles. The results are influenced by depolarisation at 11 cm in general, which is also reflected by unusual flat spectra for polarised synchrotron emission. For the 11 cm polarisation maximum, see Fig. 4, we find a minimum RM of about +150 rad/m2. The RM ambiguity of 371 rad/m2 can not be neglected if data at only two wavelengths are available. Therefore, we have checked the ATNF Pulsar Catalogue (Manchester et al. 2005) 333http://www.atnf.csiro.au/people/pulsar/psrcat/ for pulsars (PSRs) with measured RMs to compare with the RM values of the polarised arc. Unfortunately, there are only five PSR RMs listed within the field of Fig. 1 showing a large scatter between +97 rad/m2 up to +978 rad/m2, which is not helpful for our case. However, all RMs are positiv. Xu & Han (2014) list ten presumably extragalactic sources in the same field with RMs from the NVSS catalogue (Taylor et al. 2009) and the list of Van Eck et al. (2011). These RMs show a similar large scatter as noted for the PSR RMs. Again, all sources have a positive sign, except for the faint source at , where the NVSS RM of +529.2 rad/m2 disagrees with the -117.0 rad/m2 listed by Van Eck et al. (2011). We conclude that the assumption of a positive RM for the diffuse polarised emission is justified. A RM of +150 rad/m2 corresponds to a polarisation angle rotation of about 34 at 6 cm, which brings the polarisation vectors close to tangential to the HESS J1912+101 shell at the 11 cm polarisation maximum. For other parts of the arc, higher-frequency polarisation data are needed for a reliable estimate of RM and to find the intrinsic B-field direction of HESS J1912+101.
4 Discussion
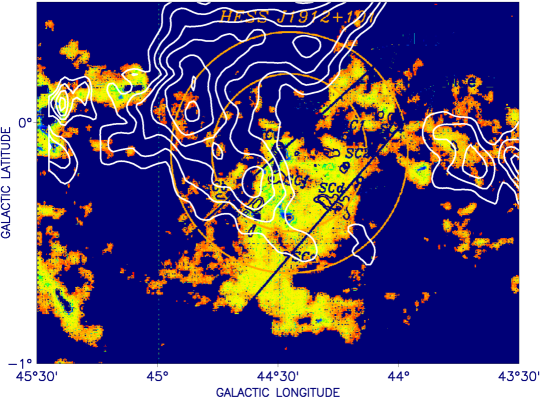
For HESS J1912+101, Su et al. (2017) derived a distance of about 4.1 kpc based on HI self-absorption data, which is in rough agreement with the dispersion measure based distance of PSR J1913+1011 (Morris et al. 2002) of about 4.5 kpc, located near to the centre of HESS J1912+101. The distance agreement suggests that PSR J19133+1011 and HESS J1912+101 are related. Also the age estimate by Su et al. (2017) for HESS J1912+101 of about 0.7-2.0 years and that of PSR J193+1011 of about 1.7 years (Morris et al. 2002) agree within the errors and support a physical association. Su et al. (2017) suggest a scenario, where the stellar winds of the massive progenitor created a bubble in the molecular material. This stellar wind also had an effect on the ambient magnetic field, which gets compressed. We note, that the polarised arc of HESS J1912+101 is located in an area with little molecular material, when comparing with the CO-maps of Su et al. (2017) (see Fig. 7). Vice versa, areas with dense molecular clouds are not seen in polarisation. This fits into the scenario that the polarised arc was formed by the stellar wind and subsequently interacts with the SNR shock front. It is likely that the compression of the ambient magnetic field by the stellar wind and/or the expanding SNR shell is distortet or suppressed in areas with clumpy molecular gas that large-scale polarisation is not observed. This will reduce the synchrotron emission from the SNR in this area. However, also enhanced depolarisation will result when thermal gas is associated with the molecular gas, which is currently unclear.
The thermal HII-regions in the area of HESS J1912+101 for longitudes are all at larger distances (Anderson et al. 2012), but we do not know the distance of the diffuse emission. In Sect. 3.2, we calculated the total 6 cm flux density of the polarised arc based on an assumed percentage polarisation, but this does not work for the other half of HESS J1912+101 dominated by molecular clouds. For the same surface-brightness, the total flux density may be then be up to twice as large as estimated in Sect. 3.2, or about 2.5 to 5 Jy at 6 cm. Flux densities at 1 GHz range between 2.7 and 11.0 Jy depending on the assumptions and for a typical SNR spectral index of = -0.5 (). The estimated range of surface brightness values for HESS 1912+101 then is between 1.4 to 5.7 Wm-2Hz-1sr-1. These values are about 4 to 15 times larger than the surface brightness calculated above from the Su et al. (2017) flux density estimate based on the work of Yamazaki et al. (2006), but are still very low. The spectral properties of old SNRs as described by Yamazaki et al. (2006) are basically in agreement with the radio data in view of the large uncertainties.
Even for the most conservative upper flux density estimate, the surface brightness of HESS 1912+101 of Wm-2Hz-1sr-1 belongs to the 20% known Galactic SNRs with the lowest surface-brightness (see Fig. 2 of Case & Bhattacharya (1998)). SNRs with a low surface-brightness often show a high percentage polarisation indicating a well-ordered magnetic field structure of their shells. Example SNRs were listed in Sect. 1. These SNRs are evolved and have likely entered the cooling phase of SNR evolution. Their low surface-brightness makes it very unlikely that they can be detected in the Galactic plane, where diffuse synchrotron and thermal emission superimpose and where the density of Galactic sources is high. In fact, most low surface-brightness SNRs are located several degrees outside of the Galactic plane, where they just confuse with compact extragalactic sources but not with intense extended or structured emission. The polarised intensity signal from these SNRs is less confused, but gets depolarised in the Galactic plane if they are too far away and the observing frequency is not high enough that RM fluctuations cause beam depolarisation. The Urumqi 6 cm survey traces polarised Galactic signals from large distances and clearly shows a partial polarised shell surrounding HESS J1912+101.
5 Summary
We have shown that the polarised arc extracted from the Urumqi 6 cm and the Effelsberg 11 cm survey maps is very likely related to synchrotron emission from HESS J1912+101. This supports its identification as an old SNR. At 11 cm, the polarised emission is fainter because of depolarisation in view of high RMs, which are expected in the Galactic plane for 4.1 kpc distance of HESS J1912+101 (Su et al. 2017). We could not separate a total-intensity counterpart of HESS J1912+101 from confusing diffuse emission in the Galactic plane. SNRs of low-surface brightness have high-percentage polarisations, which allows to trace these objects by their polarised rather than by their total-intensity signal. HESS J1912+101 seems to belong to this group of SNRs, where we estimate its percentage polarisation to exceed 20%. However, to fully settle the polarisation properties of HESS J1912+101 and the intrinsic magnetic direction additional observations at higher frequencies than 4.8 GHz with arcmin angular resolution are required.
Acknowledgements.
X.H.S. is supported by the National Natural Science Foundation of China under grant no. 11763008. We like to thank Patricia Reich for careful reading of the manuscript and discussions and an anonymous reviewer for helpful comments.References
- Aharonian et al. (2008) Aharonian, F., Akhperjanian, A. G., Barres de Almeida, U., et al. 2008, A&A, 484, 435
- Anderson & Bania (2009) Anderson, L. D., & Bania, T. M. 2009, ApJ, 690, 706
- Anderson et al. (2012) Anderson, L. D., Bania, T. M., Balser, D. S., & Rood, R. T. 2012, ApJ, 754, 62
- Bennett et al. (2013) Bennett, C. L., Larson, D., Weiland, J. L., et al. 2013, ApJS, 208, 20
- Case & Bhattacharya (1998) Case, G. L., & Bhattacharya, D. 1998, ApJ, 504, 761
- Duncan et al. (1999) Duncan, A. R., Reich, P., Reich, W., & Fürst, E. 1999, A&A, 350, 447
- Foster et al. (2013) Foster, T. J., Cooper, B., Reich, W., Kothes, R., & West, J. 2013, A&A, 549, A107
- Gao et al. (2011) Gao, X. Y., Sun, X. H., Han, J. L., et al. 2011, A&A, 532, A144
- Gao et al. (2010) Gao, X. Y., Reich, W., Han, J. L., et al. 2010, A&A, 515, A64
- Gorham (1990) Gorham, P. W. 1990, ApJ, 364, 187
- Gottschall et al. (2017) Gottschall, D., Capasso, M., Deil, C., et al. 2017, in American Institute of Physics Conference Series, Vol. 1792, 6th International Symposium on High Energy Gamma-Ray Astronomy, 040030
- Green (2017) Green, D. A. 2017, VizieR Online Data Catalog, 7278
- H. E. S. S. Collaboration et al. (2018) H. E. S. S. Collaboration, Abdalla, H., Abramowski, A., et al. 2018, A&A, 612, A8
- Han et al. (2015) Han, J. L., Reich, W., Sun, X. H., et al. 2015, Highlights of Astronomy, 16, 394
- Junkes et al. (1987) Junkes, N., Fürst, E., & Reich, W. 1987, A&AS, 69, 451
- Kassim (1988a) Kassim, N. E. 1988a, ApJ, 328, L55
- Kassim (1988b) Kassim, N. E. 1988b, ApJS, 68, 715
- Kothes et al. (2017) Kothes, R., Reich, P., Foster, T. J., & Reich, W. 2017, A&A, 597, A116
- Li et al. (1991) Li, Z., Wheeler, J. C., Bash, F. N., & Jefferys, W. H. 1991, ApJ, 378, 93
- Manchester et al. (2005) Manchester, R. N., Hobbs, G. B., Teoh, A., & Hobbs, M. 2005, AJ, 129, 1993
- Morris et al. (2002) Morris, D. J., Hobbs, G., Lyne, A. G., et al. 2002, MNRAS, 335, 275
- Puehlhofer et al. (2015) Puehlhofer, G., Brun, F., Capasso, M., et al. 2015, in International Cosmic Ray Conference, Vol. 34, 34th International Cosmic Ray Conference (ICRC2015), 886
- Reich & Reich (1986) Reich, P., & Reich, W. 1986, A&AS, 63, 205
- Reich (1982) Reich, W. 1982, A&AS, 48, 219
- Reich et al. (1979) Reich, W., Berkhuijsen, E. M., & Sofue, Y. 1979, A&A, 72, 270
- Reich et al. (1992) Reich, W., Fürst, E., & Arnal, E. M. 1992, A&A, 256, 214
- Reich et al. (1984) Reich, W., Fürst, E., Haslam, C. G. T., Steffen, P., & Reif, K. 1984, A&AS, 58, 197
- Reich et al. (1990) Reich, W., Fürst, E., Reich, P., & Reif, K. 1990, A&AS, 85, 633
- Reich et al. (2004) Reich, W., Fürst, E., Reich, P., et al. 2004, in The Magnetized Interstellar Medium, ed. B. Uyanıker, W. Reich, & R. Wielebinski (Copernicus GmbH, Katlenburg-Lindau), 45
- Reich et al. (2014) Reich, W., Sun, X. H., Reich, P., et al. 2014, A&A, 561, A55
- Reif et al. (1987) Reif, K., Reich, W., Steffen, P., Müller, P., & Weiland, H. 1987, Mitteilungen der Astronomischen Gesellschaft Hamburg, 70, 419
- Su et al. (2017) Su, Y., Zhou, X., Yang, J., et al. 2017, ApJ, 845, 48
- Sun et al. (2007) Sun, X. H., Han, J. L., Reich, W., et al. 2007, A&A, 463, 993
- Sun et al. (2011) Sun, X. H., Reich, W., Han, J. L., et al. 2011, A&A, 527, A74
- Tammann et al. (1994) Tammann, G. A., Loeffler, W., & Schroeder, A. 1994, ApJS, 92, 487
- Taylor et al. (2009) Taylor, A. R., Stil, J. M., & Sunstrum, C. 2009, ApJ, 702, 1230
- Uyanıker et al. (1998) Uyanıker, B., Fürst, E., Reich, W., Reich, P., & Wielebinski, R. 1998, A&AS, 132, 401
- Uyanıker et al. (1999) Uyanıker, B., Fürst, E., Reich, W., Reich, P., & Wielebinski, R. 1999, A&AS, 138, 31
- Van Eck et al. (2011) Van Eck, C. L., Brown, J. C., Stil, J. M., et al. 2011, ApJ, 728, 97
- Wolleben et al. (2006) Wolleben, M., Landecker, T. L., Reich, W., & Wielebinski, R. 2006, A&A, 448, 411
- Xiao et al. (2011) Xiao, L., Han, J. L., Reich, W., et al. 2011, A&A, 529, A15
- Xiao et al. (2009) Xiao, L., Reich, W., Fürst, E., & Han, J. L. 2009, A&A, 503, 827
- Xu & Han (2014) Xu, J., & Han, J. L. 2014, Research in Astronomy and Astrophysics, 14, 942
- Xu et al. (2007) Xu, J. W., Han, J. L., Sun, X. H., et al. 2007, A&A, 470, 969
- Yamazaki et al. (2006) Yamazaki, R., Kohri, K., Bamba, A., et al. 2006, MNRAS, 371, 1975