Evidence for the First Extragalactic Hydrogen Recombination Line Maser in NGC 253
Abstract
We present the first detection of extragalactic hydrogen recombination line maser emission in the H26 transition toward the inner 13.5 pc nuclear region of the starburst galaxy NGC 253 using ALMA data. In regions with complex continuum emission (dust, free-free and synchrotron) we propose to use the recombination line spectral index, (), between the H30 and the H26 lines to study the structure of ultra-compact H ii regions and to identify maser emission () from ionized winds. The measured values of ranged from 1.0 to 2.9. The largest can only be explained by maser emission. The measured flux density in the H26 maser in NGC 253 suggests that we are observing hundreds of stars like MWC349A, a prototypical stellar wind where maser emission arises from its circumstellar disk. We briefly discuss the implication of the detection of maser emission in starburst galaxies like NGC 253.
1 Introduction
High-gain hydrogen recombination line (RL) masers were first detected in 1989 at mm wavelengths toward the stellar wind source MWC349A (Martín-Pintado et al., 1989). Soon after, submm maser emission in the H26 lines (Thum et al., 1994) and laser emission in far-IR (Strelnitski et al., 1996a; Smith et al., 1997; Thum et al., 1998) were reported. Subsequent modeling (Strelnitski et al., 1996c, b) clearly hinted that the physical conditions required for inverting the populations to give rise to strong maser emission are associated to dense ionized gas like that found in ionized stellar winds with a density structure of and continuum spectral index of . These winds are not found in most of the ultra and hypercompact H ii regions, suggesting that they occur during a short stage in an evolution of young massive stars (Jaffe & Martín-Pintado, 1999). In fact, RL masers have been actively sought in both mm and submm surveys, but they were detected only in a few galactic sources (Cox et al., 1995; Jiménez-Serra et al., 2011, 2013; Sánchez Contreras et al., 2017; Aleman et al., 2018).
The strongest RL maser source ever detected, MWC349A, shows the prototypical stellar wind spectrum from cm to far-IR wavelengths (Olnon, 1975; Tafoya et al., 2004) and a circumstellar disk (Planesas et al., 1992; Danchi et al., 2001; Martín-Pintado et al., 2011; Báez-Rubio et al., 2013, 2014; Zhang et al., 2017) likely reminiscent of the latest phases of massive star formation. Based on the number of RL masers found in our galaxy, one would expect that galaxies undergoing strong bursts of star formation would have, at least, some objects in the evolutionary stage with the appropriate physical conditions to show maser emission.
NGC 253 is a large isolated spiral galaxy, of type SAB(s)c, with its disk oriented nearly edge-on (Puche et al., 1991). Located at a distance of Mpc (Mouhcine et al., 2005; Rekola et al., 2005), it is one of the closest starburst galaxies making it a prime candidate to study the starburst phenomena. NGC 253 has been studied across the whole electromagnetic spectrum revealing the complexity of its nuclear region with multiple sources showing different nature (both thermal and non thermal). Of special relevance to understand star formation in this galaxy are the sources of thermal radio-continuum emission tracing massive star formation regions, which are expected to emit radio RL emission. Previous 1-2” resolution ALMA studies of RLs at 3 mm, in particular of the H40, suggested that the emission from the H ii regions was basically optically thin with temperatures of 3700–4500 K, providing star formation rates consistent with the IR emission (Bendo et al., 2015).
In this Letter we have used ALMA data to discover the first RL maser emission in the H26 RL toward an extragalactic object, the nucleus of NGC 253. We have analyzed in detail the RL emission in the most inner 13.5 pc region, which is thought to harbour the central AGN (Ulvestad & Antonucci, 1997). The high spatial resolution and high-sensitivity ALMA observations of the H30 and H26 have been crucial to reveal the maser emission toward a super stellar cluster (SSC).
2 Data reduction and results
We have used ALMA archival data with angular resolutions higher than arcsec and sensitivities of 0.46–0.60 mJy beam-1 (at 231.90 and 353.62 GHz respectively) at a velocity resolution of 30 km s-1. The high angular resolution allows us to study the most compact H ii regions, resolving out much of the diffuse thermal and non-thermal emission, while the high sensitivity helps in the detection of the weak H30 and H26 RLs (at 231.90 and 353.62 GHz respectively) toward the continuum sources reported by Leroy et al. (2018).
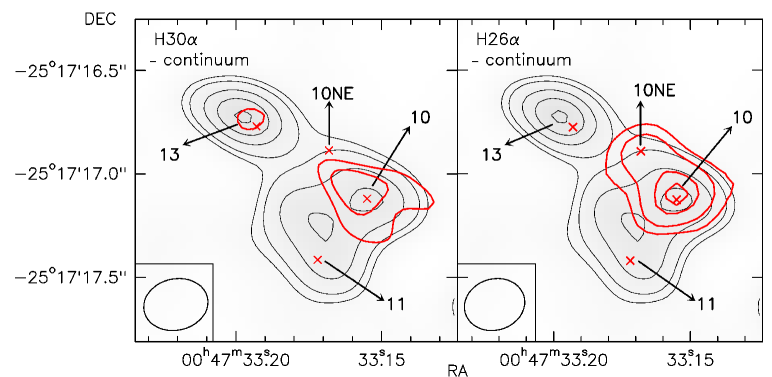
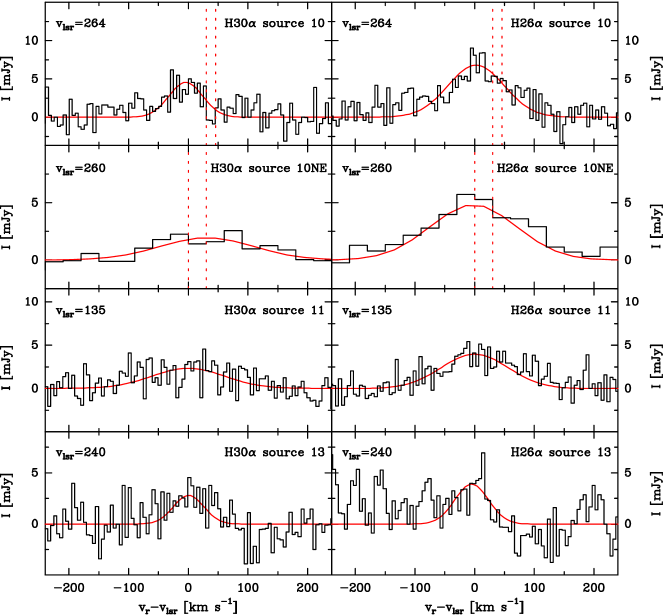
Data calibration and imaging were carried out in the standard manner with the CASA package (Common Astronomy Software Applications; McMullin et al. 2007). The pipeline reduction scripts were modified to image the whole spectral ranges. In order to subtract the local continuum (with zero or first order polynomials), we have identified the free line channels of our regions with the help of the Statcont Method (Sánchez-Monge et al., 2018). The continuum subtraction and spectral analysis of the H26 and H30 RL cubes were done with the MADCUBA software (see, e.g. Martín-Doménech et al. 2017). The continuum emission map of the inner 13.5 pc, shown in Fig. 1 in thin dark contours, clearly shows sources 10, 11, and 13 (Leroy et al., 2018). Superimposed on the continuum map, the thick red contours in Fig. 1 show the comparison of the H30 and H26 emission in a 30 km s-1 channel at the radial velocity of 275 km s-1. There is a clear ionized source (previously unknown) in the northeast from source 10, hereafter called source 10NE, which presents very weak H30 emission and is not associated to any continuum peak. Fig. 2 shows the spectral line profiles measured toward all sources. We also show the Gaussian fits in this figure (red lines), whose parameters are listed in Table 1. We note that the measured are similar to those measured in molecular lines but their line widths are broader (about 65–180 km s-1 versus 25 km s-1 for the molecular lines). The profiles toward 10NE shown in Fig. 2 have been smoothed to 30 km s-1 to improve the SNR to detect the H30 RL. Note that there is a slight shift in the measured of the H26 with respect to the H30 RL.
| Source | Position RL peak | Line | v | bbRLSIs derived from the velocity-integrated intensities of the Gaussian fits. In the case of source 10NE, the second shown value is that obtained from integrating the RL intensity just in the spectral range between 260 and 290 km s-1 (one channel). We stress that, in the case of the derived for this spectral channel, we have not considered the uncertainty introduced by the baseline fit. | ccfootnotemark: | |||
|---|---|---|---|---|---|---|---|---|
| (J2000) | (J2000) | [km s-1] | [mJy] | [km s-1] | [mJy km s-1] | |||
| 10 | 00:47:33.155 | -25:17:17.12 | H30 | |||||
| H26 | ||||||||
| 10NE | 00:47:33.168 | -25:17:16.89 | H30 | , | ||||
| H26 | ||||||||
| 11 | 00:47:33.172 | -25:17:17.42 | H30 | |||||
| H26 | ||||||||
| 13 | 00:47:33.193 | -25:17:16.77 | H30 | |||||
| H26 | ||||||||
2.1 Recombination Lines Spectral Indices
Continuum sources do not spatially match the positions where the velocity-integrated submm RL emission peaks (see also Mohan et al. 2005). This is clearly illustrated in Fig. 1 where the continuum map at 231 GHz has a significant/dominant contribution of dust emission, which does not trace the regions responsible for the free-free and RL emission. Dust emission dominating the free-free emission would also explain the high continuum spectral indices measured, –, which are clearly above the value of 2 expected for an optically thick H ii region. In addition, there are not reported measurements of the free-free continuum emission at multiple frequencies with the VLA toward these regions (note that sources 10, 11, and 13 were detected at 36 GHz by Leroy et al. 2018 but the measurements at lower frequencies by Ulvestad & Antonucci 1997 are dominated by non-LTE emission). Therefore, the continuum maps cannot be used to infer the bremsstrahlung SED at the frequencies of the H30 and H26 RLs.
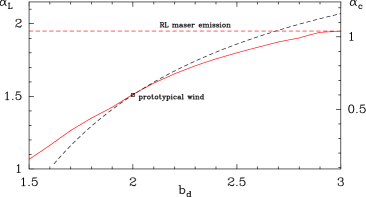
Fortunately, RL spectral indices (hereafter RLSIs), , are excellent tools to constrain the properties of the underlying H ii regions. A clear example of the potential of using RLSIs is source 10, which shows non-thermal radio continuum emission and is thought to be the AGN of the galaxy (Ulvestad & Antonucci, 1997). For the case of optically thin emission, the expected RLSI is (Altenhoff et al., 1960; Mezger & Hoglund, 1967). Larger values would indicate (partially) optically thick thermal emission in the lines. Special cases are the H ii regions with electron density gradients. For the case of an isothermal ionized wind with an electron density, , that decreases with a power-law function of the radius, i.e. , the continuum flux follows a power-law dependence with the frequency as , where the continuum spectral index is a function of as illustrated in Fig. 3 (see also Panagia & Felli 1975). The RLSI follows the dependence with shown also in Fig. 3 in accordance with that calculated using the MORELI code, a 3D radiative transfer model for RLs (Báez-Rubio et al., 2013). A measured value for the RLSI, , larger than would indicate RL maser emission once taken into account the uncertainty introduced by the electron temperature, whose value might reach 12000 K in the extreme case of H ii regions located at large galactocentric radii (Afflerbach et al., 1996; Quireza et al., 2006).
3 Constraining the ionized structure of the detected sources
We have used Fig. 3 and the measured RLSIs (see Table 1) to constrain the structure of the H ii regions observed in NGC 253. The RLSIs from the two RLs have been derived from the H26 cube (with an original resolution of ) spatially smoothed to match the resolution of the H30 cube, i.e. with P.A.=-75.5. This allows us to analyze the ionized gas with a spatial resolution of about 5 pc. The RLSIs were measured integrating the RL emission over the regions defined by their FWHM sizes derived from bidimensional Gaussian fits to the velocity-integrated RL intensities.
The derived RLSIs toward our sources show values of 1.1 (sources 11 and 13), 2.15 (source 10), and 1.8–2.9 (source 10NE for two different ranges of spectral channels). As seen in Fig. 3, the RL radiation is emitted by H ii regions with very different electron density structures. We note that optically thin emission (source 13) with and is expected to arise from the more evolved extended H ii with moderate electron densities, while the partially optically thick emission with is expected to arise in younger and denser ultra and hyper-compact H ii regions (Jaffe & Martín-Pintado, 1999).
3.1 Recombination line masers toward sources 10 and 10NE
In contrast to sources 11 and 13, source 10 shows a RLSI of 2.15 (see Table 1), which is larger than the expected value for the thermal emission from any ionized thermal structure. The most plausible explanation is maser amplification of, at least, the H26 RL emission. This would provide a straightforward explanation of the large RLSI found between the H30 and H26 and their different line widths (which is mainly due to the lack of H30 RL emission in the spectral channels between 294 and 310 km s-1. However, given the uncertainties in the H30 detection, we cannot rule out that emission is under LTE conditions for an electron density profile with .
On the other hand, a detailed analysis of the line profiles of 10NE between 260 and 290 km s-1 reveals line intensities (integrated over the source) of and mJy km s-1 for the H26 and H30 RLs, respectively, at the 1 significance. Thus, using error propagation, we measure a RLSI of (see Table 1), which is above the upper limit for LTE emission, suggesting maser emission. For example, in the representative case of an ionized wind with an electron density of (see, e.g. Jaffe & Martín-Pintado 1999), the expected RLSI for LTE emission would be about 1.5 (see Fig. 3) and, therefore, our measured RLSI would indicate maser emission with a confidence level of about a 90% (1.7 sigma-level). Only for the case of , the RLSI would be barely consistent with LTE emission at a 1 sigma-level. However, we stress that this is an extreme case because, to the best of our knowledge, the steepest electron density gradient known so far was found toward the evolved Wolf-Rayet galaxy of NGC 4214 S, which is very unlikely to be the case of NGC 253, showing a value of (see Beck et al. 2000). Even in this unlikely case, the measured RLSI would indicate maser emission with a confidence level about 75% (1.2 sigma-level).
Maser emission for the H26 RL is illustrated in Fig. 1 by weak radio continuum and H30 emission combined with bright H26 emission seen in this source. We stress that RL opacities larger than those obtained in our model (e.g. due to dense clumps with optically thicker RL emission) would counteract the maser effect decreasing the measured RLSIs (see Strelnitski et al. 1996b; Peters et al. 2012).
3.2 Comparison with galactic RL masers.
An argument in favor of maser emission in NGC 253 is that one of the few known sources emitting hydrogen RL maser emission in our galaxy, Monoceros R2-IRS2, shows (Jiménez-Serra et al., 2013), a lower RLSI than that measured toward the two mentioned extragalactic sources. In addition, MWC349A shows a RLSI of 3.3 (Thum et al., 1994), which is consistent (within the uncertainties) with the value derived toward source 10NE. Therefore, the measured toward source 10NE in NGC 253 suggests that masers might arise from ionized winds similar to those in Monoceros R2-IRS2 and MWC349A. In fact, by scaling the fluxes ( Jy for the H30 RL; Thum et al. 1994) from the actual distance of MWC349A (1620 pc; Gaia Collaboration et al. 2016, 2018; Luri et al. 2018) to the distance of NGC 253 (3.5 Mpc), one predicts a H26 peak intensity of just 6.5 in 30 km s-1. Thus, since the measured peak intensity is 4.8 mJy in 10NE, MWC349A-like ionized winds are required to explain the measured intensity of the H26 line in 10NE in a 30 km s-1 velocity range.
4 Revealing the evolution of young super star clusters
The measured line widths of 65–180 km s-1 are significantly broader than those measured toward most of the galactic H ii regions, km s-1, due to thermal/turbulent broadening (Mezger & Hoglund, 1967). The broad lines in NGC 253 are likely due to the velocity dispersion from unresolved H ii regions detected in our 5 pc beam along the line of sight. Assuming an electron temperature of 6000 K and LTE emission for the H30 RL (which implies a velocity-integrated line-to-continuum ratio of 125 km s-1 assuming LTE optically thin RL emission; see Rodríguez et al. 2009), the Lyman continuum production rate required to maintain the ionization would be s-1 toward all our sources. This is equivalent to stars of spectral type O5 (Vacca et al., 1996). This reveals that the detected RLs arise in SSCs, which are formed by individual stars (Leroy et al., 2018). Since RL masers are typically amplified by an order of magnitude with respect to the expected LTE values, we do not expect that the detected RL maser emission is dominated by just a few H ii regions contained in our clusters, i.e. maser emission must be common toward a relatively high fraction of the H ii regions. Maser sources are scarce in young stellar objects, implying that the expected timescale when these objects show this type of emission must be rather short, with a derived upper limit of yr (see Wood & Churchwell 1989; Jaffe & Martín-Pintado 1999; Báez-Rubio 2015). Therefore, our results provide strong evidence that the star population within these SSC may be coeval at scales of yr.
Based on the ionized structure deduced from the RLSIs, we could try to infer the history of massive star formation in the inner part of the nucleus of NGC 253 surrounding the AGN as traced by the non-thermal source. The massive star formation in the inner part of NGC 253 seems to indicate an evolutionary trend, where the outermost sources 11 and 13 seem to be the most evolved (since they are optically thin), and SSCs closer to the putative AGN, sources 10 and 10NE, are the most recent star formation events because they show optically thicker emission.
5 Conclusions
We used ALMA data to study the continuum and RL emission of the H30 and H26 toward NGC 253. Our results show that RLSIs provide a unique tool to study the structure of the H ii regions whose free-free continuum emission is not well established. We used the RLSIs to provide evidence for the first known extragalactic object masering in the H26 line, reaching a confidence level of about a 90% for the likely case of a SSC composed by prototypical ionized winds. We stress that in highly confused regions, like those found in the vicinity of AGNs, RLSIs provide information to understand star formation in the innermost regions of active galaxies. In particular, ALMA sensitivity will detect RL maser emission from nearby galaxies at the highest available resolution allowing us to locate and to study in detail the formation process and the evolution of the embedded stellar population in the SSCs.
2015.1.00274.S, ADS/JAO.ALMA#2015.1.01133.S. ALMA is a partnership of ESO (representing its member states), NSF (USA) and NINS (Japan), together with NRC (Canada), MOST and ASIAA (Taiwan), and KASI (Republic of Korea), in cooperation with the Republic of Chile. The Joint ALMA Observatory is operated by ESO, AUI/NRAO and NAOJ. We acknowledge partial support by the MINECO and FEDER funding under grants ESP2015-65597-C4-1-R and ESP2017-86582-C4-1-R and by the Comunidad de Madrid grant no. S2013/ICE-2822 SpaceTec-CM. F.R.-V. also acknowledges support by the MINECO through grant BES-2016-078808. Finally, we are also grateful to the anonymous referee for valuable comments.
References
- Afflerbach et al. (1996) Afflerbach, A., Churchwell, E., Acord, J. M., et al. 1996, The Astrophysical Journal Supplement Series, 106, 423
- Aleman et al. (2018) Aleman, I., Exter, K., Ueta, T., et al. 2018, MNRAS, 477, 4499
- Altenhoff et al. (1960) Altenhoff, W., Mezger, P. G., Wendker, H., & Westerhout, G. 1960, Veröff. Univ.-Sternwarte Bonn, 59, 48
- Báez-Rubio (2015) Báez-Rubio, A. 2015, Ph.D. Thesis (UCM)
- Báez-Rubio et al. (2013) Báez-Rubio, A., Martín-Pintado, J., Thum, C., & Planesas, P. 2013, A&A, 553, A45
- Báez-Rubio et al. (2014) Báez-Rubio, A., Martín-Pintado, J., Thum, C., Planesas, P., & Torres-Redondo, J. 2014, A&A, 571, L4
- Beck et al. (2000) Beck, S. C., Turner, J. L., & Kovo, O. 2000, AJ, 120, 244
- Bendo et al. (2015) Bendo, G. J., Beswick, R. J., D’Cruze, M. J., et al. 2015, MNRAS, 450, L80
- Cox et al. (1995) Cox, P., Martín-Pintado, J., Bachiller, R., et al. 1995, A&A, 295, L39
- Danchi et al. (2001) Danchi, W. C., Tuthill, P. G., & Monnier, J. D. 2001, ApJ, 562, 440
- Gaia Collaboration et al. (2016) Gaia Collaboration, Prusti, T., de Bruijne, J. H. J., et al. 2016, A&A, 595, A1
- Gaia Collaboration et al. (2018) Gaia Collaboration, Brown, A. G. A., Vallenari, A., et al. 2018, A&A, 616, A1
- Jaffe & Martín-Pintado (1999) Jaffe, D. T., & Martín-Pintado, J. 1999, ApJ, 520, 162
- Jiménez-Serra et al. (2013) Jiménez-Serra, I., Báez-Rubio, A., Rivilla, V. M., et al. 2013, ApJ, 764, L4
- Jiménez-Serra et al. (2011) Jiménez-Serra, I., Martín-Pintado, J., Báez-Rubio, A., Patel, N., & Thum, C. 2011, ApJ, 732, L27
- Leroy et al. (2018) Leroy, A. K., Bolatto, A. D., Ostriker, E. C., et al. 2018, ArXiv e-prints, arXiv:1804.02083
- Luri et al. (2018) Luri, X., Brown, A. G. A., Sarro, L. M., et al. 2018, A&A, 616, A9
- Martín-Doménech et al. (2017) Martín-Doménech, R., Rivilla, V. M., Jiménez-Serra, I., et al. 2017, MNRAS, 469, 2230
- Martín-Pintado et al. (1989) Martín-Pintado, J., Bachiller, R., Thum, C., & Walmsley, M. 1989, A&A, 215, L13
- Martín-Pintado et al. (2011) Martín-Pintado, J., Thum, C., Planesas, P., & Báez-Rubio, A. 2011, A&A, 530, L15
- McMullin et al. (2007) McMullin, J. P., Waters, B., Schiebel, D., Young, W., & Golap, K. 2007, in Astronomical Society of the Pacific Conference Series, Vol. 376, Astronomical Data Analysis Software and Systems XVI, ed. R. A. Shaw, F. Hill, & D. J. Bell, 127
- Mezger & Hoglund (1967) Mezger, P. G., & Hoglund, B. 1967, ApJ, 147, 490
- Mohan et al. (2005) Mohan, N. R., Goss, W. M., & Anantharamaiah, K. R. 2005, A&A, 432, 1
- Mouhcine et al. (2005) Mouhcine, M., Ferguson, H. C., Rich, R. M., Brown, T. M., & Smith, T. E. 2005, ApJ, 633, 810
- Olnon (1975) Olnon, F. M. 1975, A&A, 39, 217
- Panagia & Felli (1975) Panagia, N., & Felli, M. 1975, A&A, 39, 1
- Peters et al. (2012) Peters, T., Longmore, S. N., & Dullemond, C. P. 2012, MNRAS, 425, 2352
- Planesas et al. (1992) Planesas, P., Martín-Pintado, J., & Serabyn, E. 1992, ApJ, 386, L23
- Puche et al. (1991) Puche, D., Carignan, C., & van Gorkom, J. H. 1991, AJ, 101, 456
- Rekola et al. (2005) Rekola, R., Richer, M. G., McCall, M. L., et al. 2005, MNRAS, 361, 330
- Quireza et al. (2006) Quireza, C., Rood, R. T., Bania, T. M., Balser, D. S., & Maciel, W. J. 2006, ApJ, 653, 1226
- Rodríguez et al. (2009) Rodríguez, L. F., Zapata, L. A., & Ho, P. T. P. 2009, ApJ, 692, 162
- Sánchez Contreras et al. (2017) Sánchez Contreras, C., Báez-Rubio, A., Alcolea, J., Bujarrabal, V., & Martín-Pintado, J. 2017, A&A, 603, A67
- Sánchez-Monge et al. (2018) Sánchez-Monge, Á., Schilke, P., Ginsburg, A., Cesaroni, R., & Schmiedeke, A. 2018, A&A, 609, A101
- Smith et al. (1997) Smith, H. A., Strelnitski, V., Miles, J. W., Kelly, D. M., & Lacy, J. H. 1997, AJ, 114, 2658
- Strelnitski et al. (1996a) Strelnitski, V., Haas, M. R., Smith, H. A., et al. 1996a, Science, 272, 1459
- Strelnitski et al. (1996b) Strelnitski, V. S., Ponomarev, V. O., & Smith, H. A. 1996b, ApJ, 470, 1118
- Strelnitski et al. (1996c) Strelnitski, V. S., Smith, H. A., & Ponomarev, V. O. 1996c, ApJ, 470, 1134
- Tafoya et al. (2004) Tafoya, D., Gómez, Y., & Rodríguez, L. F. 2004, ApJ, 610, 827
- Thum et al. (1998) Thum, C., Martín-Pintado, J., Quirrenbach, A., & Matthews, H. E. 1998, A&A, 333, L63
- Thum et al. (1994) Thum, C., Matthews, H. E., Martín-Pintado, J., et al. 1994, A&A, 283, 582
- Ulvestad & Antonucci (1997) Ulvestad, J. S., & Antonucci, R. R. J. 1997, ApJ, 488, 621
- Vacca et al. (1996) Vacca, W. D., Garmany, C. D., & Shull, J. M. 1996, ApJ, 460, 914
- Wood & Churchwell (1989) Wood, D. O. S., & Churchwell, E. 1989, ApJ, 340, 265
- Zhang et al. (2017) Zhang, Q., Claus, B., Watson, L., & Moran, J. 2017, ApJ, 837, 53