Study of the reflection spectra of SAX J1748.9–2021
Abstract
We report the spectral analysis of accretion powered millisecond X-ray pulsar SAX J1748.9–2021 from the NuSTAR observation made during its 2015 outburst. The spectra displayed a broad emission line at keV with line width of keV and excess above keV due to Compton hump. The persistent emission of SAX J1748.9–2021 is described by a combination of soft thermal component with keV and thermally Comptonized component with keV reflected from the disc with reflection fraction of . We have modeled the reflection spectrum with self-consistent model relxillCP and have found the inclination of the accretion disc to be and log is equal to . We have obtained an upper limit of 57 km for inner disc radius; and the estimated magnetic field strength at the poles is less than G. This kind of detailed investigation of reflection spectrum of SAX J1748.9–2021, especially above 10 keV, has been achieved only because of high statistics NuSTAR data of the source.
keywords:
accretion, accretion discs – stars: neutron – X-ray: binaries – X-rays: individual (SAX J1748.9–2021)1 Introduction
Accretion powered millisecond X-ray pulsars (AMXPs) are rapidly rotating neutron stars (NS) which are known to accrete from a low mass companion (see e.g., Poutanen, 2006; Patruno & Watts, 2012, for reviews). The magnetic field of AMXPs generally lie in the range G (Mukherjee et al., 2015). The magnetic field of AMXPs is strong enough to truncate the accretion disc far from the stellar surface and channel the accreting material towards the magnetic polar caps of the NS (e.g., Cackett et al., 2009; Papitto et al., 2009, 2013; Pintore et al., 2016). The X-rays emitted by the release of gravitational potential energy above the NS surface is then observed in the form of pulsations (see e.g., Ghosh, 2007).
SAX J1748.9–2021 is a transient AMXP which was discovered in 1998 with Beppo-SAX (in ’t Zand et al., 1999). It is located in the globular cluster NGC 6440 at a distance of kpc (Ortolani et al., 1994; Kuulkers et al., 2003). This source shows intermittent pulsations at Hz and it has an orbital period of h (Altamirano et al., 2008; Patruno et al., 2009; Sanna et al., 2016). The mass and radius of the companion star have been estimated to lie in the range and , respectively (Cadelano et al., 2017). SAX J1748.9–2021 also went into the outbursts in 2001, 2005, 2010, 2015 and 2017 (in ’t Zand et al., 2001; Markwardt & Swank, 2005; Patruno et al., 2010; Kuulkers et al., 2015; Negoro et al., 2017). During the outburst of 2015, source was in the soft state and its broadband spectrum consisted of two soft thermal components, a cold thermal Comptonization ( keV) and an additional hard X-ray emission modeled using power-law (Pintore et al., 2016). During the outburst of 2017, source was observed in low hard state, with average spectral properties consistent with a soft thermal component plus a hot thermal Comptonization (Pintore et al., 2018).
The reflection spectrum from accretion disc has been studied in AMXPs such as SAX J1808.4-3658 (e.g., Cackett et al., 2010; Wilkinson et al., 2011), HETE J1900.1-2455 (Cackett et al., 2010; Papitto et al., 2013), IGR J17511-3057 (Papitto et al., 2010) and Aql X-1 (Ludlam et al., 2017c). Generally, the reflection process results in a broad Fe K emission line around 6.4–7.0 keV and a broad Compton back-scattering hump between keV (Ross et al., 1999). Modeling of these features can provide information about the disc geometry, like the inner disc radius and inclination of disc (Fabian et al., 1989; Fabian & Ross, 2010).
Previous studies of SAX J1748.9–2021 lack a proper investigation of reflection spectrum (in ’t Zand et al., 1999; Pintore et al., 2016, 2018). During the outburst of 2015, Pintore et al. (2016) modeled the broad emission feature using diskline (Fabian et al., 1989) and they also reported that the reflection models, reflionx (Ross & Fabian, 2005) and rfxconv (Kolehmainen et al., 2011), were not able to give a stable fit because of low statistic data above 10 keV and hence constrained the parameters. In this work, we present the broadband reflection spectroscopy of the AMXP source SAX J1748.9–2021 by making use of the NuSTAR observation made during the outburst of 2015.
2 Observations and data analysis
The Nuclear Spectroscopic Telescope ARray (NuSTAR; Harrison et al., 2013) has been used to study the reflection features of many LMXBs (e.g., Mondal et al., 2017; Ludlam et al., 2017a; Ludlam et al., 2017b; Wang et al., 2017). The NuSTAR mission consists of two telescopes, which focus X-rays between 3 and 79 keV onto two identical focal planes (FPMA and FPMB). It has a field of view (FOV) of and an angular resolution of FWHM. Because of the broad energy coverage, it can simultaneously observe the broad emission line and the Compton hump.
SAX J1748.9–2021 was observed with NuSTAR on 2015 February 26 for a total exposure time of 18 ks (obs-id : 90001002002), during the initial phase of the 2015 outburst. Figure 1 shows the total outburst lightcurve of the source as observed by Swift/XRT during 2015. The epoch of NuSTAR observation has been marked with a red vertical dash line. We have used the most recent NuSTAR analysis software nustardas v.1.8.0 distributed with heasoft version 6.22 and the latest calibration files (version 20170817) for reduction and analysis of the NuSTAR data. We used the task nupipeline to generate calibrated and screened event files. A circular region of radius centered at the source position was used to extract the source events. Background events were extracted from a circular region of same size away from the source. The task nuproduct was used to generate the lightcurves, spectra and response files. The FPMA/FPMB light curves were background-corrected and summed using lcmath and is shown in Figure 2. In this observation, seven type-I thermonuclear X-ray bursts are observed. The persistent emission spectra were extracted by excluding the bursts (removed data between 10 sec before the burst start and 200 sec after the burst start). The spectra were grouped to give a minimum of 25 counts/bin.


3 Spectral Analysis
We used the xspec version 12.9.1m (Arnaud, 1996) for the spectral fitting. To model interstellar absorption, tbabs was used, with the abundances set to wilm (Wilms et al., 2000) and cross sections set to vern (Verner et al., 1996). We have fitted the persistent spectra extracted from NuSTAR-FPMA and NuSTAR-FPMB, simultaneously. For each spectrum, we added a multiplicative constant to account for the different cross-calibrations of the instruments and fixed this constant to 1 for NuSTAR-FPMA. SAX J1748.9–2021 was significantly detected upto 40 keV above background. Therefore, we have fitted the spectra in the energy range 3–40 keV. All spectral uncertainties and upper-limits are given at 90% confidence unless specified.
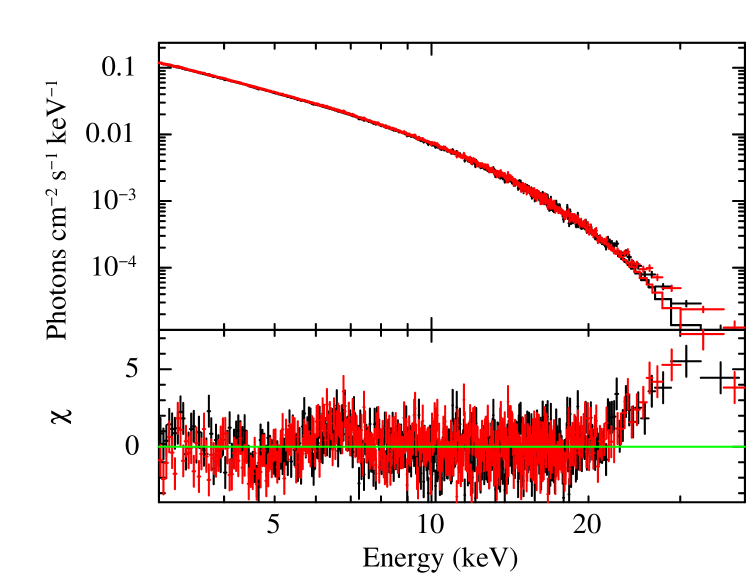
We fitted the spectrum with absorbed thermally Comptonized component nthcomp (Zdziarski et al., 1996; Życki et al., 1999). The nthcomp model pictures that the hot electrons Compton upscatter the seed photons with a (quasi)blackbody spectrum e.g., from a NS surface/boundary layer or disc blackbody spectrum. As NuSTAR data extends down to 3 keV only, the value of cannot be constrained from our fit. Therefore, we fixed to cm-2 (Pintore et al., 2016). The nthcomp model provided unacceptable fit ( for 1055 dof) and residuals showed the excess in tail above 20 keV and broad emission feature in 6–7 keV (Figure 3). The broad emission line and excess above keV was also observed with XMM-NewtonINTEGRAL data during this outburst (Pintore et al., 2016).
We initially modeled the 6–7 keV broad feature with Gaussian emission line, found at keV (line width keV) with equivalent width (EW) of eV and excess above 20 keV with powerlaw (Table 1). The powerlaw component obtained was steep with photon index . We then replaced the Gaussian component with a relativistically smeared reflection profile, diskline. The introduction of a diskline model did not provide significant improvement over Gaussian, (, see Table 1). Moreover, the fit with diskline model was insensitive to the parameter like inclination angle, outer radii and emissivity. Therefore, we fixed them to , ( is the gravitational radii, which is km for ) and –2.7, respectively (Pintore et al., 2016). The Fe K emission feature is observed at keV with EW of eV, produced in the disc at a distance of (Table 1 and Figure 4).
3.1 Reflection Spectrum
The high energy tail above 20 keV can be due to Compton reflection hump. The presence of the broad emission line and strong Compton reflection hump (see Fig. 3) suggests for the fitting of broad-band self-consistent reflection model. Therefore, we applied the self-consistent reflection model relxill (García et al., 2014; Dauser et al., 2014) v. 1.0.2 that calculates disc reflection features due to irradiation of the accretion disc by a broken power-law emissivity. It combines the reflection code xillver (García & Kallman, 2010; García et al., 2013) and the relativistic ray tracing code relline (Dauser et al., 2010; Dauser et al., 2013), in which reflection spectrum is chosen for each relativistically calculated emission angle. This model features higher spectral resolution and updated atomic data compared to other models. We used the relxillCP (García et al., 2018) model which describes the reflection from the physical Comptonization continuum calculated using nthcomp. We used the single emissivity profile () and fixed (Wilkins & Fabian, 2012; Cackett et al., 2010). We also fixed the outer radius , as the sensitivity of the reflection fit decreases with increasing outer disc radius. The dimensionless spin parameter can be calculated from the spin frequency using the relation (Braje et al., 2000). Using the spin frequency Hz, we fixed at 0.208.
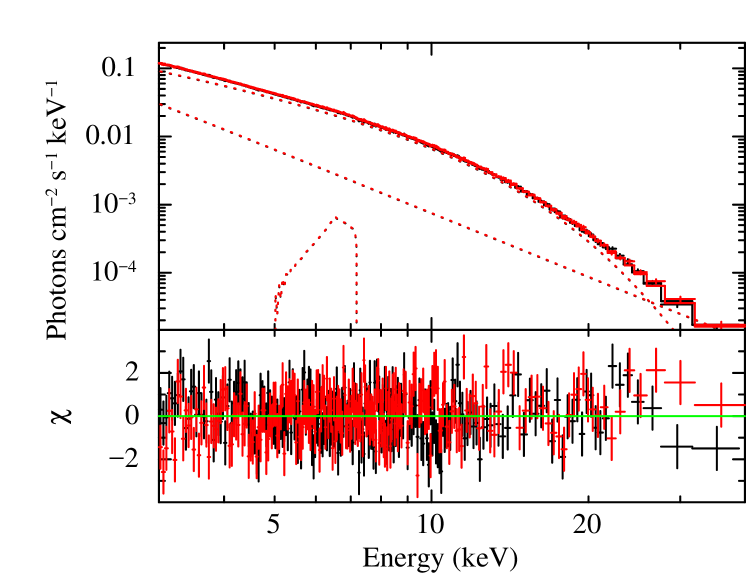
Initially, we added the relxillCP to nthcomp by fixing the to negative value to get only reflected spectrum, such that, the nthcomp represents the direct coronal emission component and relxillCP the reflected component. We tied the power-law photon index, , and electron temperature, , of the relxillCP to that of the respective nthcomp parameters. We also found that the addition of a soft component, bbodyrad or diskbb (Mitsuda et al., 1984), improved the fit significantly (with F-test probability of ), giving the resultant for 1049 dof.
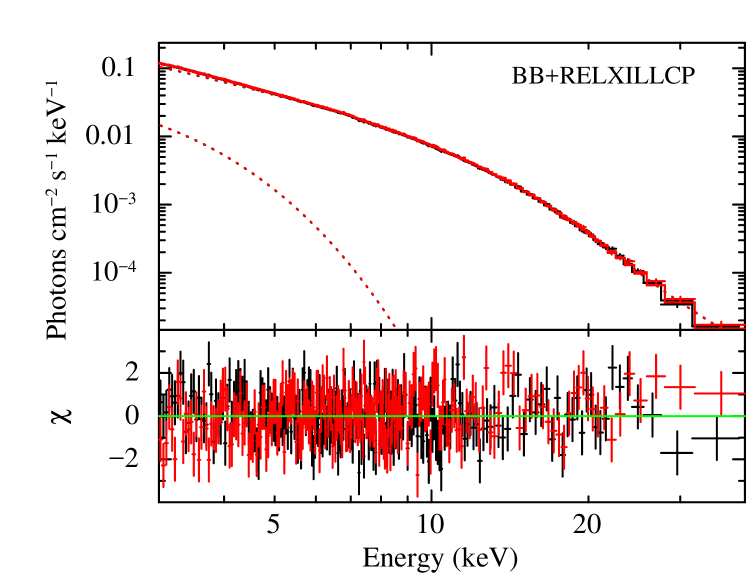
Next, we replaced the nthcomp with relxillCP, since it describes both the illuminating and reflection emission and kept . The is defined as the ratio of the intensity illuminating the disc to the intensity reaching the observer or infinity (Dauser et al., 2016). A soft thermal component improved the fit significantly. We found that the relxillCP parameters were independent of the chosen thermal component, diskbb or bbodyrad and both components gave similar fit statistics and hence we will discuss the results only with bbodyrad. The best fit parameters obtained are given in Table 2 and the resultant spectrum is shown in Figure 5. We obtained the reflection fraction of , iron abundance of disc atmosphere in Solar , disc inclination angle and upper limit on inner radius of accretion disc , where is the radius of inner-most stable circular orbit.
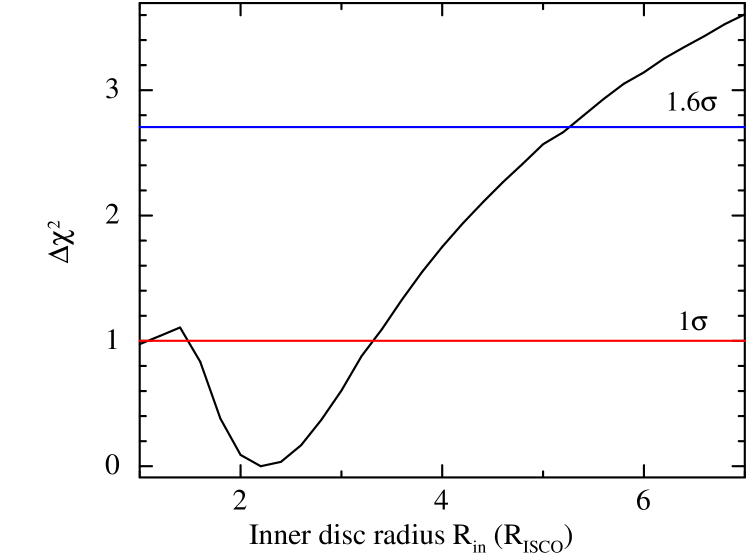
We computed for inner disc radius using steppar in xspec. The resultant while varying inner disc radius between and in steps of is shown in the Figure 6. In this figure, and significance levels are shown by horizontal lines. The inner disc radius can be constrained at only level with .
| Parameters | gaussian | diskline | |
| (keV) | |||
| (keV) | |||
| input_type | |||
| NormNTHCOMP | |||
| NormPL | |||
| (keV) | |||
| (keV) | - | ||
| - | |||
| () | - | ||
| () | - | ||
| Inclination (deg) | - | ||
| EW (eV) | |||
| Normline (10-4) | |||
| (dof) | 1.093 (1050) | 1.090 (1050) |
| Parameters | Value | Parameter details |
| (keV) | The blackbody temperature | |
| Norm | Normalization of Blackbody | |
| Emissivity index | ||
| Spin parameter | ||
| Inner disc radius in | ||
| Inner disc radius in | ||
| () | Outer disc radius | |
| Inclination (deg) | Disc inclination angle | |
| Iron abundance in Solar | ||
| log | Ionization parameter | |
| Photon Index | ||
| (keV) | Comptonizing electrons temperature | |
| Reflection fraction | ||
| Normrefl (10-3) | Normalization of relxillCP | |
| †FluxBB | Flux of blackbody component | |
| †Fluxrelxill | Flux of relxillCP component | |
| †Fluxtotal | Total flux | |
| 3.1 | X-ray Luminosity | |
| (dof) | 1.083 (1049) | Fit statistics |
| 1.6–100 keV unabsorbed flux in unit of erg cm-2 s-1. | ||
| ††1.6–100 keV unabsorbed luminosity in units of erg s-1 | ||
| (assuming distance of 8.5 kpc). | ||
4 Discussion and Conclusions
In this work, we have performed the spectral analysis of AMXP SAX J1748.9–2021 during the rise of its 2015 outburst with NuSTAR observation. The persistent spectra can be well described with a blackbody emission together with a Comptonized emission. The NuSTAR spectra detected a broad Fe emission feature with broadness of keV centered at energy keV. Additionally, a large excess in tail above 20 keV was observed, compatible with the Compton hump.
The broad Fe K line with Compton hump implies the reflection of hard X-ray photons in the accretion disc where the strong velocity field smears discrete features and relativistic effects distort their shapes (Fabian et al., 1989). The self-consistent relativistic reflection model relxillCP successfully modeled the iron line as well as the reflection hump features. From the best fit, a disc inclination of with respect to our line of sight is estimated. A similar value of disc inclination () was observed for intermittent AMXP HETE J1900.1–2455 (Papitto et al., 2013).
From the reflection model, we have found the iron abundance relative to solar values. Although the uncertainty obtained on is large, the lower limits are consistent with solar abundance. Overabundance of Fe have been reported in some NS and black hole X-ray binaries with relxill model (Degenaar et al., 2017; Ludlam et al., 2017a, 2018; García et al., 2018).
Generally, the AMXPs spectrum are found to be hard with electron temperature of 30–50 keV (e.g., Falanga et al., 2005; Gierliński & Poutanen, 2005; Wilkinson et al., 2011; Papitto et al., 2010, 2013; Sanna et al., 2018a, b). SAX J1748.9–2021 was observed in the hard state during outburst of 1998 and 2017 (in ’t Zand et al., 1999; Pintore et al., 2018). Our study suggests that the source was observed in the soft state during NuSTAR observation similar to the XMM-Newton observation (Pintore et al., 2016) carried out six days later. The electron temperature of Comptonized plasma ( keV) is somewhat higher than XMM-Newton observation ( keV). Also, the energy of Fe emission line ( keV) is lower than the value keV, which means that the disc was less ionized during NuSTAR observation. Our estimated value of ionization parameter erg cm s-1 is lower than the estimated value, erg cm s-1, of Pintore et al. (2016).
The optical depth of the Comptonizing medium, , can be estimated from the power-law photon index, , and the electron temperature, , by using the relation
(see, Zdziarski et al., 1996). Using the best fit value of and , we have estimated . We have estimated the Compton parameter (parameter) defined as (relative energy gained by the photons in the inverse Compton scattering). Using best fit values, the parameter is found to be .
We also estimated the average electron number density () of the Comptonizing region using relation , where is the Thomson cross-section and is the geometrical size of the Comptonization cloud. Assuming that the Comptonizing region extends from the NS surface upto the observed inner radius of accretion disc, we found the lower limit of cm-3. On the other hand, the electron number density associated with the reflecting skin above the accretion disc can be estimated using relation , where is the unabsorbed incident luminosity, is ionization parameter and is the inner radius of disc where the reflection component originates. We estimated the unabsorbed incident luminosity using times the unabsorbed luminosity of relxillCP component. Using , erg s-1 and km, we obtained cm-3.
Our spectral fit can only estimate the upper limit on inner accretion disc radius at 90% confidence level. For a spinning NS with , can be approximated using (Miller et al., 1998). This implies km for a mass of 1.4 . Our estimate of the inner disc radius is compatible with the value of 20–40 inferred by Pintore et al. (2016). At significance level, we found the inner disc radius of km). This suggests that the disc is probably truncated moderately away from the NS surface. Also, given the presence of X-ray pulsation during the outburst of 2015 (Sanna et al., 2016), the co-rotation radius can be estimated using (Degenaar et al., 2017). Considering that the accretion disc can not be truncated outside the co-rotation radius, should be less than 29 km (14 ) for NS mass of 1.4 , which is consistent with our estimated limit. The truncated inner disc has been inferred in AMXPs with (Papitto et al., 2009; Cackett et al., 2010; Ludlam et al., 2017c) and also with larger radii (Papitto et al., 2010, 2013; Pintore et al., 2016).
It has been observed that in some LMXBs, the disc truncation occurs at moderate radii due to the pressure exerted by the magnetic field of the NS (Cackett et al., 2009; Degenaar et al., 2014). If it is truncated at magnetospheric radius, we can estimate the magnetic field strength. We have used the following expression for the calculation of the magnetic dipole moment (Ibragimov & Poutanen, 2009),
where G cm3, is the accretion efficiency in the Schwarzchild metric, is the anisotropy correction (which is close to unity; Ibragimov & Poutanen, 2009) and is a geometry coefficient expected to be (Psaltis & Chakrabarty, 1999; Long et al., 2005; Kluźniak & Rappaport, 2007). We assumed and (Cackett et al., 2009; Degenaar et al., 2017). We then obtained G cm3 for 57 km, this leads to a magnetic field strength of G at poles for NS radius of 10 km ( G at significance level). Our estimate of magnetic field strength is within the range determined by Mukherjee et al. (2015).
Acknowledgements
The authors are thankful to Thomas Duaser for discussion on relxill model. This research has made use of the NuSTAR Data Analysis Software (nustardas) jointly developed by the ASI Science Data Center (ASDC, Italy) and the California Institute of Technology (USA). The data was obtained from the High Energy Astrophysics Science Archive Research Center (HEASARC), provided by NASA’s Goddard Space Flight Center. RS acknowledges the financial support from the University Grants Commission (UGC), India, under the SRF scheme.
References
- Altamirano et al. (2008) Altamirano D., Casella P., Patruno A., Wijnands R., van der Klis M., 2008, ApJ, 674, L45
- Arnaud (1996) Arnaud K. A., 1996, in Jacoby G. H., Barnes J., eds, Astronomical Society of the Pacific Conference Series Vol. 101, Astronomical Data Analysis Software and Systems V. p. 17
- Braje et al. (2000) Braje T. M., Romani R. W., Rauch K. P., 2000, ApJ, 531, 447
- Cackett et al. (2009) Cackett E. M., Altamirano D., Patruno A., Miller J. M., Reynolds M., Linares M., Wijnands R., 2009, ApJ, 694, L21
- Cackett et al. (2010) Cackett E. M., et al., 2010, ApJ, 720, 205
- Cadelano et al. (2017) Cadelano M., Pallanca C., Ferraro F. R., Dalessandro E., Lanzoni B., Patruno A., 2017, ApJ, 844, 53
- Dauser et al. (2010) Dauser T., Wilms J., Reynolds C. S., Brenneman L. W., 2010, MNRAS, 409, 1534
- Dauser et al. (2013) Dauser T., Garcia J., Wilms J., Böck M., Brenneman L. W., Falanga M., Fukumura K., Reynolds C. S., 2013, MNRAS, 430, 1694
- Dauser et al. (2014) Dauser T., Garcia J., Parker M. L., Fabian A. C., Wilms J., 2014, MNRAS, 444, L100
- Dauser et al. (2016) Dauser T., García J., Walton D. J., Eikmann W., Kallman T., McClintock J., Wilms J., 2016, A&A, 590, A76
- Degenaar et al. (2014) Degenaar N., Miller J. M., Harrison F. A., Kennea J. A., Kouveliotou C., Younes G., 2014, ApJ, 796, L9
- Degenaar et al. (2017) Degenaar N., Pinto C., Miller J. M., Wijnands R., Altamirano D., Paerels F., Fabian A. C., Chakrabarty D., 2017, MNRAS, 464, 398
- Fabian & Ross (2010) Fabian A. C., Ross R. R., 2010, Space Sci. Rev., 157, 167
- Fabian et al. (1989) Fabian A. C., Rees M. J., Stella L., White N. E., 1989, MNRAS, 238, 729
- Falanga et al. (2005) Falanga M., et al., 2005, A&A, 444, 15
- García & Kallman (2010) García J., Kallman T. R., 2010, ApJ, 718, 695
- García et al. (2013) García J., Dauser T., Reynolds C. S., Kallman T. R., McClintock J. E., Wilms J., Eikmann W., 2013, ApJ, 768, 146
- García et al. (2014) García J., et al., 2014, ApJ, 782, 76
- García et al. (2018) García J. A., et al., 2018, preprint, (arXiv:1807.01949)
- Ghosh (2007) Ghosh P., 2007, Rotation and Accretion Powered Pulsars. World Scientific Publishing Co, doi:10.1142/4806
- Gierliński & Poutanen (2005) Gierliński M., Poutanen J., 2005, MNRAS, 359, 1261
- Harrison et al. (2013) Harrison F. A., et al., 2013, ApJ, 770, 103
- Ibragimov & Poutanen (2009) Ibragimov A., Poutanen J., 2009, MNRAS, 400, 492
- in ’t Zand et al. (1999) in ’t Zand J. J. M., et al., 1999, A&A, 345, 100
- in ’t Zand et al. (2001) in ’t Zand J. J. M., van Kerkwijk M. H., Pooley D., Verbunt F., Wijnands R., Lewin W. H. G., 2001, ApJ, 563, L41
- Kluźniak & Rappaport (2007) Kluźniak W., Rappaport S., 2007, ApJ, 671, 1990
- Kolehmainen et al. (2011) Kolehmainen M., Done C., Díaz Trigo M., 2011, MNRAS, 416, 311
- Kuulkers et al. (2003) Kuulkers E., den Hartog P. R., in’t Zand J. J. M., Verbunt F. W. M., Harris W. E., Cocchi M., 2003, A&A, 399, 663
- Kuulkers et al. (2015) Kuulkers E., et al., 2015, The Astronomer’s Telegram, 7098
- Long et al. (2005) Long M., Romanova M. M., Lovelace R. V. E., 2005, ApJ, 634, 1214
- Ludlam et al. (2017a) Ludlam R. M., et al., 2017a, ApJ, 836, 140
- Ludlam et al. (2017b) Ludlam R. M., Miller J. M., Cackett E. M., Degenaar N., Bostrom A. C., 2017b, ApJ, 838, 79
- Ludlam et al. (2017c) Ludlam R. M., Miller J. M., Degenaar N., Sanna A., Cackett E. M., Altamirano D., King A. L., 2017c, ApJ, 847, 135
- Ludlam et al. (2018) Ludlam R. M., et al., 2018, ApJ, 858, L5
- Markwardt & Swank (2005) Markwardt C. B., Swank J. H., 2005, The Astronomer’s Telegram, 495
- Miller et al. (1998) Miller M. C., Lamb F. K., Cook G. B., 1998, ApJ, 509, 793
- Mitsuda et al. (1984) Mitsuda K., et al., 1984, PASJ, 36, 741
- Mondal et al. (2017) Mondal A. S., Pahari M., Dewangan G. C., Misra R., Raychaudhuri B., 2017, MNRAS, 466, 4991
- Mukherjee et al. (2015) Mukherjee D., Bult P., van der Klis M., Bhattacharya D., 2015, MNRAS, 452, 3994
- Negoro et al. (2017) Negoro H., et al., 2017, The Astronomer’s Telegram, 10821
- Ortolani et al. (1994) Ortolani S., Barbuy B., Bica E., 1994, A&AS, 108, 653
- Papitto et al. (2009) Papitto A., Di Salvo T., D’Aì A., Iaria R., Burderi L., Riggio A., Menna M. T., Robba N. R., 2009, A&A, 493, L39
- Papitto et al. (2010) Papitto A., Riggio A., di Salvo T., Burderi L., D’Aì A., Iaria R., Bozzo E., Menna M. T., 2010, MNRAS, 407, 2575
- Papitto et al. (2013) Papitto A., et al., 2013, MNRAS, 429, 3411
- Patruno & Watts (2012) Patruno A., Watts A. L., 2012, preprint, (arXiv:1206.2727)
- Patruno et al. (2009) Patruno A., Altamirano D., Hessels J. W. T., Casella P., Wijnands R., van der Klis M., 2009, ApJ, 690, 1856
- Patruno et al. (2010) Patruno A., et al., 2010, The Astronomer’s Telegram, 2407
- Pintore et al. (2016) Pintore F., et al., 2016, MNRAS, 457, 2988
- Pintore et al. (2018) Pintore F., et al., 2018, MNRAS, 479, 4084
- Poutanen (2006) Poutanen J., 2006, Advances in Space Research, 38, 2697
- Psaltis & Chakrabarty (1999) Psaltis D., Chakrabarty D., 1999, ApJ, 521, 332
- Ross & Fabian (2005) Ross R. R., Fabian A. C., 2005, MNRAS, 358, 211
- Ross et al. (1999) Ross R. R., Fabian A. C., Young A. J., 1999, MNRAS, 306, 461
- Sanna et al. (2016) Sanna A., et al., 2016, MNRAS, 459, 1340
- Sanna et al. (2018a) Sanna A., et al., 2018a, preprint, (arXiv:1808.06796)
- Sanna et al. (2018b) Sanna A., et al., 2018b, A&A, 610, L2
- Verner et al. (1996) Verner D. A., Ferland G. J., Korista K. T., Yakovlev D. G., 1996, ApJ, 465, 487
- Wang et al. (2017) Wang Y., Méndez M., Sanna A., Altamirano D., Belloni T. M., 2017, MNRAS, 468, 2256
- Wilkins & Fabian (2012) Wilkins D. R., Fabian A. C., 2012, MNRAS, 424, 1284
- Wilkinson et al. (2011) Wilkinson T., Patruno A., Watts A., Uttley P., 2011, MNRAS, 410, 1513
- Wilms et al. (2000) Wilms J., Allen A., McCray R., 2000, ApJ, 542, 914
- Zdziarski et al. (1996) Zdziarski A. A., Johnson W. N., Magdziarz P., 1996, MNRAS, 283, 193
- Życki et al. (1999) Życki P. T., Done C., Smith D. A., 1999, MNRAS, 309, 561