NuSTAR Detection of Nonthermal Bremsstrahlung from the Supernova Remnant W49B
Abstract
We report on NuSTAR observations of the mixed morphology supernova remnant (SNR) W49B, focusing on its nonthermal emission. Whereas radio observations as well as recent gamma-ray observations evidenced particle acceleration in this SNR, nonthermal X-ray emission has not been reported so far. With the unprecedented sensitivity of NuSTAR in the hard X-ray band, we detect a significant power-law-like component extending up to , most probably of nonthermal origin. The newly discovered component has a photon index of with an energy flux between 10 and 20 keV of . The emission mechanism is discussed based on the NuSTAR data combined with those in other wavelengths in the literature. The NuSTAR data, in terms both of the spectral slope and of the flux, are best interpreted as nonthermal electron bremsstrahlung. If this scenario is the case, then the NuSTAR emission provides a new probe to sub-relativistic particles accelerated in the SNR.
1 Introduction
Particle acceleration in supernova remnants (SNRs) has extensively been studied with X-ray and gamma-ray observations (e.g., Reynolds, 2008; Aharonian, 2013). In the X-ray band, synchrotron radiation has almost exclusively been used as a channel to probe electrons accelerated in SNR shocks. Accelerated electrons are able to shine also in gamma rays through inverse Compton scattering (IC) mainly of the cosmic microwave background (CMB) or through bremsstrahlung. The hadronic component of accelerated particles can be probed with gamma rays resulting from the decay of mesons produced by interactions between accelerated protons/nuclei and ambient gas as evidenced by the characteristic spectral shape detected with Astro-rivelatore Gamma a Immagini Leggero (AGILE) Gamma-Ray Imaging Detector (Giuliani et al., 2011) and Fermi Gamma-ray Space Telescope Large Area Telescope (Fermi LAT; Ackermann et al., 2013).
The detection in gamma rays of SNR W49B by the Fermi LAT (Abdo et al., 2010; H.E.S.S. Collaboration, 2018) and by H.E.S.S. (H.E.S.S. Collaboration, 2018) made this object an interesting case for studies regarding particle acceleration. W49B is one of the most luminous gamma-ray-emitting SNRs in the Galaxy with , which requires a remarkably large energy density of emitting particles (either electrons or protons) of (Abdo et al., 2010). The gamma-ray emission can be interpreted either as decay or as electron bremsstrahlung (Abdo et al., 2010; H.E.S.S. Collaboration, 2018). Although the spectral break found at 300 MeV is suggestive of the former, the gamma-ray emission mechanism is still not conclusive (H.E.S.S. Collaboration, 2018).
Previous X-ray studies of W49B (e.g., Hwang et al., 2000; Miceli et al., 2006; Keohane et al., 2007; Lopez et al., 2013) focused on its bright thermal emission from the shock-heated plasma, which was found to be in a recombination-dominant state by Ozawa et al. (2009). Hard X-ray observations at are essential in order to search for possible nonthermal radiation for less contamination from the thermal emission. As discussed by Uchiyama et al. (2002a, b), among a few possible emission mechanisms in the hard X-ray band, nonthermal (inverse) bremsstrahlung from sub-relativistic particles is promising in the case of SNRs such as W49B, which is interacting with dense gas (Reach et al., 2006; Keohane et al., 2007). If detected, the bremsstrahlung component plays a role in disentangling the possible scenarios for the gamma-ray emission and also provides a probe to sub-relativistic portion of accelerated particles, which is not accessible with the above mentioned X-ray or gamma-ray emission channels.
In this Letter, we report on results from recently performed Nuclear Spectroscopic Telescope Array (NuSTAR; Harrison et al., 2013) observations of W49B, concentrating on its nonthermal aspect. A study of the thermal emission from the same observation is reported in a separate paper by Yamaguchi et al. (2018). Uncertainties quoted in the text and tables, as well as those plotted in figures, indicate 1 confidence intervals.
2 Observations and Data Reduction
We performed the NuSTAR observations of W49B on 2018 March 17–20 (Observation ID: 40301001002; PI: H. Yamaguchi). We reduced the data using the NuSTARDAS v.1.8.0 software package and the calibration database released on 2018 April 19. We reprocessed the data with the nupipeline tool in the software package. We discarded high background periods by applying a filter comparable to the saamode = optimized and tentacle = yes options in nupipeline. The effective exposure time after the filtering is 122 ks.
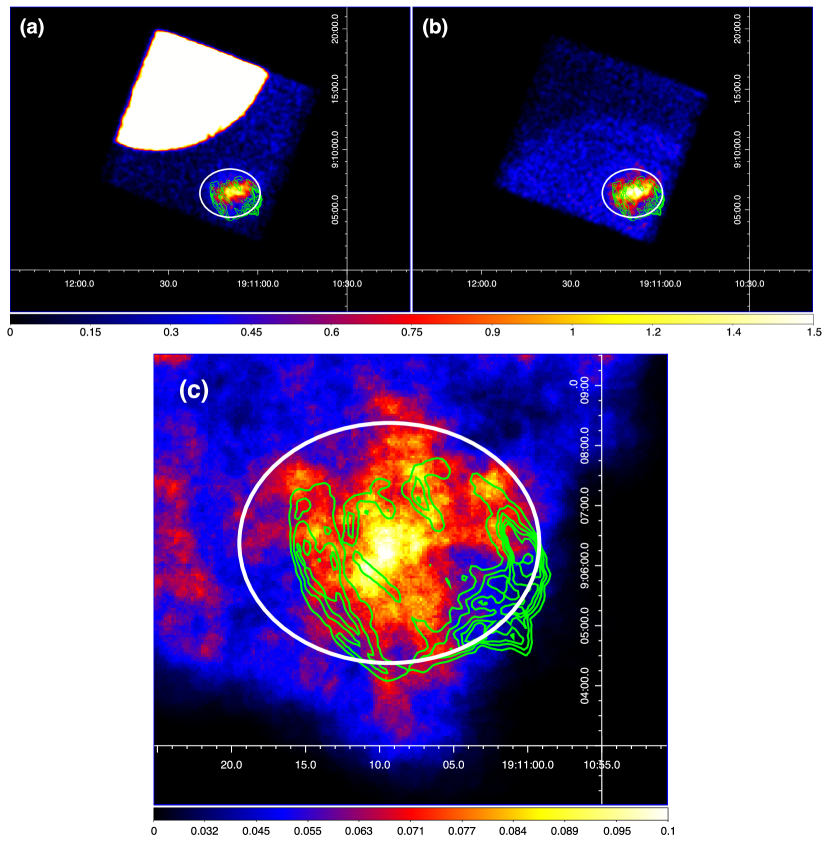
Figure 1 shows NuSTAR counts maps. A notable feature in the 9–20 keV band is stray light from the high-mass X-ray binary 4U 1908+075, which overlaps with W49B in the focal plane module B (FPMB) data. Although focal plane module A (FPMA) data also suffer from stray light from the microquasar GRS 1915+105, it does not affect the source extraction region. In the 15–20 keV band, where the thermal emission is almost negligible (see §3), a clear excess at the location of the SNR can clearly be seen.


| Component | Parameter | Value |
|---|---|---|
| RRC | (fixed) | |
| aaElectron temperature. | ||
| NormbbIntegration from to infinity. | ||
| Power Law | ||
| NormccEnergy flux integrated from 10 to 20 keV. | ||
| Constant | FactorddA constant factor multiplied to the model for the FPMB spectrum to account for possible cross-normalization uncertainties between FPMA and FPMB. | |
| c-stat | 528 | |
| 582 | ||
| d.o.f. | 605 |
3 Analysis and Results
Figure 2a shows background-subtracted spectra of W49B obtained with FPMA and FPMB in the energy range between 9 and 22 keV. The source extraction region encompasses the whole NuSTAR emission as indicated in Figure 1. The background models, plotted in Figure 2a with the data, were estimated using the nuskybgd script111https://github.com/NuSTAR/nuskybgd (Wik et al., 2014). The script provides models consisting of instrumental background, focused X-ray background, and stray light components. To model these components, spectra were extracted from three separate regions in each telescope focal plane, each square region centered on the detectors not containing W49B. The nuskybgd software adjusts the normalization of each standard background component based on fits to these spectra. In order to account for the stray light, additional spectral models, with appropriate responses, were manually added for the emission of the two stray light sources so that the background solution would not be biased by their extra flux. The best-fit model parameters for 4U 1908+075 in the FPMB observation were then used to add its contribution to the background spectra for all FPMB extraction regions of W49B by scaling it by the area of the region. This is because the stray light, being undeflected, produces a uniform pattern in the focal plane. The higher background of FPMB than that of FPMA in Figure 1 is attributed to the stray light contaminating the source extraction region.
Both FPMA and FPMB fluxes at appear to be higher than the extrapolations of the lower-energy data points, suggesting the presence of a hard tail in addition to the thermal component. To validate our background modeling, we extracted spectra from a region outside W49B, and also estimated the background for the region by running nuskybgd. We found that the spectra are consistent with the background model and that no significant hard tail emission is detected in the region, confirming the accuracy of the background model. Another demonstration of the background model accuracy comes from the consistency of the results from FPMA and FPMB (Figure 2) in spite of the different levels of the stray light contamination between the two sensors.
We fitted the spectra with a model composed of a thermal component and a power law. Following the recommendation found in the NuSTAR Analysis webpage,222https://heasarc.gsfc.nasa.gov/docs/nustar/analysis/ we multiplied a constant factor to the model for the FPMB data, and allowed it to vary in order to account for possible cross-normalization uncertainties. As the thermal component, we employed a recombination edge emission model, redge in the XSPEC package (Arnaud, 1996), considering the result by Ozawa et al. (2009) that the radiative recombination continuum (RRC) of He-like Fe is the dominant thermal component in this energy range. The edge energy of the RRC () was fixed at 8.83 keV. In the fitting procedure whose results are presented below, we included the background components predicted by nuskybgd as a model rather than subtracting it, and performed a maximum likelihood fitting based on the Cash statistic (Cash, 1979). Before fitting, the background models were smoothed with the “353QH twice” algorithm (Friedman, 1974) in order to remove artificial small structures due to statistical fluctuations. As a cross check, we also fitted the background-subtracted spectra using the W statistic (Wachter et al., 1979), in which the background in each energy bin is supposed to be expressed with its own parameter. We confirmed that the two results are consistent with each other.
The best-fit models are overlaid on the background-subtracted spectra in Figure 2b and the best-fit parameters are summarized in Table 1. The fit gave a relatively hard photon index () of the power-law component despite the large statistical error. A fit without a power law (null hypothesis) was also performed, yielding a c-stat of as compared to a c-stat of from the fit with a power law (alternative hypothesis). Thus, the test statistic (TS) of the power-law component is . In order to quantify the statistical significance of the power-law component, we ran Monte-Carlo simulations and generated spectra assuming the null hypothesis. We fit each of the simulated spectra with the models for the null and alternative hypotheses, and calculated TS in the same manner as for the observational data. We found TS only up to 13 in the simulated datasets, which indicates that the null hypothesis probability is less than .
4 Discussion
In the previous section, we described the detection of a hard tail in W49B with NuSTAR. If we interpret the hard tail as a thermal bremsstrahlung emission using the bremss model in the XSPEC package, we obtained 9.0 keV as a lower limit to the electron temperature, which is unrealistically high for an SNR. Thus, the emission detected with with NuSTAR is most likely of nonthermal origin.
Synchrotron X-rays have been detected in a number of young SNRs, and thus the hard tail emission could be synchrotron radiation. Under the assumption that synchrotron cooling is dominant, Zirakashvili & Aharonian (2007) gave a synchrotron cutoff energy as
| (1) |
where and are the shock speed and the so-called “gyrofactor”, respectively. Keohane et al. (2007) estimated the forward shock velocity in the X-ray emitting plasma to be . As Keohane et al. (2007) and Zhu et al. (2014) pointed out, the shock velocity should be much slower in the denser regions where infrared lines such as [Fe II] are detected. Thus, the above value can be regarded as an upper limit to the shock velocity of this SNR. Substituting in Equation (1), we obtain a cutoff energy of , which is about two orders of magnitude lower than the NuSTAR bandpass. The analytical formula for the synchrotron spectrum by Zirakashvili & Aharonian (2007), with the above cutoff energy, predicts that synchrotron emission has a steep spectrum corresponding to at 10 keV, which contradicts the hard NuSTAR spectrum. We, therefore, conclude that synchrotron is an unlikely explanation for the hard tail emission.


| Model | aaAmbient gas density. | bbTotal kinetic energy of radiating protons integrated above 10 MeV. The distance to W49B is assumed to be 10 kpc. | |||||||
|---|---|---|---|---|---|---|---|---|---|
| () | () | () | () | ( | () | ||||
| Hadronic | 2.0 | 2.8 | 30 | 5 | 100 | 100 | 0.01 | ||
| Leptonic | 2.0 | 2.9 | 10 | 10 | 100 | 25 | 100 | 1.0 |
IC would be another possible radiation channel to account for the hard tail emission. The photon index of is consistent with the radio index of (Moffett & Reynolds, 1994) so that the spectral slope of the hard X-ray component can be explained by IC from the same electron population as that emitting synchrotron photons in the radio band. However, this scenario faces difficulty in terms of energetics. When we consider the CMB and the interstellar radiation field (ISRF; e.g., Porter et al., 2006) as the seed photons, the radiating electrons are required to have a huge total energy of in order to raise the IC flux to the level of the hard X-ray flux we observed. Thus, the IC scenario is also unlikely.
The dense gas environment around W49B makes nonthermal bremsstrahlung either by electrons or protons a viable option as the scenario for the hard tail emission. Indeed, the hard spectrum is consistent with this scenario. If particles have a power-law spectrum in the form of , their bremsstrahlung spectrum becomes also a power law () with . Assuming the canonical value for the the spectral index of the particle energy distribution from diffusive shock acceleration, , we expect the bremsstrahlung spectrum has . However, because of the ionization loss, the particle spectrum is “loss-flattened” below a break energy , which is determined by equating the ionization loss timescale and particle injection timescale (Uchiyama et al., 2002a, b). Therefore, bremsstrahlung spectra below the corresponding break should be hard with .
For more quantitative discussion, we calculate emission models to explain the spectral energy distribution (SED) of nonthermal radiation of W49B from radio to gamma rays. Protons and electrons are injected to the emitting region with a constant luminosity. We assumed the injection spectra in the form of
| (2) |
which has a smooth spectral break at and an exponential cutoff at . We define the electron-to-proton ratio as . The particle spectra are deformed as a result of radiative and nonradiative cooling. The kinetic equations for protons and electrons,
| (3) |
where denotes momentum loss rate, are solved to obtain , particle spectra after the deformation. We take into account cooling by ionization, bremsstrahlung, synchrotron, IC, and decay to calculate . We solve Equation (2) for to obtain , and we then calculate radiation spectra of bremsstrahlung, synchrotron, IC, and decay. The prescriptions by Kamae et al. (2006) are used for the calculation of -decay spectra. In addition to the CMB, we include the ISRF at the location of W49B taken from GALPROP (Porter et al., 2006) as seed photons for IC.
We present the calculation results overlaid on multi-wavelength data including the NuSTAR data in Figure 3, and summarize the model parameters in Table 2. We here show two models: the gamma-ray emission is predominantly ascribed to decay in one model (hadronic model; Figure 3a) and to electron bremsstrahlung in the other model (leptonic model; Figure 3b). In the calculation, we assumed the gas density of , which is roughly consistent with the estimate by H.E.S.S. Collaboration (2018). The magnetic field strength was determined so that the synchrotron flux match the radio data. The other parameters concerning the particle spectra were chosen so that the shapes of the model curves match the data. Although the southwestern corner of W49B is close to the field of view of NuSTAR, we assumed that the entire emission of the SNR is covered. This assumption would be justified to some extent as the best-fit positions of the gamma-ray emissions, including that of the Fermi LAT, which is located near the western edge of the SNR, are within the field of view. Both models reproduce the spectral slope of electron bremsstrahlung in the hard X-ray band consistent with the NuSTAR measurement. However, the two models predict largely different fluxes in the NuSTAR bandpass. The leptonic model nicely fits the NuSTAR data, whereas the electron bremsstrahlung component of the hadronic model falls short of the observed hard X-ray flux by about one order of magnitude. The contribution from proton bremsstrahlung is almost negligible even in the hadronic model. We conclude that the leptonic model fits better the data as far as a simple one-zone model is considered.
The leptonic model plotted in Figure 3 (b) requires a large electron-to-proton ratio of . This challenges the current understanding of diffusive shock acceleration as electrons are generally difficult to inject into an acceleration process (e.g., Park et al., 2015). In order to avoid this and to make the hadronic model a possible option, another electron population that is accelerated only up to sub-relativistic energies would be helpful. If we assume a cutoff at in the spectrum of the second electron population, the electrons shine only in the hard X-ray band through bremsstrahlung with negligible contributions to the radio band through synchrotron and to the gamma-ray band through bremsstrahlung. We emphasize that, even in this case, electron bremsstrahlung is the most plausible emission process to account for the hard X-ray data.
If electron bremsstrahlung is indeed the emission mechanism responsible for the NuSTAR emission, the radiating electron population should be in the sub-relativistic regime with kinetic energies of . In addition to bremsstrahlung, those electrons can cause K-shell ionization of ambient Fe atoms and can emit the K line at 6.4 keV (Dogiel et al., 2011; Nobukawa et al., 2018; Okon et al., 2018; Saji et al., 2018). Nonthermal bremsstrahlung in the hard X-ray band, therefore, should always be accompanied by the neutral Fe K line. The equivalent width (EW) of the line with respect to the nonthermal bremsstrahlung component is if the Fe abundance is consistent with solar (Dogiel et al., 2011). By extrapolating the power law to lower energies and assuming an emission line at 6.4 keV with , we found that NuSTAR cannot detect the line because of the bright thermal emission. Analyzing the NuSTAR data below 9 keV, we indeed did not see any hints of a line structure at 6.4 keV. It is of interest to search for the line in data taken with charge-coupled device cameras on board other operating observatories, which have better energy resolution at that energy. Eventually, X-ray micro-calorimeters on board future X-ray astronomy satellites such as XRISM (formerly known as XARM) and Athena can easily detect the line. Detection of the neutral Fe K line as well as its EW with respect to the continuum detected by NuSTAR will help us confirm the radiation mechanism of the hard X-ray emission and will provide us with further information about the spectra of sub-relativistic particles accelerated in this SNR.
References
- Abdo et al. (2010) Abdo, A. A., Ackermann, M., Ajello, M., et al. 2010, ApJ, 722, 1303
- Ackermann et al. (2013) Ackermann, M., Ajello, M., Allafort, A., et al. 2013, Science, 339, 807
- Aharonian (2013) Aharonian, F. A. 2013, Astroparticle Physics, 43, 71
- Arnaud (1996) Arnaud, K. A. 1996, Astronomical Data Analysis Software and Systems V, 101, 17
- Cash (1979) Cash, W. 1979, ApJ, 228, 939
- Dogiel et al. (2011) Dogiel, V., Chernyshov, D., Koyama, K., Nobukawa, M., & Cheng, K.-S. 2011, PASJ, 63, 535
- Friedman (1974) Friedman, J. H. 1974, Proceedings of the 1974 CERN School of Computing, 271
- Giuliani et al. (2011) Giuliani, A., Cardillo, M., Tavani, M., et al. 2011, ApJ, 742, L30
- Harrison et al. (2013) Harrison, F. A., Craig, W. W., Christensen, F. E., et al. 2013, ApJ, 770, 103
- H.E.S.S. Collaboration (2018) H.E.S.S. Collaboration, Abdalla, H., Abramowski, A., et al. 2018, A&A, 612, A5
- Hwang et al. (2000) Hwang, U., Petre, R., & Hughes, J. P. 2000, ApJ, 532, 970
- Kamae et al. (2006) Kamae, T., Karlsson, N., Mizuno, T., Abe, T., & Koi, T. 2006, ApJ, 647, 692
- Keohane et al. (2007) Keohane, J. W., Reach, W. T., Rho, J., & Jarrett, T. H. 2007, ApJ, 654, 938
- Lopez et al. (2013) Lopez, L. A., Ramirez-Ruiz, E., Castro, D., & Pearson, S. 2013, ApJ, 764, 50
- Miceli et al. (2006) Miceli, M., Decourchelle, A., Ballet, J., et al. 2006, A&A, 453, 567
- Moffett & Reynolds (1994) Moffett, D. A., & Reynolds, S. P. 1994, ApJ, 437, 705
- Nobukawa et al. (2018) Nobukawa, K. K., Nobukawa, M., Koyama, K., et al. 2018, ApJ, 854, 87
- Okon et al. (2018) Okon, H., Uchida, H., Tanaka, T., Matsumura, H., & Tsuru, T. G. PASJ, in press
- Ozawa et al. (2009) Ozawa, M., Koyama, K., Yamaguchi, H., Masai, K., & Tamagawa, T. 2009, ApJ, 706, L71
- Park et al. (2015) Park, J., Caprioli, D., & Spitkovsky, A. 2015, Physical Review Letters, 114, 085003
- Porter et al. (2006) Porter, T. A., Moskalenko, I. V., & Strong, A. W. 2006, ApJ, 648, L29
- Reach et al. (2006) Reach, W. T., Rho, J., Tappe, A., et al. 2006, AJ, 131, 1479
- Reynolds (2008) Reynolds, S. P. 2008, ARA&A, 46, 89
- Saji et al. (2018) Saji, S., Matsumoto, H., Nobukawa, M., et al. 2018, PASJ, 70, 23
- Uchiyama et al. (2002a) Uchiyama, Y., Takahashi, T., & Aharonian, F. A. 2002a, PASJ, 54, L73
- Uchiyama et al. (2002b) Uchiyama, Y., Takahashi, T., Aharonian, F. A., & Mattox, J. R. 2002b, ApJ, 571, 866
- Yamaguchi et al. (2018) Yamaguchi, H., Tanaka, T., Wik, D. R., et al. 2018, ApJ, submitted
- Wachter et al. (1979) Wachter, K., Leach, R., & Kellogg, E. 1979, ApJ, 230, 274
- Wik et al. (2014) Wik, D. R., Lehmer, B. D., Hornschemeier, A. E., et al. 2014, ApJ, 797, 79
- White et al. (2005) White, R. L., Becker, R. H., & Helfand, D. J. 2005, AJ, 130, 586
- Zhu et al. (2014) Zhu, H., Tian, W. W., & Zuo, P. 2014, ApJ, 793, 95
- Zirakashvili & Aharonian (2007) Zirakashvili, V. N., & Aharonian, F. 2007, A&A, 465, 695