Narrow Transient Absorptions in Late-Time Optical Spectra of Type Ia Supernovae:
Evidence for Large Clumps of Iron-Rich Ejecta?
Abstract
An examination of late-time, optical spectra of type Ia supernovae revealed surprisingly narrow absorption features which only become visible a few months after maximum light. These features, most clearly seen in the late-time spectra of the bright, recent type Ia supernovae ASASSN-14lp and SN 2017bzc, appear as narrow absorptions at 4840 Å, 5000 Å, and as a sharp inflection at 4760 Å on the red side of the prominent late-time 4700 Å feature. A survey of on-line archival data revealed similar features present in the spectra of ten other normal and 91T-like SNe Ia, including SN 2011fe. Unlike blue spectral features which exhibit progressive red-ward shifts, these narrow absorptions remain at the same wavelength from epoch to epoch for an individual SN, but can appear at slightly different wavelengths for each object. These features are also transient, appearing and then fading in one to three months. After ruling out instrumental, data reduction, and atmospheric affects, we discuss possible explanations including progenitor mass-loss material, interaction with material from previous novae events, and absorption by large discrete clumps of high-velocity Fe-rich ejecta.
Subject headings:
Supernovae: General, Line Formation1. Introduction
The current consensus is that a thermonuclear explosion of a carbon-oxygen white dwarf in a binary system is at the heart of all type Ia supernovae (SNe Ia) events (Hoyle & Fowler 1960; Hillebrandt & Niemeyer 2000). However, the nature of the progenitor system of a SN Ia has not yet been firmly established as a variety of progenitor models can reproduce the observed explosions characteristics.
Single-degenerate models require a CO white dwarf accreting mass from a nondegenerate companion star. Once the white dwarf reaches the Chandrasekhar mass (MCh) of 1.4 M⊙, it explodes as a SN Ia producing intermediate mass elements (IMEs) and 0.6 M⊙of nickel. An alternative single-degenerate model involves a sub-MCh white dwarf that explodes via He shell ignition which triggers the CO detonation and a subluminous explosion (Nomoto 1982; Hoeflich & Khokhlov 1996). Double-degenerate models resulting in a SN Ia invoke a system of two white dwarfs that either merge violently (Kushnir et al. 2013; Raskin et al. 2014) or explode when the primary white dwarf accretes the secondary (Kashyap et al. 2015).
In addition to multiple progenitor systems, there are also a few different explosion mechanisms that can lead to a SN Ia. A pure detonation model converts the entire white dwarf mass into 1.4 M⊙56Ni and does not produce any of the observed IMEs (Arnett et al. 1971). On the other hand, a slow burning “deflagration” wave within the white dwarf creates the IMEs, but over produces the amount of synthesized Ni (Nomoto et al. 1984). The more successful models invoke a deflagration to detonation transition (DDT) or “delayed-detonation”, where the explosion begins with a subsonic deflagration wave that, upon reaching supersonic speeds, leads to the detonation of the white dwarf (Khokhlov 1991; Hillebrandt & Niemeyer 2000; Gamezo et al. 2005).
While the overall photometric and spectroscopic properties are consistent across the majority of SNe Ia suggesting a repeatable explosion mechanism (Branch et al. 2008), it is becoming increasingly clear that there is a larger variety of SNe Ia than originally thought. As such, a single ubiquitous progenitor channel may not be able to describe the many observed subtypes (Howell 2011; Maoz & Mannucci 2012; Dilday et al. 2012; Patat et al. 2013; Wang et al. 2013).
Two to three months after maximum brightness as the ejecta become increasingly transparent, SNe Ia transition into the so-called nebular phase when the spectra become dominated by forbidden line emission (Axelrod 1980; Bowers et al. 1997; Stritzinger et al. 2006). Studies of the nebular phase are somewhat limited because there are few SNe with high signal-to-noise spectra out to day +100 and fewer at even later epochs. Additionally, the time coverage of observations is not uniform across individual SNe, producing a somewhat incomplete late-time picture.
At late times, SN Ia spectra are dominated by strong, blue emission-like features with the strongest feature seen at 4700 Å flanked by weaker features at 4300, 5000, and 5300 Å. Current late-time Ia models fit the nebular spectra using mainly [Fe II], [Fe III], [Co III], and [Ni II] forbidden emission lines, where the 4700 Å feature has most often been viewed as a blend of forbidden Fe emission lines, including [Fe II] 4814 Å and [Fe III] 4658, 4702, 4734 Å resulting in a central wavelength of 4701 Å (Bowers et al. 1997; Mazzali et al. 2015; Childress et al. 2015; Botyánszki & Kasen 2017).
It has been known since the mid-twentieth century that the prominent late-time feature at 4700 Å is not constant in wavelength, but shifts steadily towards longer wavelengths with time beginning a few weeks after maximum light (Minkowski 1939; Bertola 1962, 1965; McLaughlin 1963). Recently, this shift has been interpreted as a change in radial velocity where the [Fe II] and [Fe III] begin heavily blueshifted by roughly 4000 km s-1 at earlier times (Maeda et al. 2011; Silverman et al. 2013) then drift past the rest velocity to about +1500 km s-1at very late times (Pan et al. 2015; Graham et al. 2015, 2017). However, Fransson & Jerkstrand (2015) claim that a change of ionization of Fe++ to Fe0 can explain the observed late-time red shifts.
Black et al. (2016) showed that the 4700 Å blend is not the only feature that drifts to the red and that two adjacent features at 4850 and 5000 Å move at roughly the same rate. This suggests that a common cause is responsible for the observed redshifts of these late-time, blue spectral features. They argued that SNe Ia as late as +300 days have not fully transitioned from the photospheric to nebular phase and that these features are the result of permitted absorptions in a blue continuum creating the appearance of ‘pseudo-emission’ features.
Black et al. (2016) proposed that strong permitted Fe II absorptions in a receding photosphere could explain how the apparent emission features at 4700, 4850, and 5000 Å seemingly shift passed their supposed zero-velocity wavelength. This explanation is supported by spectral models that use mostly permitted Fe absorptions in combination with a forbidden line emission (Friesen et al. 2014; Blondin et al. 2015) or only permitted lines (Branch et al. 2008, 2009) to fit the data. Such models not only fit the major and minor features in the spectra, but are adept at fitting the features as they shift.
Examination of recent, late-time spectra of SNe Ia, revealed a few weak, blue absorption features that do not exhibit a redward shift. These features are relatively narrow but broader than typical interstellar medium (ISM) absorption. A subsequent search through the published and on-line data archives revealed nearly a dozen SNe Ia with spectra taken between 50 and 200 days that show evidence of these same puzzling features, indicating that these absorption features are not especially rare.
Here we present an examination of the spectra of 12 SNe Ia in order to investigate the nature of these narrow features. Our data set and observations are described in §2, analysis of the narrow features is described in §3, and our discussion of these results and possible explanations are given in §4. In §5 we summarize our findings.
2. Data Set
A sample of high signal-to-noise, late-time Ia spectra was compiled using the following SN databases: the Open Supernova Catalog (OSC; Guillochon et al. 2017), the Weizmann Interactive Supernova Data Repository (WISeREP; Yaron & Gal-Yam 2012) and the UC Berkeley Supernova Database (SNDB) which is a part of the Berkeley SN Ia Program (BSNIP; Silverman et al. 2012). SNe were selected based on the availability of good S/N and late-time spectra at epochs between +50 and +200 days post-max. Our archival sample contains 40 optical, late-time spectra of 10 SNe Ia and have been corrected for redshift. In addition, observations of the bright SNe Ia ASASSN-14lp and SN 2017bzc described below, are included in this sample.
2.1. ASASSN-14lp
SN Ia ASASSN-14lp in NGC 4666 (z = 0.00510) was the second brightest SN of 2014, reaching a peak magnitude of V = 11.94 mag on 24 December 2014 with a m15 of 0.79 (Shappee et al. 2015). Moderate resolution spectra of 2 Å (R 20003000) with a 0.7 Å pix-1 dispersion of ASSASN-14lp were taken using a 1.2′′ slit, with exposure times of 2400 s and 4000 s in March and April 2015 at days 87, 114, respectively, with the MDM 2.4m telescope using the Ohio State Multi-Object Spectrograph (OSMOS).
A follow-up 900 s spectrum was obtained in May 2015 (day 149) with the South African Large Telescope (SALT) using the Robert Stobie Spectrograph (RSS) with a 1.5′′ slit and 1300 lines per mm grating for a resolution of 4 Å and a dispersion of 0.8 Å pix-1.
2.2. SN 2017bzc
SN Ia SN 2017bzc was discovered pre-maximum brightness on 7 March 2017 located at (2000) = 23h 16m 14.69s, (2000) = 42∘ 34′ 109 in NGC 7552 by the Backyard Observatory Supernova Search (BOSS) (Parker et al. 2017; Morrell et al. 2017). It is situated to the northeast of the galaxy center, outside of the host galaxy in a relatively uncontaminated region. Optical spectra with 5 Å resolution and a dispersion of 1.0 Å pix-1 were taken with the Robert Stobie Spectrograph (RSS) at SALT with grating of 900 lines per mm and 1.5′′ longslit.
We adopt 15 March 2017 as the date of maximum brightness with a Vmax 12.2 mag. Observations were made at day 103, 107, 133, 165, and 239 spanning the wavelength range 3200 6400 Å and at days 102, 132, and 164 for the 6000 9200 Å part of the spectrum with exposure times ranging from 600 to 1200 s for both red and blue regions. Two tilts were done at each epoch (except day 239) in order to cover the chip gaps.
Data reduction for both SNe was done using IRAF111IRAF is distributed by the National Optical Astronomy Observatories, which are operated by the Association of Universities for Research in Astronomy, Inc., under cooperative agreement with the National Science Foundation. and consisted of bias and background subtraction, wavelength calibration, aperture extraction, and host galaxy redshift correction.
3. Results
3.1. Narrow, Late-Time Absorption Features
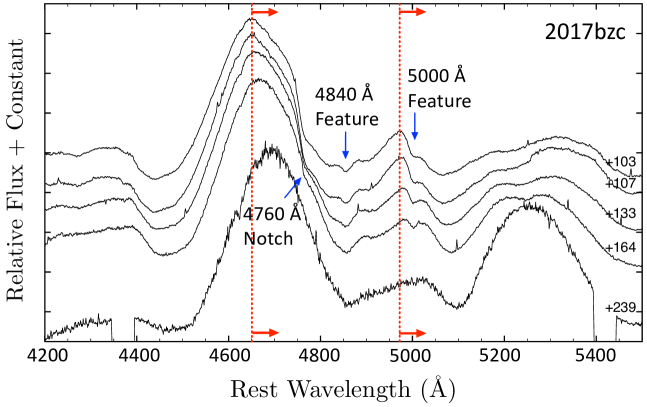
During our analysis of late-time SNe Ia spectra (Black et al. 2016), examination of the near and bright SN Ia ASASSN-14lp revealed some unexpectedly narrow absorption features. These include a small narrow absorption at 5000 Å, a weak absorption at 4840 Å, and a sharp inflection or ‘notch’ at 4760 Å, on the red side of the prominent late-time 4700 Å feature. Subsequent examination of another recent bright, late-time spectra of SN 2017bzc showed similar features.
Figure 1 presents high S/N spectra of SN 2017bzc covering the region 4200 - 5500 Å at day +103, +107, +133, +164, and +239. The red dotted lines mark the approximate central wavelengths of the 4700 and 5000 Å emission features at day +103 with red arrows indicating their progressive redward shift with time.
As can be seen in Figure 1, these three weak absorptions do not shift with time. This is unlike the strong 4700 Å and several blue spectral features which show progressive red shifts of 40 Å or more at late times (Black et al. 2016).
The stationary nature of these absorption features is especially apparent in the 5000 Å region where the weak but broad emission feature shifts redward “underneath” the narrow absorption. Consequently, the absorption appears on the red side of the 5000 Å emission at day +103, but by days +133 and +164 the absorption is nearly centered on the emission. Examination of spectra covering 6000 - 9200 Å did not reveal any similar narrow and stationary features.
| SN | mmax(B) | m15 (B) | Subtype | References |
|---|---|---|---|---|
| 1994ae | 13.21 | 0.86 | normal | Riess et al. (1999) |
| 1997do | 14.56 | 0.99 | normal | Jha et al. (2006) |
| 2000cx | 13.43 | 0.93 | 91T-like/pec | Li et al. (2001); Blondin et al. (2012) |
| 2001V | 14.60 | 0.9-0.99 | 91T | Vinkó et al. (2003) |
| 2004bv | 13.89 | 0.88 | normal | Ganeshalingam et al. (2010) |
| Silverman et al. (2012) | ||||
| 2007sr | 12.71 | 1.05-1.13 | normal | Ganeshalingam et al. (2010) |
| Blondin et al. (2012) | ||||
| 2011fe | 9.9 | 1.05 | normal | Munari et al. (2013); Mazzali et al. (2014) |
| 2012fr | 12.0 | 0.80-0.85 | 91T-like | Childress et al. (2013); Zhang et al. (2014) |
| Silverman et al. (2015) | ||||
| 2013dy | 13.28 | 0.92 | normal | Zheng et al. (2013); Pan et al. (2015) |
| 20014J | 10.61a | 1.01-1.12 | normal | Foley et al. (2014); Galbany et al. (2016) |
| ASASSN-14lp | 11.94a | 0.79 | normal | Shappee et al. (2015) |
| 2017bzc | 12.2a | unknown | unknown | Parker et al. (2017) |
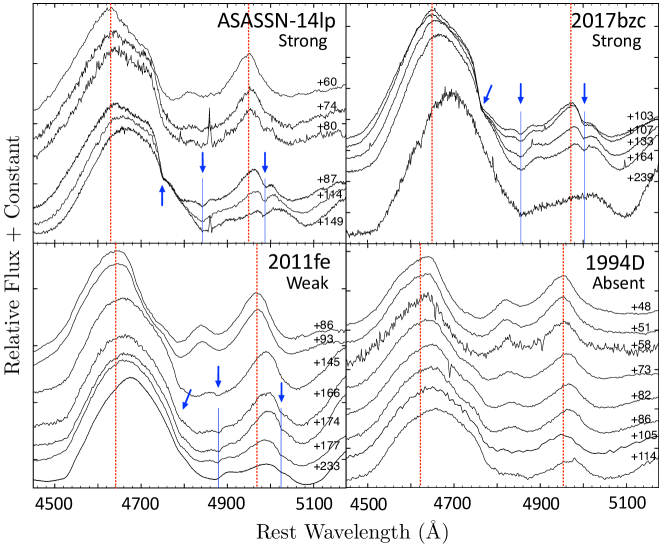
To illustrate that these features maintain constant wavelengths, Figure 2 shows the spectra of ASASSN-14lp and SN 2017bzc stacked with flux normalized to the 4760 Å notch. The blue arrows indicate the three narrow features, while the thin blue solid lines mark the approximate centers of the 4840 and 5000 Å absorptions, with the red dotted lines the same as those in Figure 1. As can be seen, all three features - 4760, 4840, and 5000 Å - show no change in wavelength.
Interestingly, late-time spectra of the bright SN Ia SN 2011fe (bottom right panel) shows indications that these absorptions may also be present. However, unlike ASASSN-14lp and SN 2017bzc, the features in SN 2011fe are much weaker and appear at later epochs (See Fig. 2). For comparison, in bottom left panel we show the spectra of the normal SN 1994D, which does not show these narrow absorptions.
In the spectra of ASASSN-14lp and SN 2017bzc, the wavelength of the 4760 Å notch is strikingly consistent, even at epochs 60 days apart. While the strong 4700 Å emission feature shifts steadily towards the red, the notch on the red side of the 4700 Å profile remains remarkably constant in wavelength. This is especially apparently in the spectra of ASASSN-14lp.
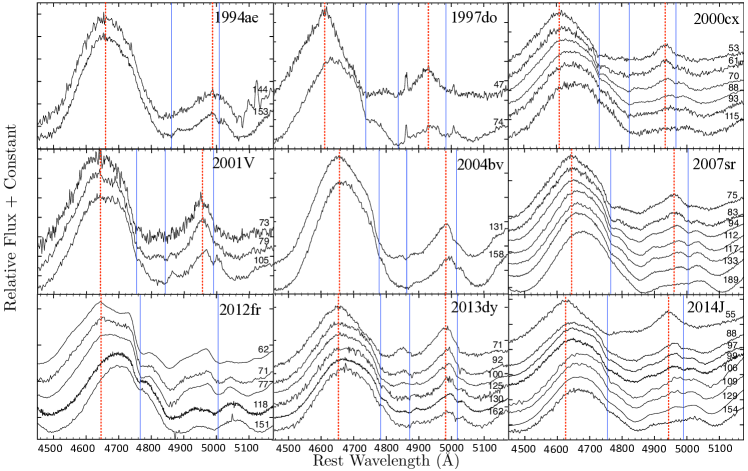
A subsequent search of on-line SNe spectral catalogues found nine additional SNe Ia which exhibit evidence for these same features (see Table 1). Figure 3 shows the spectra of the other nine SNe that present narrow absorptions, where the dotted and solid lines are the same as those seen in Figure 2. We note that a few additional SNe Ia, including 1995al, 1999ac, and 2007gi, may also exhibit similar absorptions, but are excluded due to weak detections.
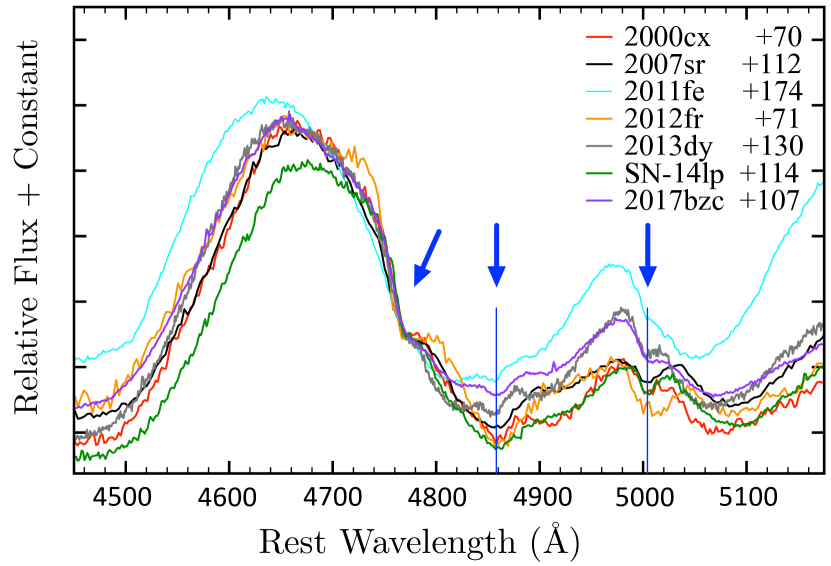
In Figure 4 we show the spectra of seven SNe Ia (2000cx, 2007sr, 2011fe, 2012fr, 2013dy, ASASSN-14lp, and 2017bzc) stacked such that the wavelengths of the 4760 Å notches are aligned with that of SN 2017bzc, thus ignoring wavelength differences exhibited by the individual SNe. Plotted in this way, the three narrow features seen in these six different SNe Ia all exhibit virtually identical separations from one another, emphasized by the blue line which denotes the center wavelengths of the features in SN 2017bzc. This indicates that the relationship between these absorptions is repeatable, including the case of the unusually broad absorption features in SN 2012fr.
The width of the 5000 Å feature varies amongst our SNe sample (see Fig. 4). We find a range in FWHM for the 5000 Å feature of roughly 10 to 35 Å and does not appear to be correlated to the wavelength of the feature. While the absorption at 4840 Å is distinct in some SNe Ia, like ASASSN-14lp and SN 2017bzc, it is not seen in the entire sample and only definitively visible in nine SNe in our sample.
A noticeable difference between SNe Ia that show these features and those that do not, such as the prototypical SN Ia 1994D (Fig. 2), is the epoch at which the broad, but weak emission feature at 4850 Å disappears. It was shown in Black et al. (2016) that this feature fades in nearly all SNe Ia, with SN 2011fe being an exception (see Fig. 5 of Black et al. 2016). It can be seen in Figures 2 and 3 that the emission feature at 4850 Å disappears from the spectra of the “14lp-like” SNe at generally earlier epochs ( +60-70 days) than the 94D-like SNe ( +100 day). The feature lingers much longer in SN 2011fe, making it a clear outlier among the SNe that exhibit these features.
Since high S/N, high cadence spectral data of SNe Ia past day +100 are still relatively uncommon, most of the time coverage in our sample do not show the full evolution of these features. Some SNe, like 2001V, only have one or two spectra that show evidence of the weak absorptions. Other SN Ia, like 2012fr, have a number of spectra and are more extreme examples with unusually strong and broad 4850 & 5000 Å features.
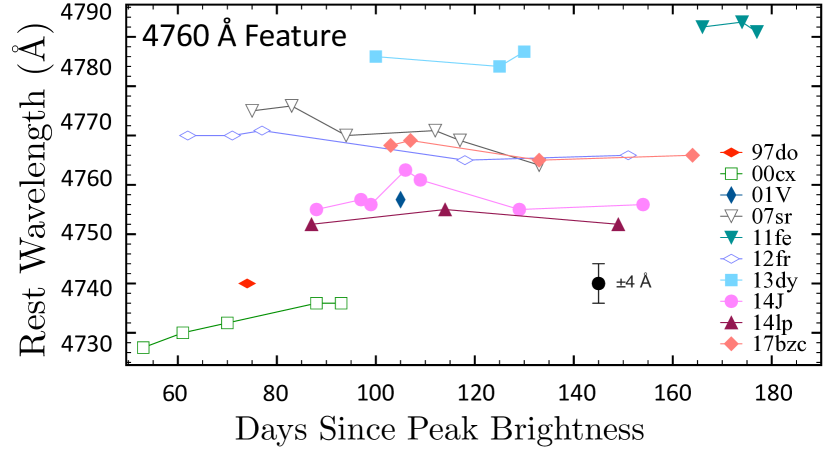
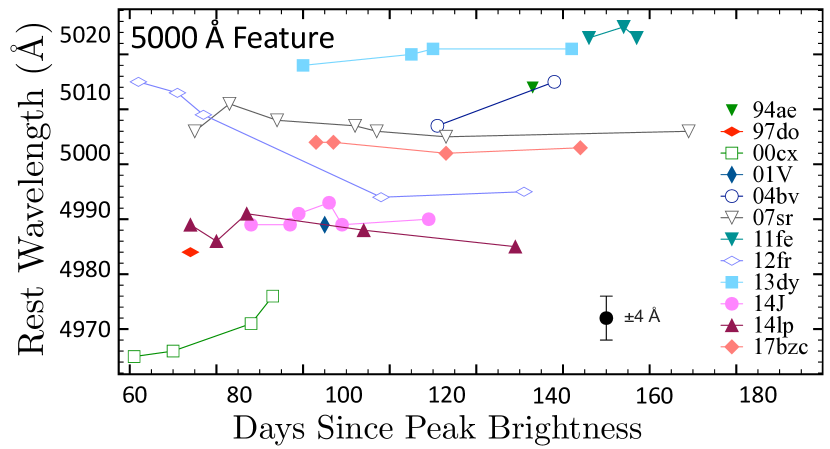
3.2. Feature Wavelengths and Separations with Time
Examination of the available spectra reveals that, from object to object, all three features maintain nearly constant wavelengths to within measurement error (4 Å). The exception is SN 2012fr. The 5000 Å feature in SN 2012fr exhibits an apparent blueshift of 15-20 Å between days +77 and +118.
Figures 5 and 5 plots the wavelengths of the 4760 and 5000 Å features for each SN Ia versus time. Additionally, the absorptions exhibit roughly similar central wavelengths across our sample, but with a range of up to 30 Å. This consistency throughout our sample suggests a common cause connecting these three features.
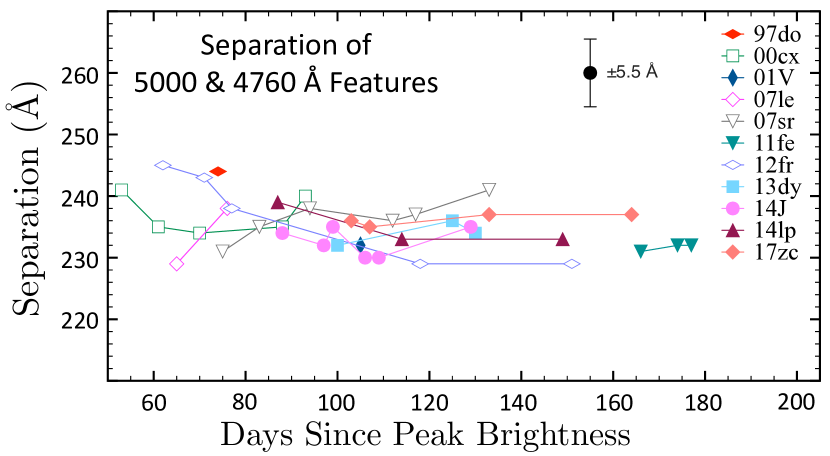
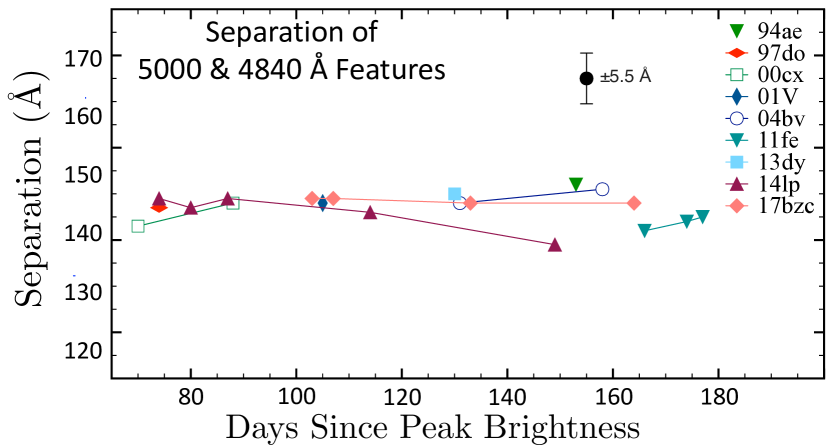
Figures 5 and 5 depict the separations between the 5000 and 4760 Å features and the 5000 and 4840 Å features near day +100, respectively. These narrow absorptions are found to exhibit the same separations within a few Angstrom of each other for nearly every SN Ia in the sample, where SN 1997do is the single outlier. Even the features in the extreme case of SN 2012fr fall within these separations as well as SN 2011fe despite its features found higher wavelengths.
3.3. The Transient Nature of these Features
The spectra of SN Ia in the nebular phase evolve relatively slowly. In contrast, however, these narrow absorptions appear and then disappear in a matter of just 1 3 months. For a majority of SNe, the narrow absorptions are present in the spectra roughly simultaneously, including the 4840 Å feature. A few SN Ia do not show the 4760 Å notch, though this may be the result of low S/N spectra since the initial appearance of the feature can be subtle.
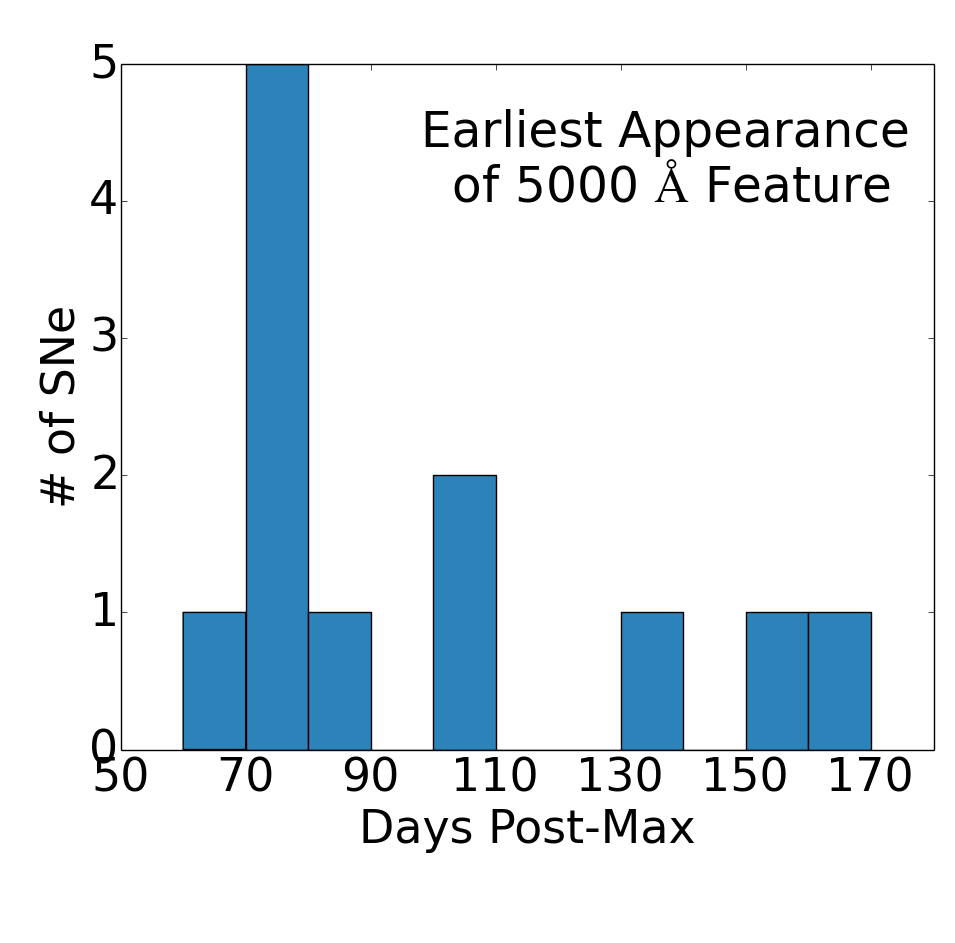
In most of our 12 SNe, the features are initially present between +60 and +90 days, though they can appear later than day +130, as seen in SNe 1994ae, 2004bv, and 2011fe. Three SNe in the sample have spectra that show the absorptions’ entire evolution, SNe 2000cx, 2007sr, and 2014J, where the features are seen to last for roughly 30 to 60+ days. Spectra of SN 2014J at days +106, +109, and +129 are from Zhang et al. (2018). In the case of SN 2012fr, despite lacking full time coverage, the features remain in the spectra for nearly 100 days. The length of time the features are visible varies from SNe to SNe and these absorptions can be seen for at least 1 3 months before disappearing from the spectra.
Figure 6 shows the earliest appearance of the 5000 Å in the available spectra, but due to gaps in the late-time observations these values reflect the earliest day that the features can be seen in the available data, not necessarily the epoch they first appear.
3.4. Distribution Across SNe Ia Subtypes
Our sample includes both normal and 91T-like SNe. Table 1 lists the SNe in our sample with their peak B magnitude, m15, and their SN Ia classification. To date, no near max spectra or photometry have been published for SN 2017bzc, so in this work its m15 and classification are listed as ‘unknown’ in Table 1 and Figure 7.
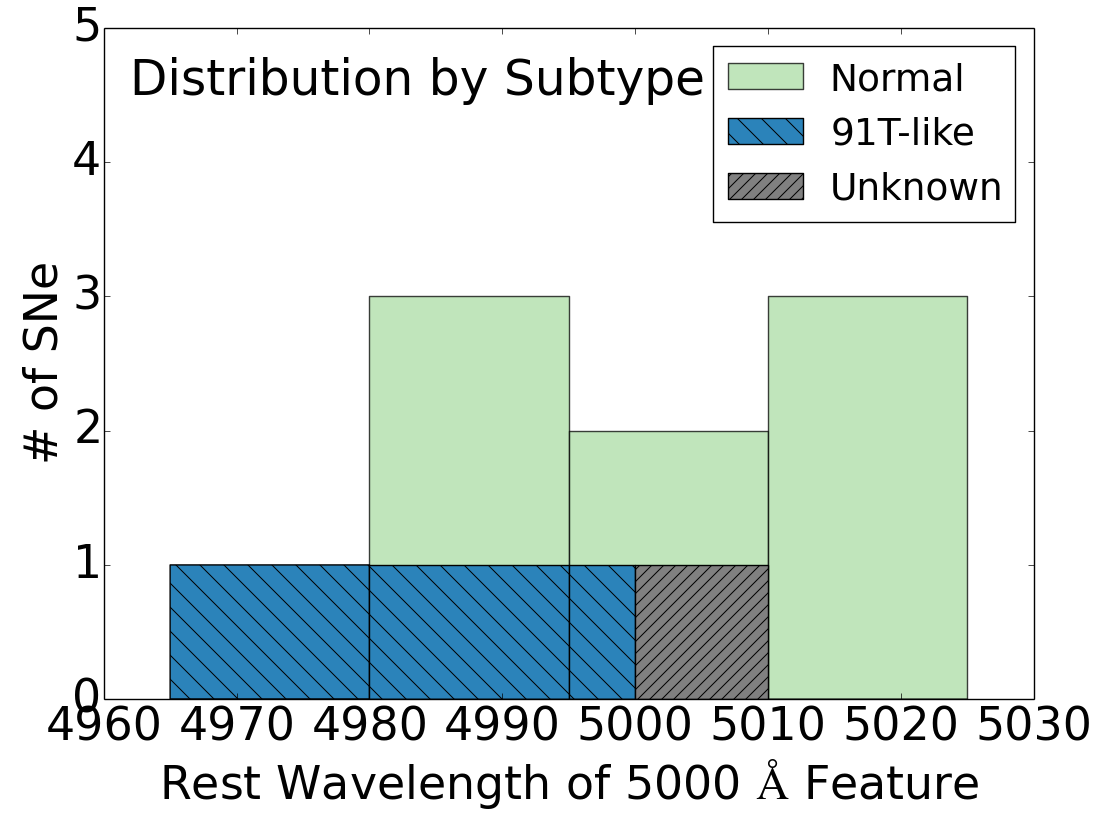
These narrow absorptions are not limited to any one SN Ia subtype as they appear in both normal and 91T-like SNe. Figure 7 shows how the SN type relates to the wavelength of the 5000 Å feature near day +100. There appears to be a trend where 91T-like SNe have a bluer 5000 Å feature than normal Ia’s, though a larger sample is needed to be certain.
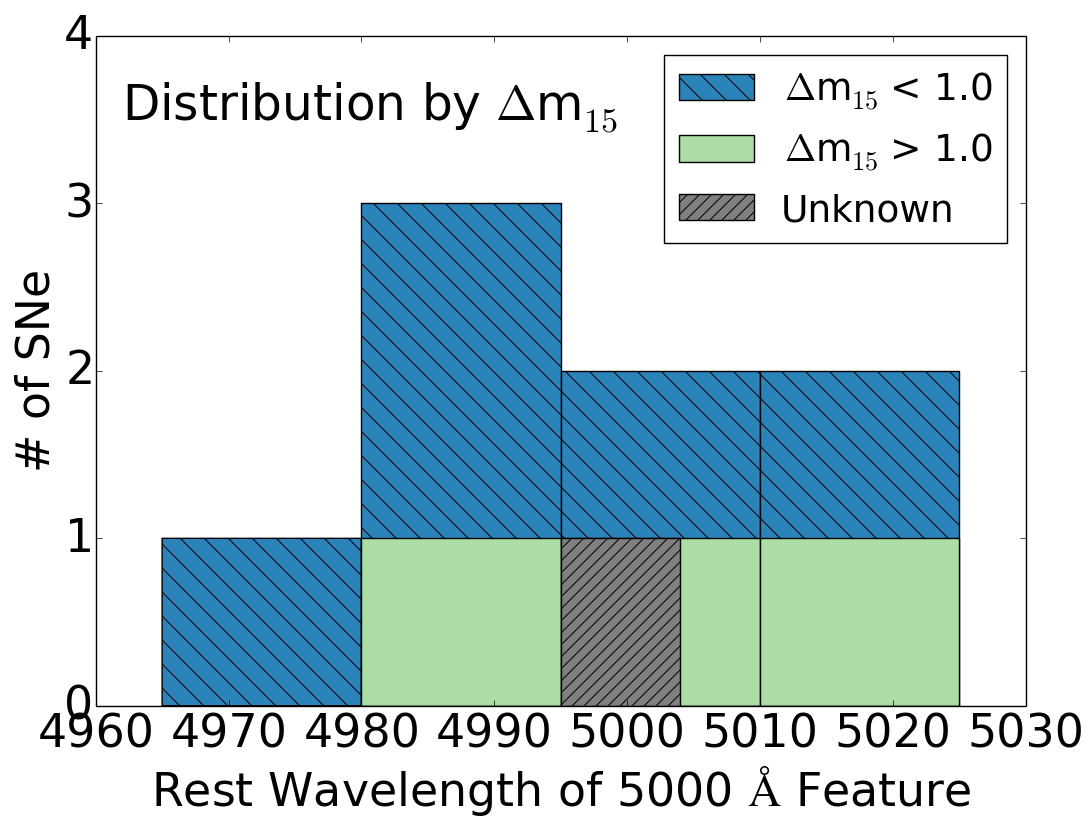
Figure 7 displays the distribution of SNe Ia based on the m15 above and below 1.0. It should be noted that all SNe Ia in our sample have m15 values 1.13. This suggests that these absorptions may be more common in slow declining SNe, but we caution that this may be the result of a selection effect due to their generally higher luminosities.
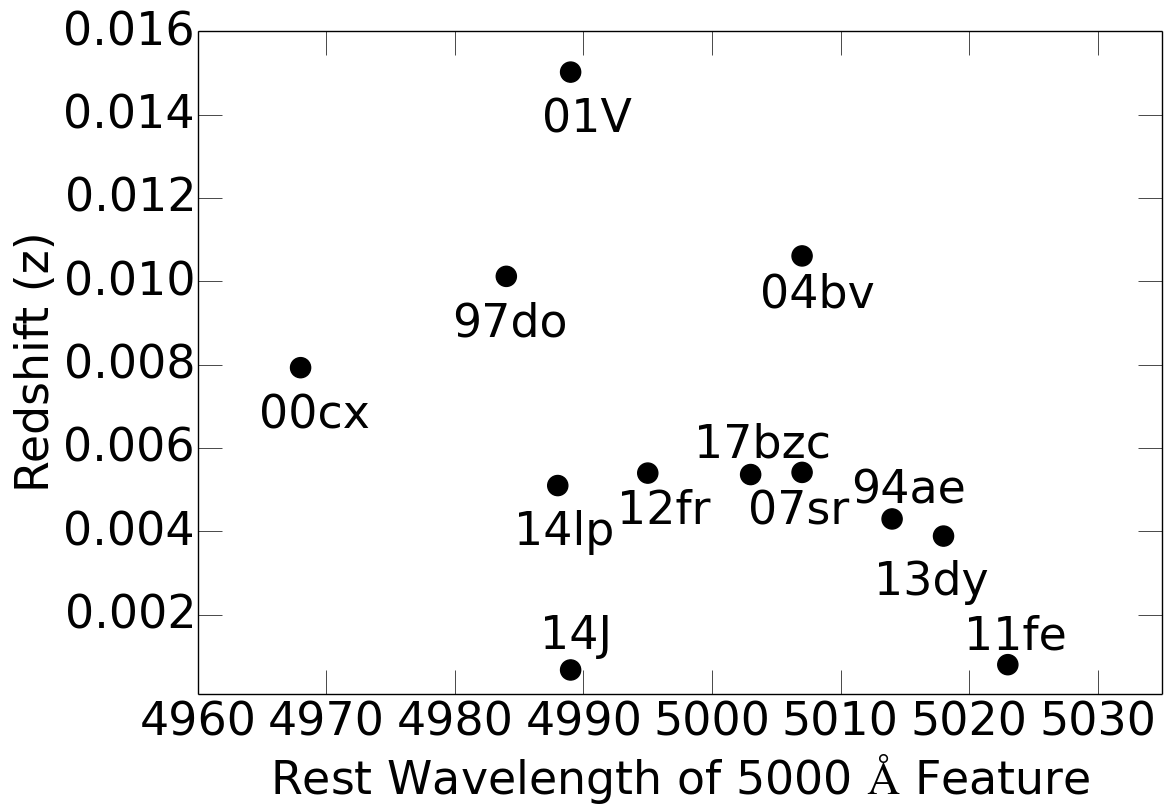
There does not appear to be a correlation between the wavelength of the 5000 Å absorption and the redshift of the SNe (see Figure 7). This suggests that the variations in wavelengths of the narrow features observed here is not caused by the inherent redshift of higher z events and is unique to each SN Ia.
3.5. Percentage of SNe Ia with Narrow Absorptions
A search of the SNe archives revealed about 100 SNe Ia that have spectra of sufficient S/N between +50 and +200 days to clearly show these narrow absorptions. In addition to our spectra of ASASSN-14lp and SN 2017bzc, we found nine out of the 100 SNe exhibit these features (10%), suggesting that the presence of narrow absorption in late-time SN Ia spectra is not particularly uncommon.
It is interesting to note that since 2010 there have been 12 SNe Ia that reached peak magnitudes of +12.5 or brighter and of these four (30%) exhibit these narrow, late-time absorptions (See Table 1). In addition, if the spectra of a prototypical SN Ia like SN 2011fe exhibit these transient absorptions at later times (day +150 or later), then this suggests that these features are not rare and may be more easily seen if high S/N spectra are obtained at late times.
4. Discussion
Late-time optical spectra of SNe Ia follow a well established pattern of declining flux dominated by numerous broad features, strongest in the blue. In Section 3, we presented late-time spectra of nearly a dozen SNe Ia that show surprisingly narrow features, appearing between 50 and 200 days post-max. These transient absorptions are found at 4840 and 5000 Å, as well as a notch-like feature on the red side of the 4700 Å feature at roughly 4760 Å.
Possible explanations concerning the origins of these absorptions must address the following observational properties: 1) The features appear simultaneously in late-time SN Ia spectra and show no change in wavelength, unlike the prominent blue spectral features which exhibit considerable and progressive red shifts, 2) They do not appear at precisely the same wavelengths from object to object, yet the relative spacing between the narrow features remains virtually constant at all epochs within measurement error, 3) These absorptions are transient, becoming visible around day 60 and persist for one to three months before disappearing, and 4) They are seen in both normal and 91T-like SNe Ia.
Below we discussed several possible causes.
4.1. Instrumentation, Telluric, and Data Reduction Effects
The weakness of these features plus the lack of other narrow absorptions in either the red or other blue parts of the spectrum raises the possibility that these features are instrumentation effects. This explanation can be ruled out since these features do not appear in the spectra of standard stars. Additionally, they would not appear only in spectra spanning a few months. A variety of instruments were used to observe the SNe in our sample and these same instruments have also been used to collect data of SNe Ia that do not show these minor features.
We can also rule out a telluric origin since the absorption features should always be present and found at the exact same wavelengths. Moreover, telluric absorptions are strongest in the red and NIR parts of the spectrum where we see no such features in our sample.
Because the 4840 and 5000 Å absorptions are at wavelengths close to H and [O III] 5007 Å, we also considered the possibility of over-subtraction of nearby H II region emission during data reduction. However, over-subtracted H or [O III] emission would create a feature that is shifted only a few angstroms from its rest wavelength and not found red-ward of the H and [O III] rest wavelengths.
4.2. Interstellar Absorption
These features could be due to interstellar medium (ISM) contamination in the spectra, which can be detected, for example, by narrow Na I absorption or diffuse interstellar bands (DIBs). Phillips et al. (2013) found ISM and DIB features present in 32 SNe Ia by way of narrow absorptions of Na I D 5890, 5896 Å, K I 7665, 7699 Å, and the DIB feature at 5780 Å. Interestingly, SN 2007sr is also included in their sample, but the narrow absorptions at 4770 and 5006 Å were not discussed. We noted that varying DIB absorptions have also been seen in the Type Ic SN 2012ap (Milisavljevic et al. 2014).
However, the wavelengths of the 4760, 4840, and 5000 Å features described above do not correspond to any strong, known DIB or ISM species. Additionally, the features we have reported are both variable in wavelength, with a range of wavelengths of up to 20 Å, and are too broad to be likely ISM features. For example, the 5000 Å absorption in ASASSN-14lp and SN 2017bzc have a FWHM of roughly 12 Å, which is much larger than the 1 Å usually seen in the ISM. Measured FWHM values of the 5000 Å absorptions for our sample are listed in Table 2.
4.3. Detached High-Velocity Ejecta Material
We also considered the possibility that these features are the result of large blueshifted absorptions from high-velocity SN ejecta. High-velocity material has been detected chiefly in Si II and Ca II absorptions near maximum, lying above the photosphere and ‘detached’ from the SN’s photospheric features. These detached absorption features have velocities of 20,000 to 30,000 km s-1and have been seen in a handful of SNe Ia, including SN 1999ee (Mazzali et al. 2005), SN 2000cx (Li et al. 2001; Thomas et al. 2004), SN 2001el (Wang et al. 2003), and SN 2006D (Thomas et al. 2007).
However, this high velocity material produces broad features observed at early epochs (Hatano et al. 1999; Mazzali et al. 2005). It is possible that the detached material could produce absorptions at late-times, but it is difficult to reconcile how this material would recreate the observed relatively narrow and transient features that can last for a few months.
4.4. Ejecta from Prior Novae Eruptions
Due to their variability and transient nature, these late-time absorption features could be the result of the SNe interacting with the surrounding material. Patat et al. (2007, 2011) suggested that SNe Ia may be interacting with dense shells of slow-moving ejecta from prior nova eruptions. In the single-degenerate SN Ia model, the white dwarf can experience multiple novae events prior to the final SN explosion (Hachisu & Kato 2001). When this happens, the white dwarf expels material from its surface as clumpy ejecta at velocities of a few thousand km s-1. Such recurrent novae events are thought to increase the white dwarf’s mass with each outburst, thus helping it reach MCH (Starrfield et al. 1985; Livio & Truran 1992; della Valle & Livio 1996).
Dilday et al. (2012) showed that PTF 11kx exhibited narrow Fe II 5018, 5169, 5316 Å and He I absorptions in its day 1 to +58 spectra. They propose that the material likely lies in a ring in the equatorial plane surrounding the SN, like that observed in the 2006 nova of RS Ophiuchi (Hachisu & Kato 2001; O’Brien et al. 2006; Bode et al. 2006, 2007). The observed delays in the features’ appearance could be due to the area surrounding the SN having been evacuated of material by prior novae (Wood-Vasey & Sokoloski 2006).
The transient nature of the narrow 4760, 4840, and 5000 Å absorption features we have found might be consistent with a ring of ejected material, where rings of varying thickness will determine the length of time the features are observable in the spectra. The disparity in epoch that these features are first observed could be the result of systems undergoing a larger number or stronger novae events than others, thus creating larger evacuated regions. The constant wavelengths of these absorptions could be attributed to the ejecta moving at a constant velocity.
However, there are some problems with this explanation. Dilday et al. (2012) suggests that there should also be a ring of CSM which should present as hydrogen emission in the spectra, but none of the SNe Ia in our sample show any evidence of hydrogen emission or absorption. Also, without knowing the velocity of this ring, determining which species are responsible for the absorptions will be challenging.
4.5. Pre-SN Mass Loss Material
Prior to the SN event in the single degenerate model, the environment surrounding the white dwarf should contain a considerable amount of hydrogen and helium lost from the companion star. The absorptions at 4840 and 5000 Å could be the result of H and He I 5016 Å absorption from hydrogen and helium envelopes traveling at 1300 km s-1and 900 km s-1respectively. The notch at 4760 Å would not be an absorption in this case, but rather the emergence of weak [Fe III] emissions around 4750 Å as we previously proposed (Black et al. 2016).
However, a problem in this explanation is the disparity in velocity between the hydrogen and helium shells. While it is reasonable to think that the hydrogen shell might be at a higher velocity, a difference of roughly 400 km s-1may be too large to reconcile. Moreover, the lack of absorption at H would be expected in addition to H, although, a weak red continuum might explain the apparent absence of H absorption.
4.6. Clumps of Fe-Rich Ejecta
Finally, we consider whether these narrow absorption features could be the result of Fe-rich ejecta clumps that become revealed at later times as the photosphere recedes. Evidence of clumpy Fe-rich ejecta in SNe Ia can be seen in X-ray images of the SN Ia remnant Tycho (SN 1572) which has spherically distributed but relatively clumpy Si-rich ejecta (Seward et al. 1983; Vancura et al. 1995; Hwang et al. 2002). A knot on the SE border of the remnant has been found to contain mostly Fe-rich material that is chemically distinct from the surrounding ejecta (Yamaguchi et al. 2017). Tsebrenko & Soker (2015) suggest that Fe clumps may also be responsible for the protrusions or ‘ears’ seen in Kepler’s SNR and SNR G1.9+0.3.
Additional evidence of Fe-rich ejecta clumping comes from the young SN Ia remnant S Andromeda (SN 1885). HST images and spectra of this SN remnant indicate Fe-rich ejecta concentrated in four plumes, extending from the remnant center out to 10,000 km s-1 (Fesen et al. 2015, 2017).
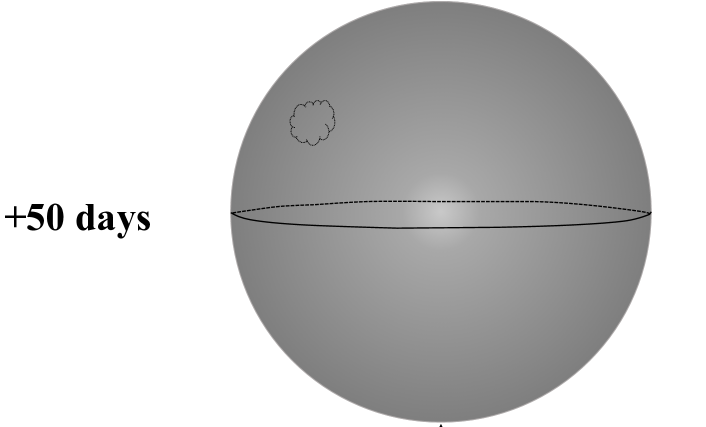
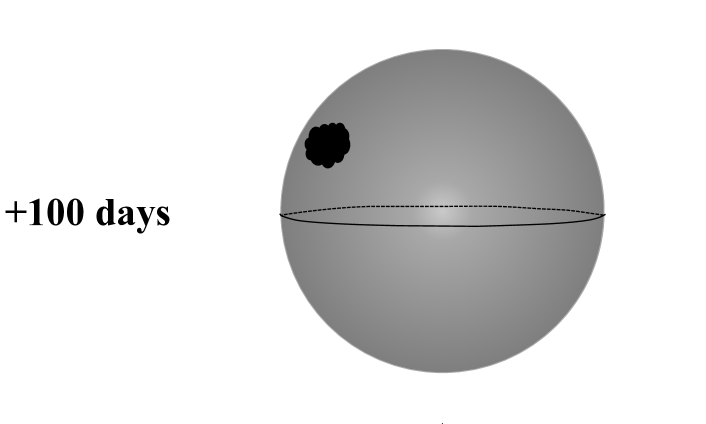
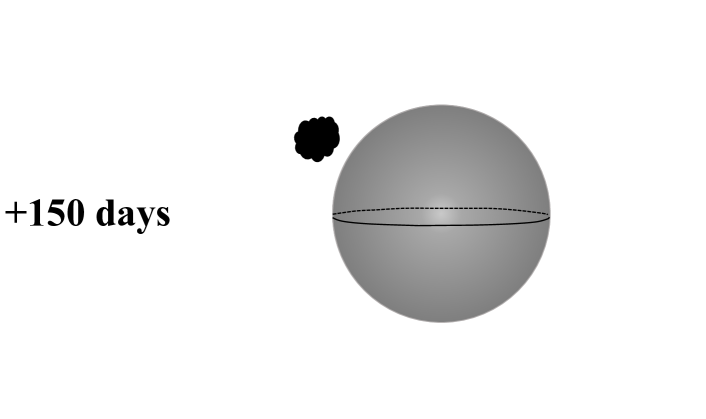
Such Fe-rich clumps in these young SNRs suggest that Ia explosions can create a few distinct Fe clumps. These might be observable in SNe spectra at late epochs. Figure 8 is a cartoon of how an Fe clump with velocities of 8,000 12,000 km s-1 underneath a debris field that creates a pseudo-photosphere of scattered radiation would become increasingly exposed. An initial large optical depth can explain the delay in the appearance of these features as well as their evolution. As the pseudo-photosphere becomes increasingly optically thin, the Fe clump emerges and consequently the absorptions strengthen. Eventually, the effective radius of the photosphere decreases such that the Fe clump no longer absorbs the photospheric flux.
For Fe II 4924, 5018, and 5169 Å
| SN | 4760 Å | 4840 Å | 5000 Å | FWHM (Å) of |
|---|---|---|---|---|
| ID | km s-1 | km s-1 | km s-1 | 5000 Å Feature |
| 1994ae | 9,000 | 18 | ||
| 1997do | 11,200 | 10,700 | 25 | |
| 2000cx | 11,500 | 11,700 | 11,500 | 12 |
| 2001V | 10,200 | 10,400 | 21 | |
| 2004bv | 9,200 | 8,900 | ||
| 2007sr | 9,400 | 9,300 | 23 | |
| 2011fe | 8000 | 8200 | 8400 | |
| 2012fr | 9,400 | 9,000 | 35 | |
| 2013dy | 8,300 | 8,600 | 12 | |
| 20014J | 10,300 | 10,400 | ||
| ASASSN-14lp | 10,500 | 10,500 | 10,300 | 13 |
| 2017bzc | 9,600 | 9,700 | 9,600 | 12 |
It is possible that the transient features discussed here are the result of absorption from permitted Fe II 4924, 5018, 5169 Å, which make up multiplet 42 of Fe II. If true, then the blueshifted absorption velocities range from roughly 8,000 km s-1to 11,500 km s-1across the SNe Ia in our sample. In our sample SN 2000cx has the largest velocity of 11,500 km s-1 and SN 2011fe has the lowest at 8,400 km s-1. These velocities are consistent with those reported for the Fe plumes of SN 1885, which are observed to extend out to 10,000 km s-1(Fesen et al. 2015). Table 2 lists the estimated velocities of each feature for the SNe in our sample as well as the measured FWHM of the 5000 Å feature.
In this Fe clump model, observed FWHMs provide lower limits on the velocity range of the clumps due to the small relative absorptions in the 4700 - 5000 Å range. Using ASASSN-14lp at day +114 as an example, we fit the absorptions with a Gaussian assuming a continuum level roughly equal to the peak of the 4700 Å feature. This yields FWHM values of 35, 55, and 45 Å for the 4760, 4840, and 5000 Å absorptions, respectively, which translates to an effective clump velocity range of 2000 2500 km s-1.
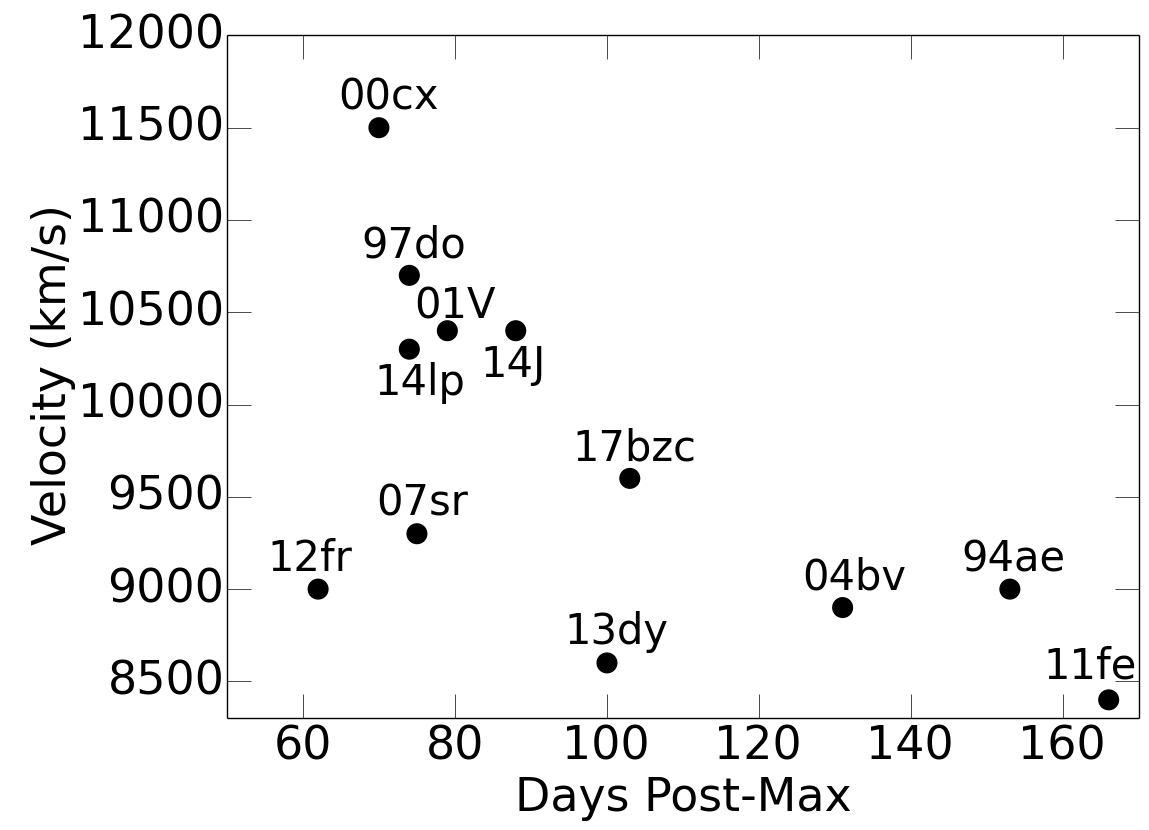
The observed blueshifted velocities of the 5000 Å absorptions are compared to the approximate epoch that the features first appear in Figure 9. We find a possible trend of higher velocity absorptions found at earlier epochs, supporting the Fe clump model as clumps that are revealed at earlier times should be moving at higher velocities than those that do not appear until later times. However, we caution that this apparent correlation may simply be due to the lack of high cadence, multi-epoch spectra of SNe Ia after +100 days.
The range of Fe II clump velocities observed in our sample could be the result of the projected radial velocity of the clump’s expansion velocity with respect to our viewing angle. Assuming that these Fe clumps are moving with a maximum velocity of 10,000 12,000 km s-1, the observed velocities can be recreated with clumps moving at angles of 10-45 degrees.
In addition, the varying FWHM values of these narrow features seen between objects could be due to a differing clump covering fractions of the SN photosphere 2-5 months post-max. For example, a larger covering fraction might explain how some supernova, like SN 2012fr, show significantly stronger features while a smaller fraction would generate weaker absorptions like that seen in SN 2000cx.
Of the possible explanations offered to describe the origins of these transient absorption features, we favor the Fe clump model. Clumps of Fe explain how the absorption features appear simultaneously in the spectra where variations of the projected clump radial velocities result in features with a range in wavelengths across SNe Ia, while still maintaining the relative spacing between the absorptions.
The transient nature of the absorption features is consistent with a receding photosphere increasingly revealing a discrete clump and the length of time they can be seen is dependent of the clump covering fraction. Support for this model comes from the observed rise and decline of late-time gamma rays from 56Co decay around day +60 to +100 in SN 2014J (Diehl et al. 2015), which occurs in nearly the same timeframe and durations as when the narrow 4760, 4840, and 5000 Å features appear in its optical spectra (see Fig. 3). This variability of SN 2014J’s gamma rays at late-times has been interpreted as possibly due to the exposure of clumps of 56Co along less occulted line-of-sight as the supernova’s cloud of debris expands and evolves (Diehl et al. 2015). This is consistent with an Fe clump model (see Fig. 8) and could apply to any SN Ia subtype, thus explaining narrow transient features present in both normal and 91T-like SNe Ia.
If such Fe-clumps exists, their presence and origin could have important implications regarding SNe Ia explosion dynamics. Large Fe-rich clumps possibly associated with Rayleigh-Taylor plumes, like those seen in the remnant of SN 1885 (Fesen et al. 2015), might inform us regarding the chemical and dynamical properties near the explosion center. However, X-ray observations of the Fe knot in the Tycho SNR indicate that the knot did not originate from deep within the white dwarf progenitor (Yamaguchi et al. 2017) and that the Fe is likely a nonradioactive form, like 54Fe (Wang & Chevalier 2001).
5. Conclusions
A sample of 12 SNe Ia with a total of 58 optical late-time spectra, including the observations of ASASSN-14lp and SN 2017bzc, are found to exhibit transient, narrow absorptions features between 4700-5000 Å. The presence of such absorptions is unexpected in SN Ia spectra where only broad, blended features are seen even at late times, well into the nebular phase. The fact that these absorption features are observed in four of twelve bright recent SNe suggests that such absorption features are not an especially uncommon phenomenon.
The specific findings of our study include:
1) Three narrow features can be seen in the spectra of nearly a dozen SNe Ia between +60 and +200 days. Two absorption features are found at 4840 and 5000 Å, as well as a distinct notch at 4760 Å. They appear in moderate to high S/N spectra of both normal and 91T-like SNe Ia, including SN 2011fe. These are a relatively common phenomenon in SNe Ia as we estimate that roughly 10% or more of SNe Ia exhibit these narrow absorptions.
2) These absorptions appear in the spectra almost simultaneously after day +60 and disappear some one to three months later. Such transient nature of late-time features has not been observed before and is unexpected in SN Ia spectra. Additionally, the features do not exhibit a shift in wavelength, unlike the adjacent blue spectral features, and they maintain roughly similar wavelengths, ranging up to 20 Å, across the sample of SNe Ia. The relative spacing between these absorptions is the same across the SNe in our sample to within measurement error.
3) Because these three absorptions evolve together as the features strengthen and then eventually disappear from late-time SNe Ia spectra, they likely have a common source. While they may not all be from the same element, they likely originate from the same environment.
4) These features could be absorptions due to previous mass loss events or shells of ejecta from repeated novae events prior to the SN explosion. However, we favor an alternative possibility where these features are the result of Fe clumps revealed by a receding photosphere, where the observed absorptions seem to match with the Fe II 4924, 5018, 5169 Å features.
The puzzling appearance and disappearance of narrow absorptions several months after maximum light, affecting even the profile of the prominent, late-time 4700 Å feature, may have important implications on our understanding of the environment surrounding a SN Ia, or indicate the late-time emergence of discrete clumps of Fe-rich ejecta. In either case, the presence of these unexpected features in a variety of SNe Ia subtypes, including the prototypical SN 2011fe, deserve to be understood.
References
- Arnett et al. (1971) Arnett, W. D., Truran, J. W., & Woosley, S. E. 1971, ApJ, 165, 87
- Axelrod (1980) Axelrod, T. S. 1980, Ph.D. Thesis California Univ.
- Bertola (1962) Bertola, F. 1962, Mem. Soc. Astron. Italiana, 33, 77
- Bertola (1965) —. 1965, Mem. Soc. Astron. Italiana, 36, 299
- Black et al. (2016) Black, C. S., Fesen, R. A., & Parrent, J. T. 2016, MNRAS, 462, 649
- Blondin et al. (2015) Blondin, S., Dessart, L., & Hillier, D. J. 2015, MNRAS, 448, 2766
- Blondin et al. (2012) Blondin, S., Matheson, T., Kirshner, R. P., et al. 2012, AJ, 143, 126
- Bode et al. (2007) Bode, M. F., Harman, D. J., O’Brien, T. J., et al. 2007, ApJ, 665, L63
- Bode et al. (2006) Bode, M. F., O’Brien, T. J., Osborne, J. P., et al. 2006, ApJ, 652, 629
- Botyánszki & Kasen (2017) Botyánszki, J., & Kasen, D. 2017, ApJ, 845, 176
- Bowers et al. (1997) Bowers, E. J. C., Meikle, W. P. S., Geballe, T. R., et al. 1997, MNRAS, 290, 663
- Branch et al. (2009) Branch, D., Dang, L. C., & Baron, E. 2009, PASP, 121, 238
- Branch et al. (2008) Branch, D., Jeffery, D. J., Parrent, J., et al. 2008, PASP, 120, 135
- Childress et al. (2013) Childress, M. J., Scalzo, R. A., Sim, S. A., et al. 2013, ApJ, 770, 29
- Childress et al. (2015) Childress, M. J., Hillier, D. J., Seitenzahl, I., et al. 2015, MNRAS, 454, 3816
- della Valle & Livio (1996) della Valle, M., & Livio, M. 1996, ApJ, 473, 240
- Diehl et al. (2015) Diehl, R., Siegert, T., Hillebrandt, W., et al. 2015, A&A, 574, A72
- Dilday et al. (2012) Dilday, B., Howell, D. A., Cenko, S. B., et al. 2012, Science, 337, 942
- Fesen et al. (2015) Fesen, R. A., Höflich, P. A., & Hamilton, A. J. S. 2015, ApJ, 804, 140
- Fesen et al. (2017) Fesen, R. A., Weil, K. E., Hamilton, A. J. S., & Höflich, P. A. 2017, ApJ, 848, 130
- Foley et al. (2014) Foley, R. J., Fox, O. D., McCully, C., et al. 2014, MNRAS, 443, 2887
- Fransson & Jerkstrand (2015) Fransson, C., & Jerkstrand, A. 2015, ApJ, 814, L2
- Friesen et al. (2014) Friesen, B., Baron, E., Wisniewski, J. P., et al. 2014, ApJ, 792, 120
- Galbany et al. (2016) Galbany, L., Moreno-Raya, M. E., Ruiz-Lapuente, P., et al. 2016, MNRAS, 457, 525
- Gamezo et al. (2005) Gamezo, V. N., Khokhlov, A. M., & Oran, E. S. 2005, ApJ, 623, 337
- Ganeshalingam et al. (2010) Ganeshalingam, M., Li, W., Filippenko, A. V., et al. 2010, ApJS, 190, 418
- Graham et al. (2015) Graham, M. L., Nugent, P. E., Sullivan, M., et al. 2015, MNRAS, 454, 1948
- Graham et al. (2017) Graham, M. L., Kumar, S., Hosseinzadeh, G., et al. 2017, MNRAS, 472, 3437
- Guillochon et al. (2017) Guillochon, J., Parrent, J., Kelley, L. Z., & Margutti, R. 2017, ApJ, 835, 64
- Hachisu & Kato (2001) Hachisu, I., & Kato, M. 2001, ApJ, 558, 323
- Hatano et al. (1999) Hatano, K., Branch, D., Fisher, A., Baron, E., & Filippenko, A. V. 1999, ApJ, 525, 881
- Hillebrandt & Niemeyer (2000) Hillebrandt, W., & Niemeyer, J. C. 2000, Annual Review of A&A, 38, 191
- Hoeflich & Khokhlov (1996) Hoeflich, P., & Khokhlov, A. 1996, ApJ, 457, 500
- Howell (2011) Howell, D. A. 2011, Nature Communications, 2, 350
- Hoyle & Fowler (1960) Hoyle, F., & Fowler, W. A. 1960, ApJ, 132, 565
- Hwang et al. (2002) Hwang, U., Decourchelle, A., Holt, S. S., & Petre, R. 2002, ApJ, 581, 1101
- Jha et al. (2006) Jha, S., Kirshner, R. P., Challis, P., et al. 2006, AJ, 131, 527
- Kashyap et al. (2015) Kashyap, R., Fisher, R., García-Berro, E., et al. 2015, ApJ, 800, L7
- Khokhlov (1991) Khokhlov, A. M. 1991, A&A, 245, 114
- Kushnir et al. (2013) Kushnir, D., Katz, B., Dong, S., Livne, E., & Fernández, R. 2013, ApJ, 778, L37
- Li et al. (2001) Li, W., Filippenko, A. V., Gates, E., et al. 2001, PASP, 113, 1178
- Livio & Truran (1992) Livio, M., & Truran, J. W. 1992, ApJ, 389, 695
- Maeda et al. (2011) Maeda, K., Leloudas, G., Taubenberger, S., et al. 2011, MNRAS, 413, 3075
- Maoz & Mannucci (2012) Maoz, D., & Mannucci, F. 2012, Publications of the Astronomical Society of Australia, 29, 447
- Mazzali et al. (2005) Mazzali, P. A., Benetti, S., Stehle, M., et al. 2005, MNRAS, 357, 200
- Mazzali et al. (2005) Mazzali, P. A., Kawabata, K. S., Maeda, K., et al. 2005, Science, 308, 1284
- Mazzali et al. (2014) Mazzali, P. A., Sullivan, M., Hachinger, S., et al. 2014, MNRAS, 439, 1959
- Mazzali et al. (2015) Mazzali, P. A., Sullivan, M., Filippenko, A. V., et al. 2015, MNRAS, 450, 2631
- McLaughlin (1963) McLaughlin, D. B. 1963, PASP, 75, 133
- Milisavljevic et al. (2014) Milisavljevic, D., Margutti, R., Crabtree, K. N., et al. 2014, ApJ, 782, L5
- Minkowski (1939) Minkowski, R. 1939, ApJ, 89, 156
- Morrell et al. (2017) Morrell, N., Shappee, B., Drout, M., & Dong, S. 2017, ATel, 10240
- Munari et al. (2013) Munari, U., Henden, A., Belligoli, R., et al. 2013, New Astron., 20, 30
- Nomoto (1982) Nomoto, K. 1982, ApJ, 253, 798
- Nomoto et al. (1984) Nomoto, K., Thielemann, F. K., & Yokoi, K. 1984, ApJ, 286, 644
- O’Brien et al. (2006) O’Brien, T. J., Bode, M. F., Porcas, R. W., et al. 2006, Nature, 442, 279
- Pan et al. (2015) Pan, Y. C., Foley, R. J., Kromer, M., et al. 2015, MNRAS, 452, 4307
- Parker et al. (2017) Parker, S., Marples, P., Bock, G., Drecher, C., & Search, P. P. B. O. S. 2017, The Astronomer’s Telegram, 10165
- Patat et al. (2011) Patat, F., Chugai, N. N., Podsiadlowski, P., et al. 2011, A&A, 530, A63
- Patat et al. (2007) Patat, F., Chandra, P., Chevalier, R., et al. 2007, Science, 317, 924
- Patat et al. (2013) Patat, F., Cordiner, M. A., Cox, N. L. J., et al. 2013, A&A, 549, A62
- Phillips et al. (2013) Phillips, M. M., Simon, J. D., Morrell, N., et al. 2013, ApJ, 779, 38
- Raskin et al. (2014) Raskin, C., Kasen, D., Moll, R., Schwab, J., & Woosley, S. 2014, ApJ, 788, 75
- Riess et al. (1999) Riess, A. G., Kirshner, R. P., Schmidt, B. P., et al. 1999, AJ, 117, 707
- Seward et al. (1983) Seward, F., Gorenstein, P., & Tucker, W. 1983, ApJ, 266, 287
- Shappee et al. (2015) Shappee, B. J., Piro, A. L., Holoien, T. W. S., et al. 2015, arXiv:1507.04257
- Silverman et al. (2013) Silverman, J. M., Ganeshalingam, M., & Filippenko, A. V. 2013, MNRAS, 430, 1030
- Silverman et al. (2015) Silverman, J. M., Vinko, J., Marion, G. H., et al. 2015, MNRAS, 451, 1973
- Silverman et al. (2012) Silverman, J. M., Foley, R. J., Filippenko, A. V., et al. 2012, MNRAS, 425, 1789
- Starrfield et al. (1985) Starrfield, S., Sparks, W. M., & Truran, J. W. 1985, ApJ, 291, 136
- Stritzinger et al. (2006) Stritzinger, M., Mazzali, P. A., Sollerman, J., & Benetti, S. 2006, A&A, 460, 793
- Thomas et al. (2004) Thomas, R. C., Branch, D., Baron, E., et al. 2004, ApJ, 601, 1019
- Thomas et al. (2007) Thomas, R. C., Aldering, G., Antilogus, P., et al. 2007, ApJ, 654, L53
- Tsebrenko & Soker (2015) Tsebrenko, D., & Soker, N. 2015, MNRAS, 453, 166
- Vancura et al. (1995) Vancura, O., Gorenstein, P., & Hughes, J. P. 1995, ApJ, 441, 680
- Vinkó et al. (2003) Vinkó, J., Bíró, I. B., Csák, B., et al. 2003, A&A, 397, 115
- Wang & Chevalier (2001) Wang, C.-Y., & Chevalier, R. A. 2001, ApJ, 549, 1119
- Wang et al. (2003) Wang, L., Baade, D., Höflich, P., et al. 2003, ApJ, 591, 1110
- Wang et al. (2013) Wang, X., Wang, L., Filippenko, A. V., Zhang, T., & Zhao, X. 2013, Science, 340, 170
- Wood-Vasey & Sokoloski (2006) Wood-Vasey, W. M., & Sokoloski, J. L. 2006, ApJ, 645, L53
- Yamaguchi et al. (2017) Yamaguchi, H., Hughes, J. P., Badenes, C., et al. 2017, ApJ, 834, 124
- Yaron & Gal-Yam (2012) Yaron, O., & Gal-Yam, A. 2012, PASP, 124, 668
- Zhang et al. (2014) Zhang, J.-J., Wang, X.-F., Bai, J.-M., et al. 2014, AJ, 148, 1
- Zhang et al. (2018) Zhang, K., Wang, X., Zhang, J., et al. 2018, MNRAS, arXiv:1808.06311
- Zheng et al. (2013) Zheng, W., Silverman, J. M., Filippenko, A. V., et al. 2013, ApJ, 778, L15