Radio Recombination Lines from H ii Regions
Abstract
The ngVLA will create a Galaxy-wide, volume-limited sample of H ii regions; solve some long standing problems in the physics of H ii regions; and provide an extinction-free star formation tracer in nearby galaxies.
1 Introduction
Here we discuss three scientific areas that could be revolutionized by ngVLA observations of radio recombination line (RRL) and continuum emission from H ii regions: Galactic structure, H ii region physics, and star formation in nearby galaxies.
H ii regions are zones of ionized gas surrounding recently-formed high-mass OB-type stars. They are the archtypical tracer of spiral structure. Since they are young ( Myr), their chemical abundances represent Galactic abundances today, and reveal the effects of billions of years of Galactic chemical evolution. H ii regions are often part of a high-mass star formation complex that consists of a thin neutral photodissociation region (PDR) between a hot ( K) H ii region and dense, cool ( K) molecular material from which the stars were formed.
H ii regions are the brightest objects in the Milky Way at infrared and mm wavelengths and can be detected across the Galaxy. They are characterized in the infrared by m emission from stochastically heated small dust grains mixed with the ionized gas surrounded by m emission from polycyclic aromatic hydrocarbon (PAH) molecules located in the PDR (Anderson et al. 2014). The ionized gas produces bright, free-free (thermal) radio continuum emission that is coincident with the m infrared emission. When free electrons recombine and cascade to the ground state they produce recombination line emission which is found at radio wavelengths for the higher principal quantum number levels (). Currently, only emission from hydrogen and helium is detected in H ii regions at radio wavelengths, but heavier elements (e.g., carbon) are detected in the denser, cooler PDRs (Wenger et al. 2013).
RRLs are an excellent, extinction-free diagnostic of H ii regions. Unlike radio continuum emission, they uniquely probe the thermal emission and therefore unambiguously identify an H ii region. The RRL parameters alone provide information about H ii region kinematics (Anderson et al. 2012), turbulent motions (Roshi 2007), and He/H abundance ratios (Balser 2006). Measuring the RRL and continuum emission together allows the calculation of many physical H ii region properties: electron (thermal) temperature, rms electron density, the H-ionizing stellar luminosity (number of OB-type stars), etc. (Gordon & Sorochenko 2009).
The main limitation of using RRLs to probe Galactic structure and star formation compared to similar tracers at optical or infrared wavelengths is that they have much lower intensities. This is particularly an issue in external galaxies. For example, RRL emission has been primarily detected from nearby starburst galaxies powered by massive young star clusters. Recently, however, RRL emission was detected in the normal galaxies M51 and NGC 628 at centimeter wavelengths (Luisi et al. 2018). Moreover, for some radio facilities the spatial resolution is not sufficient to resolve individual H ii regions, which limits the analysis. The ngVLA will provide both the sensitivity and spatial resolution to remedy these problems and place RRLs as an H ii region diagnostic on par with, for example, H.
2 Galactic Structure
The ngVLA is necessary to create a Galaxy-wide, volume-limited sample of H ii regions. Since radio waves penetrate the dust located within the Galactic disk, an H ii region map of the entire Milky Way is possible at these wavelengths. This is needed to understand the global properties of the Milky Way, and to compare its star formation to that of external galaxies. There is strong evidence that we have only discovered about 25% of the H ii regions in the Milky Way, which impedes our understanding of Galactic structure and Galactic chemical evolution (Anderson et al. 2014).
The implications for Galactic structure studies using RRLs were recognized shortly after their discovery in 1965 and prompted large-scale H ii region surveys (Wilson et al. 1970; Reifenstein et al. 1970). RRLs measure the systemic velocity of an H ii region and therefore their motion around the center of the Galaxy. Using a rotation curve model together with the velocity yields the Heliocentric distance of the H ii region. Distances computed in this way are known as “kinematic distances.” Improvements in receiver performance resulted in follow-up surveys in the 1980s that increased the number of sources (Wink et al. 1983; Caswell & Haynes 1987; Lockman 1989). These RRL surveys, however, were limited in sensitivity and had inaccurate distance determinations. A third generation of Galactic H ii region discovery surveys (HRDS) is almost complete using primarily the Green Bank Telescope (GBT) in the Northern sky (Bania et al. 2010) and the Australia Telescope Compact Array (ATCA) in the Southern sky (Brown et al. 2017). The HRDS has doubled the number of known H ii regions. It has the sensitivity to detect all nebulae ionized by an O-type star out to a distance of 20 kpc from the Sun. This has primarily been achieved by the flexibility of spectrometers that can simultaneously observe multiple RRLs which can be averaged together to increase the signal-to-noise ratio (SNR). Maser parallax distances together with better models of Galactic rotation have improved our understanding of kinematic distance determinations (Reid et al. 2014; Wenger et al. 2018).
These new surveys have made several discoveries about the morphological and chemical structure of the Milky Way. Cold H I gas and molecular clouds are often used to define spiral structure but such tracers are not always associated with high-mass star formation (Anderson et al. 2009). Therefore, Koo et al. (2017) used H i surveys together with the HRDS to characterize the spiral structure in the outer Galaxy and found that a four-arm spiral model with pitch angle of was a good fit to the data. Yet the number of H ii regions sampling the outer-most spiral arms is limited. For example, deep RRL observations with the GBT were only able to detect a handful of H ii regions in the outer Scutum-Centaurus arm (Armentrout et al. 2017). (N.B., the RRL spectral sensitivity of the Jansky Very Large Array (JVLA) is comparable to the GBT.)
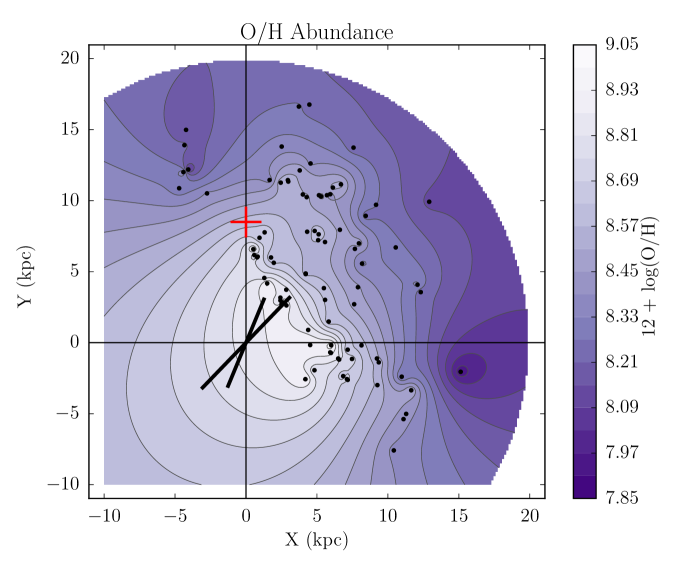
For H ii regions in thermal equilibrium the nebular electron temperature is determined by the abundance of the coolants (O, N, and other heavy elements). Balser et al. (2015) used this to derive electron temperatures for a sub-set of the HRDS H ii regions and used them to derive the nebular [O/H] abundances. Figure 1 shows the resulting metallicity map and reveals the chemical structure of the Milky Way disk. The radial metallicity gradient is obvious from this map and has been detected before, but there is also azimuthal structure that was revealed for the first time. This may be due to radial mixing from the Galactic Bar whose major axis is aligned toward an azimuth of about . The sample is limited, however, since only the most accurate RRL and continuum data is selected. More sources are required to better characterize this chemical structure and therefore constrain the physical mechanisms that might be in play. The ngVLA will add thousands of sources to Figure 1 (see below) and reveal any detailed metallicity structure across the Galactic disk.
The WISE catalog of Galactic H ii regions contains about 8000 objects identified by their mid-infrared and radio properties as H ii region (Anderson et al. 2014). Currently only sources in this catalog are known H ii regions with RRL or H emission. Of the remaining sources have spatially coincident radio continuum emission and are very likely H ii regions, and are radio quiet at the sensitivity limits of existing radio continuum surveys. There is some evidence that the radio quiet sources in the WISE H ii region catalog are bona fide H ii regions (Armentrout et al. 2018, in prep.). Because of their extreme luminosities, H ii regions are essential for computing extragalactic star formation rates in combination with infrared and other radio data. The HRDS, when complete, will be the first survey to detect all H ii regions created by at least one O-type star, but there will remain thousands of likely H ii regions whose RRL emission cannot be detected with extant facilities.
The ngVLA will have the sensitivity to create a Galaxy-wide, volume-limited sample of H ii regions. The optimal frequency range is 4-12 GHz (ngVLA band 2), where classical H ii regions are optically thin, in LTE, and many adjacent transitions can be averaged to increase the SNR. The HRDS spectral sensitivity at these frequencies is mJy. To detect all sources in the WISE Galactic H ii region catalog requires a spectral sensitivity of Jy (Anderson et al. 2014). This assumes a radio continuum flux density of 0.2 mJy at 21 cm, a SNR of 5, an optically thin nebula, and a line-to-continuum ratio of 0.1 at 8 GHz (e.g., Brown et al. 2017). Using the ngVLA spectral sensitivity from Selina & Murphy (2017) for a 50 mas beam111The ngVLA spectral rms is Jy beam-1 for a beam size of 50 mas at 8 GHz with an integration time of 1 hr and a FHWM line width of 10 km s-1., the weakest sources in the WISE catalog would require 15 hr of integration time. The ngVLA sensitivity will be less for sources that are resolved by the longest baselines. At a distance of 20 kpc an H ii region with a physical size of 1 pc has an angular size of 10′′. Since the ngVLA core of antennas will contain a large fraction of the collecting area the sensitivity should not be significantly reduced. In principle, the GBT could fill in the missing flux density. Phased array feeds in the central ngVLA core would increase the efficiency. Such a survey would complement MeerGAL, a high frequency (GHz) survey of the Galactic plane with MeerKat in the Southern sky.
A Galactic H ii region pointed survey toward WISE H ii region candidates may be possible with the James Webb Space Telescope (JWST), which will be sensitive to wavelengths from , using collisonally excited lines (CELs) in the mid-infrared. RRLs provide a more direct measure of the ionizing flux, but CELs probe the hardness of the radiation field. Most optical and near-infrared studies, however, trace the kinematic and chemical structure of stars. Recent surveys such as APOGEE, GAIA-ESO, LAMOS, and RAVE are sampling hundreds of thousands of stars and will soon have accurate distances from GAIA. But these surveys do not probe the gas component of the Milky Way or very far into the disk due to extinction by dust. Understanding the morphological and chemical structure of both the stars and the gas is critical to constrain Galactic formation and evolution models (e.g., Kubryk et al. 2013).
3 H ii Region Physics
The ngVLA could solve some long standing problems in the physics of H ii regions including, for example, constraining the collision rates from free electrons, characterizing temperature fluctuations, and understanding the role of magnetic fields within H ii regions.
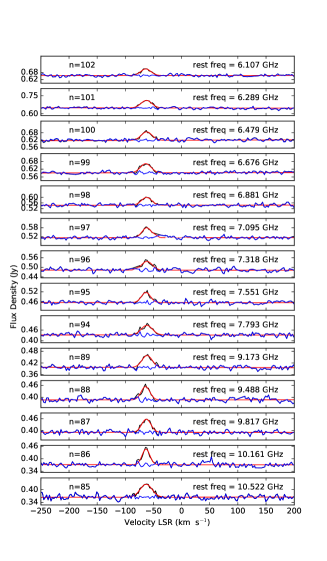
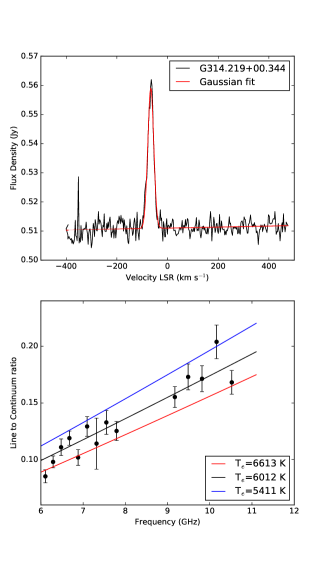
Recombination lines from hydrogen and helium at radio wavelengths are strongly affected by collisions from free electrons and therefore accurate collision rates are important for predicting the line opacity. Under some physical conditions the opacities can vary by as much as a factor of five depending on the rates used (F. Guzmán, private comm.; also see Guzmán et al. 2016). Accurate measurements of the RRL intensity ratio over a frequency range wide enough for the opacity to vary significantly would provide vital observational constraints for the collision rates. For example, the flexible spectrometer on the ATCA allows RRLs to be observed simultaneously from 6-12 GHz so that we can begin to constrain the atomic physics (see Figure 2). We are working on a detailed strategy to detect each RRL transition with a high SNR over a variety of physical conditions. This will require the sensitivity of the ngVLA.
One of the key problems in the physics of ionized nebulae is that abundances derived from recombination lines (RLs) are significantly larger, by as much as a factor of two, than those derived from CELs (Garcá-Rojas & Esteban 2007). These differences can be explained by temperature fluctuations in the ionized gas. The concept of temperature fluctuations was developed by Peimbert (1967) to explain how electron temperatures derived from RLs were different than those derived from CELs. Temperatures are also expected to increase at the H ii region boundary because of photon hardening. That is, photons with energies of 20 eV have a smaller absorption cross section so they can reach the nebular boundary where they are absorbed and thus raise the electron temperature. Wilson et al. (2015) suggested that optical observations produced different electron temperature profiles in the Orion nebula compared with RRLs due to the effects of dust. The radio observations were performed with the GBT instead of the JVLA because Orion is extended, but to probe small-scale structure requires better spatial resolution. The smallest scales over which the temperatures vary is not known. Therefore to measure both the small and large-scale temperature variations in H ii regions requires calculating the radio line-to-continuum ratio over a wide range of spatial scales with high sensitivity. This may be possible by combing data from the JVLA and GBT, but the systematic errors using this method may be too large. The internal calibration with the ngVLA would provide a more accurate measure of the electron temperature over a wider range of spatial scales with significantly better sensitivity.
Magnetic fields may play an important role in the formation of stars and the Zeeman effect is the only method that directly measures the in-situ magnetic field strength, but it is a challenging experiment. Most of the work thus far has probed molecular (e.g., CN) or neutral (e.g, H i) components of high-mass star formation regions (Crutcher et al. 2010). To our knowledge there has never been a Zeeman detection from RRLs (e.g., Troland & Heiles 1977), so an ngVLA detection would be the first. Such a measurement is difficult since the hydrogen RRL width (km s-1) is broader than the Zeeman splitting and therefore a very high SNR is required. High spatial resolution is necessary since magnetic field variations have been detected and will be averaged over a large beam. Since many bright H ii regions are extended, however, the larger spatial scales, or shorter baselines for an interferometer, must be sampled.
We estimate the sensitivity of the ngVLA for Zeeman measurements in H ii regions by assuming a hydrogen RRL intensity of 50 mJy beam-1 and a line width of 30 km s-1 observed with a resolution of 1 arcsec at 8 GHz. Using the ngVLA spectral sensitivity from Selina & Murphy (2017) for a 1 arcsec beam and Equation 2 from Troland & Heiles (1982), we estimate a 3 limiting line-of-sight magnetic field strength of 295 G in 1 hr of integration time. This assumes we are able to average 20 RRLs with six spectral channels across the FWHM line width.
4 Star Formation in Nearby Galaxies
Using RRLs the ngVLA will provide an extinction-free star formation tracer in nearby galaxies that is comparable to H for the sensitivity and spatial resolution afforded by existing optical instruments. That is particularly important in extreme environments with clusters of massive stars since star formation may proceed differently in these objects. These environments are, moreover, often opaque at ultraviolet, optical, or near infrared wavelengths due to dust.
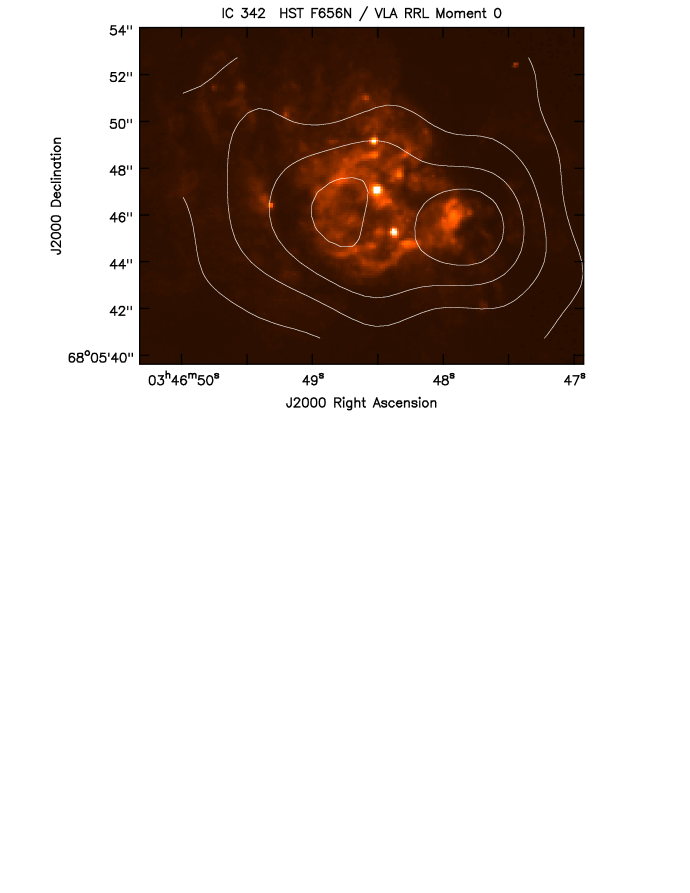
Radio continuum measurements are excellent probes of these regions since they can penetrate the gas and dust that surrounds the young star clusters. Observations at multiple frequencies measure the thermal emission associated with H ii regions and non-thermal emission related to supernova remnants (e.g., Turner & Ho 1983; Johnson et al. 2004). Radio recombination lines are fainter than radio continuum emission, but they directly measure the thermal emission and yield important information about the dynamics of these star clusters. Anantharamaiah et al. (2000) combined both RRL and continuum data at several different frequencies to constrain models of these young massive star clusters. Technical improvements provided by the JVLA increased the sensitivity of such work by almost an order of magnitude (Kepley et al. 2011), and enabled RRL studies of less massive star clusters. For example, Balser et al. (2017) detected RRL emission in IC 342 for the first time and revealed thermal emission to the east and west of the nuclear star cluster that was associated with giant molecular clouds (see Figure 3). The best fit model is a collection of many hundreds of compact (pc) H ii regions ionized by an equivalent of O6 stars. Even with the increased sensitivity of the JVLA these observations are challenging and we do not detect RRL emission in gas located beyond the most central regions. Better sensitivity over many spatial scales is required. Also, Anantharamaiah et al. (2000) showed that because of free-free opacity effects the RRL are brighter at higher frequencies and therefore it is important to observe RRLs over a large range of frequencies (e.g., 1-100 GHz).
The ngVLA has the required sensitivity spanning a wide range of spatial and frequency scales. Ideally, we want to resolve individual H ii regions but also have the sensitivity to detect extended emission (e.g., the diffuse ionized gas). So we need to probe scales from pc in galaxies with distances between 1-20 Mpc, or angular scales 0. To estimate the required spectral sensitivity we use a model H ii region. We assume a homogeneous sphere ionized by an O5 star at a distance of 2 Mpc with an electron density and temperature of 1,000 cm-3 and 8,000 K, respectively. Using the stellar models of Martins et al. (2005) the continuum flux density at a frequency of 5 GHz is 0.1 mJy (see appendix G.1 in Balser 1995). This continuum flux density estimate is similar to the values found in compact sources in nearby galaxies (e.g., Tsai et al. 2006). Assuming a line-to-continuum ratio of 0.1 yields a RRL intensity of Jy. Using the ngVLA sensitivity from Selina & Murphy (2017) for a 50 mas beam, we estimate an integration time of 35 hr assuming a SNR of 5, a spectral resolution of 5 km s-1, and averaging 20 RRLs. This is over two orders of magnitude more sensitive than our JVLA RRL observations. For an optically thin, unresolved H ii region the results are not very sensitive to the electron density, electron temperature, or frequency. Moreover, the flux density only increases by approximately a factor of two for an O3 star relative to an O6 star. The integration time can therefore be approximated as hr for detecting RRL emission from H ii regions ionized by a single star, where is the distance.
The RRL data probe the ionized gas and will complement observations that sample the neutral (H i; ngVLA) and molecular (CO; ALMA, ngVLA) components to characterize these star formation complexes. Detection of submillimeter H and He RRLs with ALMA trace the hardness of the radiation field, or indirectly the high-mass end of the initial mass function, in nearby massive young star clusters (e.g., see Scoville & Murchikova 2013). Similar observations with the ngVLA are possible at 3 mm assuming the ngVLA is about five times more sensitive than ALMA (A. Bolatto, private comm.). In principle the JWST Pa and ngVLA RRL intensity ratio could directly measure the dust extinction as a function of velocity.
5 Summary
The ngVLA will allow for sensitive observations of RRLs and impact the following areas:
-
•
Galactic Structure: The ngVLA will have the sensitivity to create a Galaxy-wide, volume-limited sample of H ii regions for the first time. This is needed to determine the global star formation properties of the Milky Way, and to better characterize both the morphological and chemical structure of the Galactic disk.
-
•
H I I Region Physics: The ngVLA could solve several long standing problems in H ii region physics. These include discriminating between different models of the collision rates from free electrons that determine the opacity, characterizing temperature fluctuations which effect abundance determinations, and directly measuring the magnetic field strength within H ii regions.
-
•
Star Formation in Nearby Galaxies: The ngVLA will have both the necessary sensitivity and spatial resolution to probe star formation in a statistically significant sample of nearby galaxies. RRLs provide an extinction-free tracer of the physical conditions and dynamics of the ionized gas.
References
- Anantharamaiah et al. (2000) Anantharamaiah, K. R., Viallefond, F., Mohan, N. R. et al. 2000, ApJ, 537, 613
- Anderson et al. (2012) Anderson, L. D., Bania, T. M., Balser, D. S., & Rood, R. T. 2012, ApJ, 754, 62
- Anderson et al. (2014) Anderson, L. D., Bania, T. M., Balser, D. S., et al. 2014, ApJS, 212, 1
- Anderson et al. (2009) Anderson, L. D., Bania, T. M., Jackson et al. 2009, ApJS, 181, 255
- Armentrout et al. (2017) Armentrout, W. P., Anderson, L. D., Balser, D. S. et al. 2017, ApJ, 841, 121
- Balser (1995) Balser, D. S. 1995, PhD thesis
- Balser (2006) Balser, D. S. 2006, AJ, 132, 2326
- Balser et al. (2016) Balser, D. S., Roshi, D. A., Jeyakumar, S. et al. 2016, ApJ, 816, 22
- Balser et al. (2015) Balser, D. S., Wenger, T. V., Anderson, L. D., & Bania, T. M. 2015, ApJ, 806, 199
- Balser et al. (2017) Balser, D. S., Wenger, T. V., Goss, W. M., Johnson, K. E., & Kepley, A. A., 2017, ApJ, 844, 73
- Bania et al. (2010) Bania, T. M., Anderson, L. D., Balser, D. S., & Rood, R. T. 2010, ApJ, 718, L106
- Brown et al. (2017) Brown, C., Jordan, C., Dickey, J. M. 2017, AJ, 154, 23
- Caswell & Haynes (1987) Caswell, J. L., & Haynes, R. F. 1987, A&A, 171, 261
- Crutcher et al. (2010) Crutcher, R. M., Wandelt, B., Heiles, C. et al. 2010, ApJ, 725, 466
- Garcá-Rojas & Esteban (2007) Garcá-Rojas, J., & Esteban, C. 2007, ApJ, 670, 457.
- Gordon & Sorochenko (2009) Gordon, M. A., & Sorochenko, R. L. 2009, ASSL, Vol. 282, Radio Recombination Lines
- Guzmán et al. (2016) Guzmán, F., Badnell, N. R., Williamns, R. J. R. et al. 2016, MNRAS, 459, 3498
- Johnson et al. (2004) Johnson, K. E., Indebetouw, R., Watson, C., & Kobulnicky, H. A. 2004, AJ, 128, 610
- Kepley et al. (2011) Kepley, A. A., Chomiuk, L., Johnson, K. E. et al. 2011, ApJ, 739, L24
- Koo et al. (2017) Koo, B.-C., Park, G., Kim, W.-T. et al. 2017, PASP, 129, 94102
- Kubryk et al. (2013) Kubryk, M., Prantzos, N., & Athanassoula, E. 2013, MNRAS, 436, 1479
- Lockman (1989) Lockman, F. J. 1989, ApJS, 71, 469
- Luisi et al. (2018) Luisi, M., Anderson, L. D., Bania, T. M. et al. 2018, PASP, in press (ArXiv:1805.11460)
- Martins et al. (2005) Martins, F., Schaerer, D., & Hillier, D. J. 2005, A&A, 436, 1049
- Peimbert (1967) Peimbert, M. 1967, ApJ, 150, 825
- Reid et al. (2014) Reid, M. J., Menten, K. M., Brunthaler, A., et al. 2014, ApJ, 783, 130
- Reifenstein et al. (1970) Reifenstein, E. C., III, Wilson, T. L., Burke, B. F. et al. 1970, A&A, 4, 357
- Roshi (2007) Roshi, D. A. 2007, ApJ, 658, L41
- Scoville & Murchikova (2013) Scoville, N., & Murchikova, L. 2013, ApJ, 779, 75
- Selina & Murphy (2017) Selina, R., & Murphy, E. 2017, ngVLA Memo 17.
- Troland & Heiles (1977) Troland, T. H. & Heiles, C. 1977, ApJ, 214, 703
- Troland & Heiles (1982) Troland, T. H. & Heiles, C. 1982, ApJ, 252, 179
- Tsai et al. (2006) Tsai, C.-W., Turner, J. L., Beck, S. C. et al. 2006, AJ, 132, 2383
- Turner & Ho (1983) Turner, J.L. & Ho, P.T.P. 1983, ApJ, 268, L79
- Wenger et al. (2018) Wenger, T. V., Balser, D. S., Anderson, L. D. & Bania, T. M. 2018, ApJ, 856, 52
- Wenger et al. (2013) Wenger, T. V., Bania, T. M., Balser, D. S., & Anderson, L. D. 2013, ApJ, 764, 34
- Wilson et al. (2015) Wilson, T. L., Bania, T. M., & Balser, D. S. 2015, ApJ, 812, 45
- Wilson et al. (1970) Wilson, T. L., Mezger, P. G., Gardner, F. F., & Milne, D. K. 1970, A&A, 6, 364
- Wink et al. (1983) Wink, J. E., Wilson, T. L., & Bieging, J. H. 1983, A&A, 127, 211