Singlet ground state in the alternating spin- chain compound NaVOAsO4
Abstract
We present the synthesis and a detailed investigation of structural and magnetic properties of polycrystalline NaVOAsO4 by means of x-ray diffraction, magnetization, electron spin resonance (ESR), and 75As nuclear magnetic resonance (NMR) measurements as well as density-functional band structure calculations. Temperature-dependent magnetic susceptibility, ESR intensity, and NMR line shift could be described well using an alternating spin- chain model with the exchange coupling K and an alternation parameter . From the high-field magnetic isotherm measured at K, the critical field of the gap closing is found to be T, which corresponds to the zero-field spin gap of K. Both NMR shift and spin-lattice relaxation rate show an activated behavior at low temperatures, further confirming the singlet ground state. The spin chains do not coincide with the structural chains, whereas the couplings between the spin chains are frustrated. Because of a relatively small spin gap, NaVOAsO4 is a promising compound for further experimental studies under high magnetic fields.
pacs:
75.50.Ee, 75.10.Pq, 75.30.Et, 71.20.Ps, 61.66.FnI Introduction
For decades, there has been a flourish of interest in one-dimensional (1D) quantum antiferromagnets (AFM), as they often provide unique opportunities to study the interplay between the charge, orbital, spin, and lattice degrees of freedom Sachdev (2008). In most of the 1D quantum AFMs, the frequently encountered ground state is a three dimensional (3D) long-range order (LRO), resulting from inter-chain interactions. Therefore, any new compound possessing a spin-gap in the excitation spectrum is of fundamental interest. Typically, the alternation of exchange interactions along the chain direction introduces a spin gap, as in (VO)2P2O7 Yamauchi et al. (1999). If this gap appears due to a structural distortion, which in turn causes spin dimerization, it is known as the spin-Peierls transition Chesnut (1966). However, not every structural phase transition accompanied by a spin-gap formation is a spin-Peierls transition. Such a transition has only been observed in several organic compounds Bray et al. (1975); Huizinga et al. (1979) and CuGeO3 Hase et al. (1993). For the mixed-valence compound NaV2O5, the formation of a singlet ground state is reported to be due to charge ordering Isobe and Ueda (1996), while for NaTiSi2O6 it is due to orbital ordering Isobe et al. (2002).
Spin chains with the gap in the excitation spectrum are sensitive to perturbations like inter-dimer couplings and external magnetic field. Above a threshold limit, the spin gap is closed, and a multitude of field-induced phases emerge. The singlet state sustains in low fields, where the magnetization remains nearly zero. But a higher field can close the gap and trigger an AFM LRO above the critical field of the gap closing. This fascinating field-induced phenomenon can be described as the Bose-Einstein Condensation (BEC) of triplons, where the particle density is proportional to the applied magnetic field acting as chemical potential of the Bose gas Rice (2002). Notable compounds showing the triplon BEC are BaCuSi2O6, Sr3Cr2O8, TlCuCl3 etc Sebastian et al. (2006); Aczel et al. (2009); Rüegg et al. (2003); Zapf et al. (2014); Freitas et al. (2017). Another important field-induced phenomenon shown by spin-gap systems is the emergence of a non-Fermi liquid-type Tomonaga-Luttinger liquid (TLL) phase above the critical field of the gap closing Tomonaga (1950); Luttinger (2014). The spin-ladder compound (C7H10N)2CuBr4 presents an excellent experiment realization, where the TLL phase evolves from the singlet state Jeong et al. (2017); Hong et al. (2010); Povarov et al. (2015); Jeong et al. (2016); Möller et al. (2017). The transition between the 1D TLL and 3D BEC is successfully explained in another ladder compound (C5H12N)2CuBr4 Thielemann et al. (2009); Rüegg et al. (2008). Quasi-1D materials involving alternating spin chains may show signatures of both TLL and BEC physics, thus giving researchers an opportunity to study the crossover effects from 1D to 3D physics Orignac et al. (2007); Willenberg et al. (2015).
In addition, spin-gap materials also exhibit various other peculiar features like Wigner crystallization of magnons, magnetization plateaus, etc, under external magnetic fieldKim and Aronson (2013). Orthogonal dimer compound SrCu2(BO3)2 with the Shastry-Sutherland lattice is a well-known example showing these exotic features Kodama et al. (2002). The above field-induced effects are explored only in very few experimental systems till date due to the shortage of model compounds. In this context, materials with the small spin gap are preferable, so that one can explore the field-induced phenomena and the complete phase diagram using practically accessible magnetic fields.
In this work, we endeavor to elucidate the magnetic behavior of NaVOAsO4 by means of magnetization, electron spin resonance (ESR), and 75As Nuclear Magnetic Resonance (NMR) experiments combined with density-functional band-structure calculations. A comparison is made with AgVOAsO4 in order to understand the role of the inter-chain couplings on the size of the spin gap. AgVOAsO4 is reported as the alternating spin- chain compound with the singlet ground state. It crystallizes in the monoclinic (space group ) structure with the lattice parameters Å, Å, Å, , and unit cell volume Å3 Tsirlin et al. (2011a). From the analysis of magnetic susceptibility, high-field magnetization, ESR, 75As NMR, and band-structure calculations, the dominant exchange coupling, alternation parameter, zero-field spin gap, and critical field of the gap closing are reported to be K, , K, and T, respectively Tsirlin et al. (2011a); Ahmed et al. (2017).
When Ag+ (ionic radius: 1.29 Å) is replaced by Na+ (ionic radius: 1.16 Å), the crystal structure remains unaltered. The reported unit cell parameters for NaVOAsO4 are Å, Å, Å, , and Å3 Haddad et al. (1992). The main objective of this work is to tune the spin gap and hence the critical field of the gap closing by chemical substitution, which may facilitate the study of field-induced effects using commonly accessible laboratory fields.
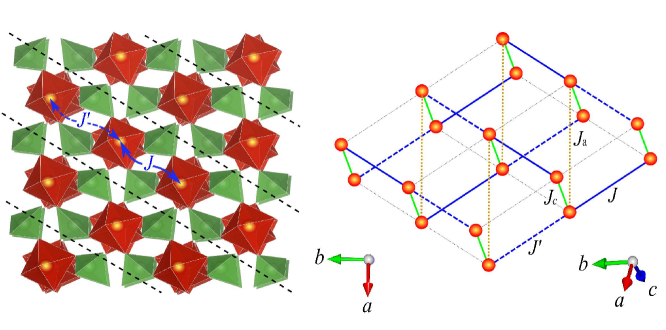
In NaVOAsO4, there are one As atom, one Na atom, one V atom, and five nonequivalent O atoms. Similar to AgVOAsO4, each AsO4 tetrahedron is coupled with four VO6 octahedra to form alternating spin chains that run nearly perpendicular to each other in the -plane, as shown in Fig. 1. There are also weak inter-chain exchange interactions, which make a frustrated network between the chains. The directions of all the exchange interactions are clearly depicted in the right panel of Fig. 1. The As atom is strongly coupled to the two neighbouring magnetic V4+ ions along the direction of the spin chain. On the other hand, the Na atom is located in between the chains and seems to be very weakly coupled to the magnetic V4+ ions. To the best of our knowledge, no information about the magnetic properties of this compound has been reported till date.
II Methods
Polycrystalline sample of NaVOAsO4 was synthesized by the conventional solid-state reaction technique by annealing the stoichiometric mixture of Na2O (99.99%), As2O5 (99.99%), and VO2 (99.99%) (all from Sigma-Aldrich) in an evacuated silica tube at 500 ∘C for 48 h with one intermediate grinding and pelletization. To avoid the hydration, the reactants were handled in an Ar filled glove box. The resulting sample was green in color. Its phase purity was confirmed by powder x-ray diffraction (XRD, PANalytical powder diffractometer with Cu radiation, Å) at room temperature. Temperature () dependent powder XRD measurements were performed in the -range 15 K - 300 K using the low- attachment (Oxford Phenix) to the x-ray diffractometer. Rietveld refinement of the observed XRD patterns was performed using the
ullProf ~package~\cite{Carvajal55}, taking the initial parameters from Ref.~\onlinecite{Haddad57}.
DC magnetization ($M$) was measured as a function of $T$ and applied magnetic field $H$ using the vibrating sample magnetometer (VSM) attachment to the Physical Property Measurement System [PPMS, Quantum Design]. High-field magnetization isotherm ($M$ vs $H$) was measured at $T = 1.5$~K in pulsed magnetic field up to 60~T at the Dresden High Magnetic
ield Laboratory Tsirlin et al. (2009).
The ESR experiments were carried out on a fine powdered sample with the standard continuous-wave spectrometer between 3 K and 300 K. We measured the power absorbed by the sample from a transverse magnetic microwave field (X-band, GHz), as a function of the external magnetic field . The lock-in technique was used to improve the signal-to-noise ratio which yields the derivative of the resonance signal . The -factor was determined by the resonance condition , where is the Planck’s constant, is the Bohr magneton, is the resonance frequency, and is the corresponding resonance field.
The NMR experiments on 75As nucleus (nuclear spin , gyromagnetic ratio MHz/T) were carried out using pulsed NMR technique at a radio frequency (/2) of 50.44 MHz, which corresponds to the magnetic field of T. At each temperature, the 75As NMR spectrum was obtained by sweeping the magnetic field while keeping the frequency fixed. The NMR shift was determined from the resonance field of the sample with respect to the resonance field of the reference GaAs sample. The spin-lattice relaxation rate () measurements were done using the standard inversion recovery method.
Exchange couplings of the Heisenberg spin Hamiltonian
| (1) |
where and the summation is over the lattice bonds , were obtained by a mapping procedure using density-functional (DFT) band-structure calculations performed in the FPLO code Koepernik and Eschrig (1999) within the generalized gradient approximation (GGA) for the exchange-correlation potential Perdew et al. (1996). The mean-field DFT+ correction for correlation effects in the V shell was used. Additionally, we analyzed the uncorrelated GGA band structure and extracted the hopping parameters, which were further used to obtain antiferromagnetic exchange couplings on the level of second-order perturbation theory, as further explained in Sec. III.5. The typical -mesh included 128 points in the irreducible part of the first Brillouin zone. In the DFT+ calculations, we applied eV and eV for the on-site Coulomb repulsion and Hund’s exchange, respectively, as well as the around-mean-field correction for double-counting Tsirlin et al. (2011a); Nath et al. (2008a); Tsirlin and Rosner (2011). The structural parameters from Ref. Haddad et al., 1992 were used.
III Results and Discussion
III.1 X-Ray diffraction
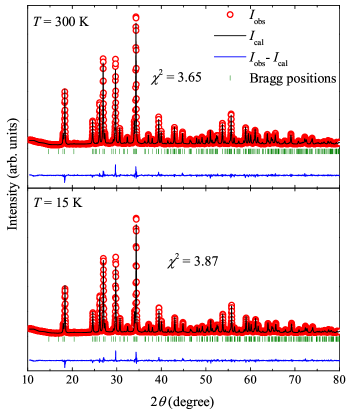
Figure 2 shows the powder XRD pattern of NaVOAsO4 at two different temperatures, K and 300 K, along with the refinement. The obtained best fit parameters at 300 K and 15 K are [ Å, Å, Å, , Å3, and the goodness-of-fit ] and [ Å, Å, Å, , Å3, and ], respectively. These values are in close agreement with the reported values Haddad et al. (1992). A slight decrease in volume at room temperature for NaVOAsO4 compared to AgVOAsO4 is likely due to the fact that Na+ (ionic radius: 1.16 Å) has a smaller ionic radius than Ag+ (ionic radius: 1.29 Å). The atomic positions obtained from the structural refinement at room temperature ( K) are listed in Table 1.
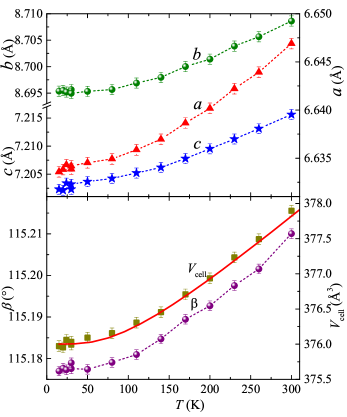
The powder XRD pattern at different temperatures were also analyzed by the Rietveld refinement to understand the temperature variation of the crystal structure. Going from 300 K to 15 K, the overall XRD pattern remains intact, thus ruling out any structural phase transitions or lattice distortions that take place in other spin-gap compounds like CuGeO3 Hirota et al. (1994), NaV2O5 Fujii et al. (1997), and NaTiSi2O6 Isobe et al. (2002). The temperature dependence of the lattice parameters obtained from the refinement is plotted in Fig. 3. The lattice constants , , and , and the angle are found to decrease upon cooling. As a result, also shows a gradual decrease with decreasing temperature from 300 K to 15 K.
| Atom | Wyckoff | ||||
|---|---|---|---|---|---|
| position | |||||
| Na | 0.261(1) | 0.5840(4) | 0.285(1) | 0.16(4) | |
| V | 0.2414(7) | 0.2610(5) | 0.0299(6) | 1.0(1) | |
| As | 0.7483(7) | 0.4366(1) | 0.2492(6) | 0.93(4) | |
| O1 | 0.251(3) | 0.3217(7) | 0.261(2) | 0.48(5) | |
| O2 | 0.081(2) | 0.801(1) | 0.090(1) | 0.48(5) | |
| O3 | 0.125(2) | 0.037(1) | 0.382(2) | 0.48(5) | |
| O4 | 0.542(2) | 0.319(1) | 0.078(1) | 0.48(5) | |
| O5 | 0.363(2) | 0.045(1) | 0.116(2) | 0.48(5) |
The temperature variation of was modeled following the Grüneisen approximation for the zero-pressure state, where the effects of thermal expansion are considered to be equivalent to the elastic strain Wallace (1998). can be written as Bag et al. (2018)
| (2) |
where is the unit cell volume at K, is the bulk modulus, is the Grüneisen parameter, and is the internal energy. The can be expressed in terms of the Debye approximation as
| (3) |
where is the characteristic Debye temperature, is the number of atoms per unit cell, and is the Boltzmann constant. The fit is shown as the solid line in the bottom panel of Fig. 3. The obtained best fit parameters are K and Å3.
III.2 Magnetization
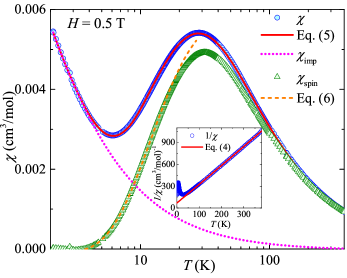
The temperature-dependent magnetic susceptibility () measured in an applied field of T is shown in Fig. 4. As the temperature decreases, increases in the Curie-Weiss manner as expected in the paramagnetic regime and then shows a broad maximum at around K, indicative of a short-range magnetic order, as expected for low-dimensional spin systems. Below , it shows a rapid decrease and then an upturn. This low temperature upturn is likely due to the extrinsic paramagnetic impurities and/or defects present in the sample Arjun et al. (2017). There is no clear indication of any magnetic LRO down to 2 K.
To extract the magnetic parameters, at high temperatures was fitted by the following expression
| (4) |
where is the temperature independent contribution consisting of the diamagnetic susceptibility () of core electron shells and Van-Vleck paramagnetic susceptibility () of the open shells of the V4+ ions. The second term in Eq. (4) is the Curie-Weiss (CW) law with the CW temperature and Curie constant . Here, is Avogadro’s number, is the effective magnetic moment, is the Land -factor, is the Bohr magneton, and is the spin quantum number. Our fit in the temperature range 150 K to 380 K (inset of Fig. 4) yields cm3/mol, cm3K/mol, and K. From the value of , the effective moment was calculated to be in good agreement with the expected spin-only value of 1.73 for , assuming . The negative value of indicates that the dominant exchange couplings between V4+ ions are antiferromagnetic in nature.
In order to estimate the exchange couplings, the data were fitted by
| (5) |
Here, represents the Curie constant corresponding to the impurity spins and quantifies the effective interaction between them. is the expression for the spin susceptibility of the alternating spin- chain model, valid for the entire range and for the entire temperature range , where and are the exchange couplings along the chain.Johnston et al. (2000) As shown in Fig. 4, Eq. (5) fits very well to the data over the whole temperature range, yielding K, , cm3/mol, cm3K/mol, and K. During the fitting procedure, the value of was fixed to , obtained from the ESR experiments (discussed later). The above value of corresponds to the concentration of nearly 4.1 %, assuming the impurity spins to be . Using the value of and , the spin gap is estimated to be K Johnston et al. (2000). The critical field for closing a gap of K is estimated to be T.
In order to see the low-temperature gapped behavior, the impurity contribution () was subtracted from and the obtained is plotted in the same Fig. 4. It shows a clear exponential decrease towards zero demonstrating the singlet ground state. below the broad maximum is fitted using the expression for the spin susceptibility of a gapped spin- 1D Heisenberg chain Sachdev and Damle (1997)
| (6) |
The fit in the low- region ( K) returns K which is slightly lower than the value obtained from the alternating chain model fit. The critical field for closing this gap is T.
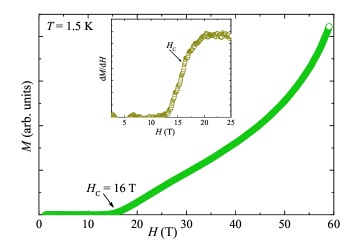
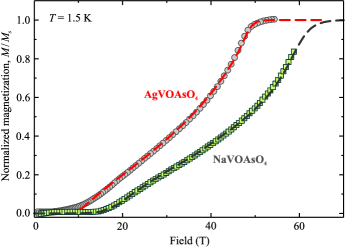
The magnetic isotherm measured up to 60 T at K is shown in Fig. 5. In the low-field regime, is very small and remains almost constant up to about 16 T, suggesting that the critical field of the gap closing is T. It is slightly higher than T in AgVOAsO4 but is still in the accessible range. This value of corresponds to the zero-field spin gap of K, which is slightly lower than the one obtained from the analysis but consistent with that obtained from the fit using Eq. (6). Typically, in the spin-gap compounds, the magnetization remains zero up to . However, in our compound, a finite value of the moment was obtained below which is likely due to the saturation of paramagnetic impurities in the powder sample. The data shown in Fig. 5 are corrected for this paramagnetc contributions. For T, increases almost linearly with and then shows a pronounced curvature. It does not saturate even at 60 T. A pronounced curvature above reflects strong quantum fluctuations, as expected for 1D spin chains. The lack of saturation even at 60 T suggests a large value of the exchange coupling.
III.3 ESR
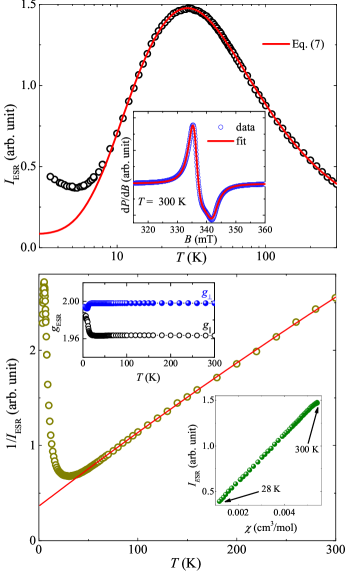
ESR results on the NaVOAsO4 powder sample are presented in Fig. 6. The inset of the upper panel of Fig. 6 depicts a typical ESR powder spectrum at room temperature. We tried to fit the spectra using the powder-averaged Lorentzian line for the uniaxial -factor anisotropy. The fit reproduces the spectral shape very well at K, yielding the anisotropic -tensor components (parallel) and (perpendicular). The isotropic value is calculated to be . Such a value of is typically observed for V4+ compounds Yogi et al. (2015); Tsirlin et al. (2011a). As shown in the top inset of the lower panel of Fig. 6, both and are found to be temperature-independent down to about 10 K. Only below 10 K, an anomalous behaviour was observed, which could be due to extrinsic foreign phases. The ESR intensity () as a function of temperature shows a pronounced broad maximum at K, similar to the bulk data. In the bottom inset of the lower panel of Fig. 6, is plotted as a function of with temperature as an implicit parameter. It shows linearity over the temperature range of 28 K to 300 K, implying that traces nicely.
In order to estimate the exchange couplings, data were fitted by the equation
| (7) |
where and are arbitrary constants. The fit in the range 9 K to 300 K (upper panel of Fig. 6) with the fixed yields K and . This value of is close to the one obtained from the analysis. In the lower panel of Fig. 6, the inverse ESR intensity ( ) is plotted as a function of temperature. At high temperatures, the linear behavior resembles the data. We fitted by an expression
| (8) |
where and are arbitrary constants. The fit in the high-temperature region yields K, which is little higher in magnitude than the value obtained from the analysis.
III.4 75As NMR
NMR is a powerful local technique to study the static and dynamic properties of a spin system. In NaVOAsO4, the 75As nuclei are strongly hyperfine-coupled to the magnetic V4+ ions along the spin chains. Therefore, the low-lying excitations of the V4+ spins can be probed by means of the 75As NMR spectra, NMR shift, and spin-lattice relaxation time measurements. As discussed earlier, the data do not show an exponential decrease as anticipated for a spin gap system since the low-temperature impurity contribution masks the spin-gap behavior. Secondly, due to several fitting parameters, the analysis often doesn’t provide reliable magnetic parameters. In this context, the NMR shift has an advantage over the bulk . The bulk data include additional contributions coming from impurities and defects present in the sample, whereas the NMR shift directly measures the intrinsic spin susceptibility and is completely free from the extrinsic contributions. Therefore, one can precisely estimate the magnetic parameters by analyzing the temperature-dependent NMR shift instead of the bulk , and underpin the singlet ground state.
III.4.1 NMR Spectra
75As is a quadrupole nucleus with the nuclear spin in a non-cubic environment. Therefore, the four-fold degeneracy of the nuclear spin is partially lifted by the interaction between the nuclear quadrupole moment and the surrounding electric-field gradient (EFG). The nuclear spin Hamiltonian can be written as a sum of the Zeeman and quadrupolar interactions Curro (2009); Slichter (1992),
| (9) |
Here, the nuclear quadrupole resonance (NQR) frequency is defined as , is the electron charge, is the Planck’s constant, is the applied field along , is the magnetic shift due to hyperfine field at the nuclear site, are the components of the EFG tensor, is the largest eigenvalue of the EFG, and () is the asymmetry parameter. The principal axes , , of the EFG tensor are defined by the local symmetry of the crystal structure. Therefore, resonance frequency corresponding to any nuclear transition is strongly dependent on the direction of the applied field relative to the crystallographic axes. The parameters , , and can fully characterize the EFG, where, is the unit vector in the direction of the principal axis of the EFG with the largest eigenvalue.
When the Zeeman term dominates over the quadrupole term, first-order perturbation theory is enough for describing the system. In such a scenario, for a nucleus, two equally spaced satellite peaks () should appear on either side of the central peak (), separated by . On the other hand, when the quadrupole effects are large enough, second-order perturbation theory is required, and and the peak positions depend strongly on the angle between the applied field (along ) and . The expression for the resonance frequency for the central transition can be written as
| (10) |
where is the Larmor frequency and is the azimuthal angle. For a polycrystalline sample, the NMR spectra are typically broad due to random distribution of the internal field. They use to show the central transition () split into two horns, which correspond to crystallites with (lower frequency peak) and to (upper frequency peak) Slichter (1992); Grafe et al. (2008).
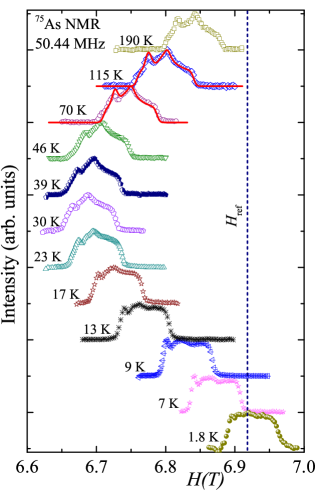
The 75As NMR spectra measured at different temperatures are shown in Fig. 7. Their asymmetric double-horn line shape can be described well by the second-order nuclear quadrupolar interaction. The obtained fitting parameters corresponding to the spectrum at K are: the isotropic shift %, axial shift %, anisotropic shift %, NQR frequency MHz, asymmetry parameter , and line width MHz. The quadrupolar frequency is found to be almost constant in the measured temperature range, thus ruling out the possibility of any structural deformation of VO6 octahedra and/or lattice distortion. This is in sharp contrast to what is observed in the spin-Peierls compound CuGeO3 where the lattice distortion leads to the spin dimerization Hase et al. (1993) and in NaxV2O5 where the singlet ground state is driven by charge ordering Fagot-Revurat et al. (2000) at low temperatures. This is indeed consistent with our temperature dependent powder XRD data.
III.4.2 NMR Shift
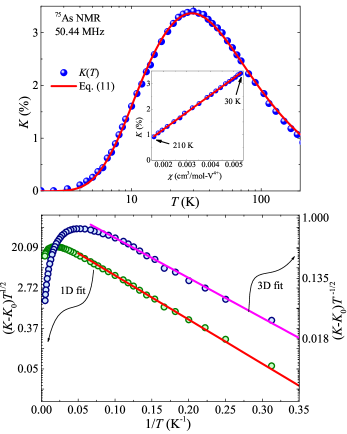
From Fig. 7 we can clearly see that the line position is shifting with temperature. The temperature-dependent NMR shift was extracted by taking the zero quadrupole shift with respect to the reference field of GaAs and is presented in Fig. 8. Similar to , also passes through a broad maximum at around 30 K, which indicates low-dimensional short-range order. At low temperatures, decreases rapidly towards zero, which clearly signifies the reduction of the spin susceptibility of V4+and the opening of a spin gap between the singlet () ground state and triplet () excited states. It also implies that the low-temperature upturn observed in is purely extrinsic in nature and could be due to a small amount of extrinsic impurities, defects, and/or finite crystallite size. In powder samples, the defects often break the spin chains and the unpaired spins at the end of finite chains give rise to the staggered magnetization, which also appears as low-temperature Curie tail in .
In general, one can write in terms of as
| (11) |
where is the temperature-independent chemical shift and is the total hyperfine coupling between the 75As nuclei and V4+ spins. includes contributions from transferred hyperfine coupling and the nuclear dipolar coupling, both of which are temperature-independent. The magnitude of the nuclear dipolar coupling is usually negligible compared to the transferred hyperfine coupling. From Eq. (11), can be calculated by taking the slope of the linear vs plot (inset of Fig. 8) with temperature as an implicit parameter. The data used in the inset of Fig. 8 were measured at 7 T, which is close to the field at which our NMR experiments were performed. The data for K were fitted well to a linear function, and the slope of the fit yields T/. Nearly the same value of is reported for the isostructural compound AgVOAsO4 Ahmed et al. (2017). However, it is an order of magnitude larger than the one observed for 31P in 1D spin- chain compounds like (Sr,Ba)Cu(PO4)2 and K2CuP2O7 with similar interaction pathways Nath et al. (2005, 2008b). Such a large hyperfine coupling suggests a strong overlap between the orbitals of As5+ and orbitals of V4+ ions via the 2 orbitals of O2-. This also explains why the superexchange interaction between V4+ ions is stronger via the V-O-As-O-V pathway than via the structural chains with the shorter V-O-V path (see Ref. Tsirlin et al., 2011a and Sec. III.5 below).
In order to extract the exchange couplings, the data were fitted using Eq. (11) over the whole temperature range, taking for the spin- alternating chain model given by Johnston Johnston et al. (2000). To minimize the number of fitting parameters, and were fixed to the values obtained from the vs analysis and ESR experiments, respectively. Our fit in the whole temperature range yields %, K, and . The quality of the fit was very good (see upper panel of Fig. 8) and the obtained values of and are close to those obtained from the and analysis. Using the above values of and , the estimated spin gap is K which is similar to the values reported above, yet unexpected. It should be noted that the expressions by Johnston are applicable for the estimation of and from the data in the zero-field limit but our NMR experiments were carried out at a high field of 6.8 T, where the gap is expected to decrease to about K, assuming a linear decrease of the gap with field from the zero-field value K towards at 111Note that from the high-field magnetization, the critical field of the gap closing is T, and the corresponding zero-field spin gap is K. Since the 75As NMR measurements were carried out in the field of 6.8 T, the spin gap will be reduced. The reduction is estimated as K. Thus, from 75As NMR at 6.8 T one should observe a spin gap of K, assuming the linear field dependence of ..
One can also estimate the spin gap by analyzing the low-temperature part of the data. We fitted the low-temperature ( K) data by , where and are arbitrary constants and is given by Eq. (6) with a change that is replaced by . The obtained fitting parameters are %, %, and K. The fit is shown in the lower panel of Fig. 8 where we have plotted vs . The -axis is shown in the log scale in order to highlight the linear behavior in the gapped region. This value of is still higher than the expected value of K at T ††footnotemark: . Note, however, that the Eq. (6) used here to fit is obtained in the low-field limit Sachdev and Damle (1997); Damle and Sachdev (1998) while our experimental data are taken in the field of 6.8 T, which is comparable to the thermal energy below K. From the band-structure calculations, it is evident that the inter-chain couplings are non-negligible and modify the dispersion of the triplet band. Therefore, the temperature range of the fitting is expected to be dominated by the 3D correlations and, consequently, the low-temperature fit using the 1D model may not give a reliable estimation of the spin gap.
According to Ref. Taniguchi et al., 1995, for a -dimensional spin system, the low-temperature () susceptibility can be expressed as
| (12) |
Assuming that our low-temperature data are dominated by the 3D () correlations, the above expression is reduced to , where is a constant. In the lower panel of Fig. 8 (right -axis), we have plotted versus , which shows a linear regime for K. Our fit in this regime returns %, K-1/2, and K. This value of extracted from the data using the 3D model is very close to the expected value of 12.3 K at 6.8 T ††footnotemark: .
III.4.3 Spin-lattice relaxation rate,
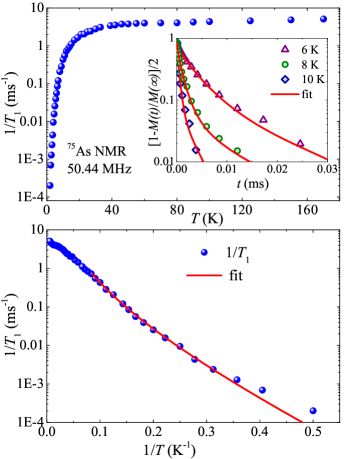
Spin-lattice relaxation rate, , is an important parameter for understanding the dynamic properties of a spin system. It gives direct access to the low-energy spin excitations by probing the nearly zero-energy limit (in the momentum space) of the local spin-spin correlation function Moriya (1956). The measurements for the 75As nuclei were done at a field corresponding to the center of the spectra and using relatively narrow pulses. Recovery of the longitudinal magnetization at different temperatures, measured using the inversion recovery sequence, , was fitted using the double exponential function Gordon and Hoch (1978); *Simmons1168
| (13) |
which corresponds to the 75As nuclei. Here, and are the nuclear magnetizations at time and at equilibrium (), respectively. The inset of Fig. 9 depicts the recovery curves at three different temperatures. The values obtained from the fit are plotted as a function of temperature in Fig. 9. At high temperatures, remains constant, a typical behavior expected in the paramagnetic regime Moriya (1956). Below about 12 K, decreases rapidly towards zero because of the opening of a spin gap in the excitation spectrum.
Generally, can be expressed in terms of the dynamical susceptibility per mole of electronic spins as Nath et al. (2009); Ranjith et al. (2015)
| (14) |
Here, the summation is over all the wave vectors in the first Brillouin zone. is the form factor of the hyperfine interactions as a function of and is the imaginary part of the dynamic susceptibility at the nuclear Larmor frequency . When and , the real component corresponds to the uniform static susceptibility . In the paramagnetic regime where spins are uncorrelated, is dominated by the uniform fluctuations and hence remains independent of Moriya (1956). In that case, is expected to be a constant. In our compound, the temperature independent behavior at high temperatures is consistent with this expectation.
For the estimation of spin gap, we tried to fit the data by the 1D expression Sachdev and Damle (1997); Damle and Sachdev (1998)
| (15) |
From the fit below 11 K, the value of the spin gap is estimated to be K, which is higher than K, expected at 6.8 T ††footnotemark: . For an accurate determination of the spin gap, it would be ideal to fit the data using the expression
| (16) |
which accounts for the 3D magnon excitations over the gapped region (). Here, the exponent depends on the effective dimension of the magnon dispersion relation as selected by thermal fluctuations Mukhopadhyay et al. (2012). On increasing , gradually varies from 2 (for the 3D regime, ) to 0 (for the 1D regime, ). The lower panel Fig. 9 shows vs plot along with the fit using Eq. (16), where the -axis is shown in the log scale in order to highlight the activated behavior at low temperatures. Our fit in the low- region ( K) with the fixed (from ESR), and T (experimental NMR field), and (for the 3D regime) yields the critical field of the gap closing T. The corresponding value of the zero-field spin gap is K. This value is in very good agreement with our previous estimation from the high-field magnetization data. Moreover, the value of the exponent suggests that at low temperatures the spin-lattice is dominated by 3D correlations, as corroborated by the analysis and band-structure calculations.
III.5 Microscopic magnetic model
Two complementary techniques can be used to estimate exchange couplings in materials. On one hand, total-energy DFT+ calculations allow a direct parametrization of the spin Hamiltonian through the so-called mapping procedure Xiang et al. (2011), although its results may become ambiguous and depend on computational details, such as the double-counting correction of the DFT+ method Tsirlin et al. (2011b). On the other hand, hopping parameters of the uncorrelated (GGA) band structure can be directly introduced into an effective one-orbital Hubbard model, which in the half-filling regime maps onto a spin Hamiltonian for low-energy excitations. Consequently, the AFM part of the exchange is obtained as , where eV stands for the effective on-site Coulomb repulsion in the V band Tsirlin et al. (2008). This way, relative strengths of the exchange couplings can be directly linked to the hopping parameters , which are not biased by the choice of the Hubbard and by details of its DFT+ implementation.
| NaVOAsO4 | AgVOAsO4 | |||||
|---|---|---|---|---|---|---|
| 5.519 | 99 | 57 | 5.587 | 87 | 45 | |
| 5.489 | 81 | 54 | 5.556 | 71 | 41 | |
| 3.617 | 25 | 8 | 3.639 | 30 | 9 | |
| 6.073 | 9 | 6.118 | 3 | |||
Table 2 presents the comparative DFT results for the exchange couplings in NaVOAsO4 and AgVOAsO4. Both compounds feature spin chains formed by and . These spin chains do not coincide with the structural chains, as shown in Fig. 1. The values of and suggest that the intrachain couplings in NaVOAsO4 are enhanced compared to the Ag analog, yet the alternation ratio given by remains nearly constant. The interchain couplings are ferromagnetic (FM) and AFM , and they both become slightly weaker upon the replacement of Ag by Na. This way, NaVOAsO4 is somewhat closer to the 1D alternating-chain regime than the Ag compound.
On a more quantitative level DFT+ overestimates the alternation ratio and renders nearly equal to , the result not supported by the hopping parameters and also contradicting the experiment. A similar problem occurs in the case of AgVOAsO4 Tsirlin et al. (2011a) and may be related to the intrinsic difficulties of evaluating weak exchange couplings (or small differences between the exchange couplings) within DFT+ Tsirlin and Rosner (2009). All qualitative trends are, nevertheless, consistent with the experimental findings. The susceptibility fit with the alternating-chain model yields stronger exchange couplings in NaVOAsO4 ( K, K) and weaker couplings in AgVOAsO4 ( K, K Tsirlin et al. (2011a)) with about the same alternation ratio (Na) and (Ag).
For a further comparison, we take a closer look at the magnetization curves of the two compounds (Fig. 10). The overall increase in the coupling energy shifts the saturation toward higher fields. AgVOAsO4 saturates at 48.5 T, whereas the saturation of NaVOAsO4 is not reached even at 59 T, the highest field of our measurement. With the 23% increase in and , one expects a similar increase in that amounts to 10 T in AgVOAsO4 and should then be around 12 T in NaVOAsO4, much lower than the experimental value of 16 T. This discrepancy confirms that not only the intrachain couplings increase but also the interchain couplings decrease upon the replacement of Ag by Na. Direct simulation of the magnetization curves (Fig. 10) shows the best agreement for in AgVOAsO4 vs. in NaVOAsO4, thus suggesting a significant reduction in the interchain exchange 222Similar to Ref. Tsirlin et al., 2011a, we perform simulations for a 2D array of alternating spin chains uniformly coupled by an effective interchain coupling . The actual 3D spin lattice of NaVOAsO4 is frustrated and thus not amenable to QMC simulations owing to the notorious sign problem..
Finally, we note that individual exchange couplings in NaVOAsO4 follow the general microscopic scenario for the V4+ compounds. The distortion of the VO6 octahedra puts the magnetic orbital in the plane perpendicular to the structural chains Tsirlin et al. (2011a). This facilitates magnetic interactions between the structural chains ( and ) and suppresses the coupling along these chains. The interaction through a single AsO4 tetrahedron is of similar strength as but of the opposite sign, which leads to a competing exchange scenario and the frustration of the 3D spin lattice, where the four-fold loops with one FM and three AFM couplings are present (Fig. 1). The frustrated nature of the interchain couplings was arguably the reason for inconsistencies in the fitting parameters for AgVOAsO4 Tsirlin et al. (2011a): compare K from the susceptibility fit to K from the fit of the magnetization curve. This discrepancy is basically remedied in NaVOAsO4, where we find a consistent fit of both susceptibility and high-field magnetization with K and . Therefore, the frustration seems to play minor role in NaVOAsO4 compared to its Ag analogue.
IV Summary
We have studied in detail the magnetic behavior of the quantum magnet NaVOAsO4 and establish it as a new alternating spin- chain compound. The adjacent V4+ ions are coupled antiferromagnetically and form alternating chains running in two crossing directions in the -plane. Compared to its Ag-analogue, the lattice parameters and unit cell volume are smaller in magnitude for NaVOAsO4. As a result, the strength of the exchange interactions are found to be stronger in NaVOAsO4.
The data analysis with the alternating spin- chain model establishes a spin gap between the singlet ground state and the triplet excited states with the exchange couplings K and K, which are about 23% larger than in the Ag-analogue. The spin gap K is determined from the critical field of T, where the magnetization departs from zero. The relatively large compared to T in AgVOAsO4 is not fully accounted by the increased intrachain couplings and also reflects the reduction in the interchange couplings. Therefore, NaVOAsO4 is closer to the 1D regime.
The 75As nuclei are strongly coupled to the magnetic V4+ spins with a hyperfine coupling T/. The NMR shift and the spin-lattice relaxation rate show the low-temperature activated behavior, which unambiguously demonstrates the singlet ground state in this compound. The spin gap K extracted from the data using the 3D model is much closer to the expected value of K at 6.8 T, assuming a linear decrease of the spin gap with the applied field. Our estimated value of the zero-field spin gap from the analysis, accounting for the 3D magnon dispersion, is consistent with that obtained from the magnetization isotherm data, suggesting that at low temperatures NaVOAsO4 acts as a 3D magnet despite its relatively weak interchain couplings. The gapped nature of the spectrum and the availability of the microscopic parameters render NaVOAsO4 a model compound for high-field studies especially for exploring field-induced effects.
Acknowledgements.
UA and RN would like to acknowledge BRNS, India for financial support bearing sanction No.37(3)/14/26/2017-BRNS. AAT was supported by the Federal Ministry of Education and Research through the Sofja Kovalevskaya Award of Alexander von Humboldt Foundation. We thank B.R. Sekhar for useful discussions.References
- Sachdev (2008) S. Sachdev, “Quantum magnetism and criticality,” Nature Phys. 4, 173 (2008).
- Yamauchi et al. (1999) T. Yamauchi, Y. Narumi, J. Kikuchi, Y. Ueda, K. Tatani, T. C. Kobayashi, K. Kindo, and K. Motoya, “Two gaps in (VO)2P2O7: Observation using high-field magnetization and NMR,” Phys. Rev. Lett. 83, 3729–3732 (1999).
- Chesnut (1966) D. B. Chesnut, “Instability of a linear spin array: Application to Würster’s blue perchlorate,” J. Chem. Phys. 45, 4677–4681 (1966).
- Bray et al. (1975) J. W. Bray, H. R. Hart, L. V. Interrante, I. S. Jacobs, J. S. Kasper, G. D. Watkins, S. H. Wee, and J. C. Bonner, “Observation of a spin-Peierls transition in a Heisenberg antiferromagnetic linear-chain system,” Phys. Rev. Lett. 35, 744–747 (1975).
- Huizinga et al. (1979) S. Huizinga, J. Kommandeur, G. A. Sawatzky, B. T. Thole, K. Kopinga, W. J. M. de Jonge, and J. Roos, “Spin-Peierls transition in N-methyl-N-ethyl-morpholinium-ditetracyanoquinodimethanide [MEM-],” Phys. Rev. B 19, 4723–4732 (1979).
- Hase et al. (1993) M. Hase, I. Terasaki, and K. Uchinokura, “Observation of the spin-Peierls transition in linear Cu2+ (spin-1/2) chains in an inorganic compound CuGeO3,” Phys. Rev. Lett. 70, 3651–3654 (1993).
- Isobe and Ueda (1996) M. Isobe and Y. Ueda, “Magnetic susceptibility of quasi-one-dimensional compound -NaV2O5: Possible spin-Peierls compound with high critical temperature of 34 K,” J. Phys. Soc. Jpn. 65, 1178–1181 (1996).
- Isobe et al. (2002) M. Isobe, E. Ninomiya, A.N. Vasil’ev, and Y. Ueda, “Novel phase transition in spin-1/2 linear chain systems: NaTiSi2O6 and LiTiSi2O6,” J. Phys. Soc. Jpn. 71, 1423–1426 (2002).
- Rice (2002) T. M. Rice, “To condense or not to condense,” Science 298, 760–761 (2002).
- Sebastian et al. (2006) S. E. Sebastian, N Harrison, C. D. Batista, L. Balicas, M. Jaime, P. A. Sharma, N Kawashima, and I. R. Fisher, “Dimensional reduction at a quantum critical point,” Nature 441, 617–620 (2006).
- Aczel et al. (2009) A. A. Aczel, Y. Kohama, C. Marcenat, F. Weickert, M. Jaime, O. E. Ayala-Valenzuela, R. D. McDonald, S. D. Selesnic, H. A. Dabkowska, and G. M. Luke, “Field-induced Bose-Einstein condensation of triplons up to 8 K in Sr3Cr2O8,” Phys. Rev. Lett. 103, 207203 (2009).
- Rüegg et al. (2003) Ch. Rüegg, N Cavadini, A Furrer, H.-U. Gudel, K. Kramer, H. Mutka, A. Wildes, K. Habicht, and P. Vorderwisch, “Bose-Einstein condensation of the triplet states in the magnetic insulator TlCuCl3,” Nature 423, 62–65 (2003).
- Zapf et al. (2014) V. Zapf, M. Jaime, and C. Batista, “Bose-Einstein condensation in quantum magnets,” Rev. Mod. Phys. 86, 563–614 (2014).
- Freitas et al. (2017) R. S. Freitas, W. A. Alves, and A. Paduan-Filho, “Magnetic-field-induced ordered phase in the chloro-bridged copper(ii) dimer system ,” Phys. Rev. B 95, 184426 (2017).
- Tomonaga (1950) S. Tomonaga, “Remarks on Bloch’s method of sound waves applied to many-fermion problems,” Prog. Theor. Phys. 5, 544–569 (1950).
- Luttinger (2014) J. M. Luttinger, Luttinger Model: The First 50 Years and Some New Directions (World Scientific, 2014) pp. 3–11.
- Jeong et al. (2017) M. Jeong, H. Mayaffre, C. Berthier, D. Schmidiger, A. Zheludev, and M. Horvatić, “Magnetic-order crossover in coupled spin ladders,” Phys. Rev. Lett. 118, 167206 (2017).
- Hong et al. (2010) T. Hong, Y. H. Kim, C. Hotta, Y. Takano, G. Tremelling, M. M. Turnbull, C. P. Landee, H.-J. Kang, N. B. Christensen, K. Lefmann, K. P. Schmidt, G. S. Uhrig, and C. Broholm, “Field-induced Tomonaga-Luttinger liquid phase of a two-leg spin-1/2 ladder with strong leg interactions,” Phys. Rev. Lett. 105, 137207 (2010).
- Povarov et al. (2015) K. Yu. Povarov, D. Schmidiger, N. Reynolds, R. Bewley, and A. Zheludev, “Scaling of temporal correlations in an attractive Tomonaga-Luttinger spin liquid,” Phys. Rev. B 91, 020406(R) (2015).
- Jeong et al. (2016) M. Jeong, D. Schmidiger, H. Mayaffre, M. Klanjs̆ek, C. Berthier, W. Knafo, G. Ballon, B. Vignolle, S. Krämer, A. Zheludev, and M. Horvatić, “Dichotomy between attractive and repulsive Tomonaga-Luttinger liquids in spin ladders,” Phys. Rev. Lett. 117, 106402 (2016).
- Möller et al. (2017) J. S. Möller, T. Lancaster, S. J. Blundell, F. L. Pratt, P. J. Baker, F. Xiao, R. C. Williams, W. Hayes, M. M. Turnbull, and C. P. Landee, “Quantum-critical spin dynamics in a Tomonaga-Luttinger liquid studied with muon-spin relaxation,” Phys. Rev. B 95, 020402(R) (2017).
- Thielemann et al. (2009) B. Thielemann, Ch. Rüegg, K. Kiefer, H. M. Rønnow, B. Normand, P. Bouillot, C. Kollath, E. Orignac, R. Citro, T. Giamarchi, A. M. Läuchli, D. Biner, K. W. Krämer, F. Wolff-Fabris, V. S. Zapf, M. Jaime, J. Stahn, N. B. Christensen, B. Grenier, D. F. McMorrow, and J. Mesot, “Field-controlled magnetic order in the quantum spin-ladder system (Hpip)2CuBr4,” Phys. Rev. B 79, 020408 (2009).
- Rüegg et al. (2008) Ch. Rüegg, K. Kiefer, B. Thielemann, D. F. McMorrow, V. Zapf, B. Normand, M. B. Zvonarev, P. Bouillot, C. Kollath, T. Giamarchi, S. Capponi, D. Poilblanc, D. Biner, and K. W. Krämer, “Thermodynamics of the spin Luttinger liquid in a model ladder material,” Phys. Rev. Lett. 101, 247202 (2008).
- Orignac et al. (2007) E. Orignac, R. Citro, and T. Giamarchi, “Critical properties and Bose-Einstein condensation in dimer spin systems,” Phys. Rev. B 75, 140403 (2007).
- Willenberg et al. (2015) B. Willenberg, H. Ryll, K. Kiefer, D. A. Tennant, F. Groitl, K. Rolfs, P. Manuel, D. Khalyavin, K. C. Rule, A. U. B. Wolter, and S. Süllow, “Luttinger liquid behavior in the alternating spin-chain system copper nitrate,” Phys. Rev. B 91, 060407 (2015).
- Kim and Aronson (2013) M. S. Kim and M. C. Aronson, “Spin liquids and antiferromagnetic order in the shastry-sutherland-lattice compound ,” Phys. Rev. Lett. 110, 017201 (2013).
- Kodama et al. (2002) K. Kodama, M. Takigawa, M. Horvatić, C. Berthier, H. Kageyama, Y. Ueda, S. Miyahara, F. Becca, and F. Mila, “Magnetic superstructure in the two-dimensional quantum antiferromagnet SrCu2(BO,” Science 298, 395–399 (2002).
- Tsirlin et al. (2011a) A.A. Tsirlin, R. Nath, J. Sichelschmidt, Y. Skourski, C. Geibel, and H. Rosner, “Frustrated couplings between alternating spin- chains in AgVOAsO4,” Phys. Rev. B 83, 144412 (2011a).
- Ahmed et al. (2017) N. Ahmed, P. Khuntia, K. M. Ranjith, H. Rosner, M. Baenitz, A. A. Tsirlin, and R. Nath, “Alternating spin chain compound AgVOAsO4 probed by 75As NMR,” Phys. Rev. B 96, 224423 (2017).
- Haddad et al. (1992) A. Haddad, T. Jouini, and Y. Piffard, “Preparation and crystal structure of NaVOAsO4,” Eur. J. Solid State Inorg. Chem. 29, 57–63 (1992).
- Rodríguez-Carvajal (1993) J. Rodríguez-Carvajal, “Recent advances in magnetic structure determination by neutron powder diffraction,” Physica B: Condens. Matter 192, 55 – 69 (1993).
- Tsirlin et al. (2009) A.A. Tsirlin, B. Schmidt, Y. Skourski, R. Nath, C. Geibel, and H. Rosner, “Exploring the spin- frustrated square lattice model with high-field magnetization studies,” Phys. Rev. B 80, 132407 (2009).
- Koepernik and Eschrig (1999) K. Koepernik and H. Eschrig, “Full-potential nonorthogonal local-orbital minimum-basis band-structure scheme,” Phys. Rev. B 59, 1743–1757 (1999).
- Perdew et al. (1996) J. P. Perdew, K. Burke, and M. Ernzerhof, “Generalized gradient approximation made simple,” Phys. Rev. Lett. 77, 3865–3868 (1996).
- Nath et al. (2008a) R. Nath, A. A. Tsirlin, E. E. Kaul, M. Baenitz, N. Büttgen, C. Geibel, and H. Rosner, “Strong frustration due to competing ferromagnetic and antiferromagnetic interactions: Magnetic properties of M(VO)2(PO (M = Ca and Sr),” Phys. Rev. B 78, 024418 (2008a).
- Tsirlin and Rosner (2011) A. A. Tsirlin and H. Rosner, “Ab initio modeling of Bose-Einstein condensation in Pb2V3O9,” Phys. Rev. B 83, 064415 (2011).
- Todo and Kato (2001) S. Todo and K. Kato, “Cluster algorithms for general- quantum spin systems,” Phys. Rev. Lett. 87, 047203 (2001).
- Alet et al. (2005) F. Alet, S. Wessel, and M. Troyer, “Generalized directed loop method for quantum Monte Carlo simulations,” Phys. Rev. E 71, 036706 (2005), and references therein.
- Albuquerque et al. (2007) A.F. Albuquerque, F. Alet, P. Corboz, P. Dayal, A. Feiguin, S. Fuchs, L. Gamper, E. Gull, S. Gürtler, A. Honecker, R. Igarashi, M. Körner, A. Kozhevnikov, A. Läuchli, S.R. Manmana, M. Matsumoto, I.P. McCulloch, F. Michel, R.M. Noack, G. Pawłowski, L. Pollet, T. Pruschke, U. Schollwöck, S. Todo, S. Trebst, M. Troyer, P. Werner, and S. Wessel, “The ALPS project release 1.3: Open-source software for strongly correlated systems,” J. Magn. Magn. Mater. 310, 1187–1193 (2007).
- Hirota et al. (1994) K. Hirota, D. E. Cox, J. E. Lorenzo, G. Shirane, J. M. Tranquada, M. Hase, K. Uchinokura, H. Kojima, Y. Shibuya, and I. Tanaka, “Dimerization of CuGeO3 in the spin-Peierls state,” Phys. Rev. Lett. 73, 736–739 (1994).
- Fujii et al. (1997) Y. Fujii, H. Nakao, T. Yosihama, M. Nishi, K. Nakajima, K. Kakurai, M. Isobe, Y. Ueda, and H. Sawa, “New inorganic spin-Peierls compound NaV2O5 evidenced by x-ray and neutron scattering,” J. Phys. Soc. Jpn. 66, 326–329 (1997).
- Wallace (1998) D.C. Wallace, Thermodynamics of crystals (Dover, New York, 1998).
- Bag et al. (2018) P. Bag, P. R. Baral, and R. Nath, “Cluster spin-glass behavior and memory effect in Cr0.5Fe0.5Ga,” Phys. Rev. B (Submitted) (2018).
- Arjun et al. (2017) U. Arjun, V. Kumar, P. K. Anjana, A. Thirumurugan, J. Sichelschmidt, A. V. Mahajan, and R. Nath, “Singlet ground state in the spin- weakly coupled dimer compound NH4[(V2O(4,4’-bpy)2(H2PO4)(POH2O,” Phys. Rev. B 95, 174421 (2017).
- Johnston et al. (2000) D. C. Johnston, R. K. Kremer, M. Troyer, X. Wang, A. Klümper, S. L. Bud’ko, A. F. Panchula, and P. C. Canfield, “Thermodynamics of spin antiferromagnetic uniform and alternating-exchange Heisenberg chains,” Phys. Rev. B 61, 9558–9606 (2000).
- Sachdev and Damle (1997) S. Sachdev and K. Damle, “Low temperature spin diffusion in the one-dimensional quantum nonlinear model,” Phys. Rev. Lett. 78, 943–946 (1997).
- Yogi et al. (2015) A. Yogi, N. Ahmed, R. Nath, A. A. Tsirlin, S. Kundu, A. V. Mahajan, J. Sichelschmidt, B. Roy, and Y. Furukawa, “Antiferromagnetism of Zn2VO(PO and the dilution with Ti4+,” Phys. Rev. B 91, 024413 (2015).
- Curro (2009) N.J. Curro, “Nuclear magnetic resonance in the heavy fermion superconductors,” Rep. Prog. Phys. 72, 026502 (2009).
- Slichter (1992) C. P. Slichter, Principle of Nuclear Magnetic Resonance, 3rd ed. (Springer, New York, 1992).
- Grafe et al. (2008) H.-J. Grafe, D. Paar, G. Lang, N. J. Curro, G. Behr, J. Werner, J. Hamann-Borrero, C. Hess, N. Leps, R. Klingeler, and B. Büchner, “ NMR studies of superconducting LaFeAsO0.9F0.1,” Phys. Rev. Lett. 101, 047003 (2008).
- Fagot-Revurat et al. (2000) Y. Fagot-Revurat, M. Mehring, and R. K. Kremer, “Charge-order-driven spin-Peierls transition in -NaV2O5,” Phys. Rev. Lett. 84, 4176–4179 (2000).
- Nath et al. (2005) R. Nath, A. V. Mahajan, N. Büttgen, C. Kegler, A. Loidl, and J. Bobroff, “Study of one-dimensional nature of (Sr,Ba)2Cu(PO and BaCuP2O7 via NMR,” Phys. Rev. B 71, 174436 (2005).
- Nath et al. (2008b) R. Nath, D. Kasinathan, H. Rosner, M. Baenitz, and C. Geibel, “Electronic and magnetic properties of K2CuP2O7: A model Heisenberg chain system,” Phys. Rev. B 77, 134451 (2008b).
- Note (1) Note that from the high-field magnetization, the critical field of the gap closing is T, and the corresponding zero-field spin gap is K. Since the 75As NMR measurements were carried out in the field of 6.8 T, the spin gap will be reduced. The reduction is estimated as K. Thus, from 75As NMR at 6.8 T one should observe a spin gap of K, assuming the linear field dependence of .
- Damle and Sachdev (1998) K. Damle and S. Sachdev, “Spin dynamics and transport in gapped one-dimensional Heisenberg antiferromagnets at nonzero temperatures,” Phys. Rev. B 57, 8307–8339 (1998).
- Taniguchi et al. (1995) S. Taniguchi, T. Nishikawa, Y. Yasui, Y. Kobayashi, M. Sato, T. Nishioka, M. Kontani, and K. Sano, “Spin gap behavior of quasi-two-dimensional system CaV4O9,” J. Phys. Soc. Jpn. 64, 2758–2761 (1995).
- Moriya (1956) Tôru Moriya, “Nuclear magnetic relaxation in antiferromagnetics,” Progr. Theor. Phys. 16, 23–44 (1956).
- Gordon and Hoch (1978) M.I. Gordon and M.J.R. Hoch, “Quadrupolar spin-lattice relaxation in solids,” J. Phys. C: Solid State Phys. 11, 783 (1978).
- Simmons et al. (1962) W. W. Simmons, W. J. O’Sullivan, and W. A. Robinson, “Nuclear spin-lattice relaxation in dilute paramagnetic sapphire,” Phys. Rev. 127, 1168–1178 (1962).
- Nath et al. (2009) R. Nath, Y. Furukawa, F. Borsa, E. E. Kaul, M. Baenitz, C. Geibel, and D. C. Johnston, “Single-crystal NMR studies of the frustrated square-lattice compound Pb2VO(PO,” Phys. Rev. B 80, 214430 (2009).
- Ranjith et al. (2015) K. M. Ranjith, M. Majumder, M. Baenitz, A. A. Tsirlin, and R. Nath, “Frustrated three-dimensional antiferromagnet Li2CuW2O8: NMR and the effect of nonmagnetic dilution,” Phys. Rev. B 92, 024422 (2015).
- Mukhopadhyay et al. (2012) S. Mukhopadhyay, M. Klanjšek, M. S. Grbić, R. Blinder, H. Mayaffre, C. Berthier, M. Horvatić, M. A. Continentino, A. Paduan-Filho, B. Chiari, and O. Piovesana, “Quantum-critical spin dynamics in quasi-one-dimensional antiferromagnets,” Phys. Rev. Lett. 109, 177206 (2012).
- Xiang et al. (2011) H. J. Xiang, E. J. Kan, S.-H. Wei, M.-H. Whangbo, and X. G. Gong, “Predicting the spin-lattice order of frustrated systems from first principles,” Phys. Rev. B 84, 224429 (2011).
- Tsirlin et al. (2011b) A. A. Tsirlin, O. Janson, and H. Rosner, “Unusual ferromagnetic superexchange in CdVO3: The role of Cd,” Phys. Rev. B 84, 144429 (2011b).
- Tsirlin et al. (2008) A. A. Tsirlin, R. Nath, C. Geibel, and H. Rosner, “Magnetic properties of Ag2VOP2O7: An unexpected spin dimer system,” Phys. Rev. B 77, 104436 (2008).
- Tsirlin and Rosner (2009) A. A. Tsirlin and H. Rosner, “Extension of the spin-1/2 frustrated square lattice model: The case of layered vanadium phosphates,” Phys. Rev. B 79, 214417 (2009).
- Note (2) Similar to Ref. \rev@citealpTsirlin144412, we perform simulations for a 2D array of alternating spin chains uniformly coupled by an effective interchain coupling . The actual 3D spin lattice of NaVOAsO4 is frustrated and thus not amenable to QMC simulations.