(230.2285) Fiber devices and optical amplifiers; (140.3615) Lasers, ytterbium; (160.5690) Rare-earth-doped materials; (120.4530) Optical constants.
A novel method for measuring the resonant absorption coefficient of rare-earth-doped optical fibers
Abstract
A non-destructive method for measuring the resonant absorption coefficient of rare-earth-doped optical fibers is introduced. It can be applied to a broad range of fiber designs and host materials. The method compares the side-collected spontaneous emission at two arbitrary locations along the fiber as a function of the pump wavelength to extract the absorption coefficient. It provides an attractive and accurate alternative to other available techniques. In particular, the proposed method is superior to the cut-back method, which destroys the sample and is prone to inaccuracies due to the cladding mode contamination. Moreover, because it does not involve any mechanical movement, it can be used for fragile optical fibers.
1 Introduction
Fiber lasers and amplifiers are widely adopted in industry and scientific research because of their high power, good beam quality, and ease of operation [1, 2]. In order to design and optimize fiber lasers and amplifiers, it is essential to know the geometrical and optical properties of the optical fiber gain medium to a high degree of accuracy [3, 4, 5, 6]. Such characteristics may be considerably different from those anticipated from the fiber preform and can be altered during the fiber drawing process. Therefore, it is important to accurately measure these characteristics directly in the fiber. An important property of a rare-earth-doped optical fiber is the resonant absorption coefficient , which can be determined from the dopant density and the absorption cross section . However, is strongly dependent on the host glass, which can be affected during the preform fabrication and drawing. The dopant density profile can also be modified during the fiber drawing because of diffusion; therefore, it is imperative to determine directly using the optical fiber.
In this work, we present a novel method that can be used to accurately determine in the presence of rare-earth ions in an optical fiber at all relevant wavelengths. The method is based on analyzing the emitted side-light, which contains both fluorescence and pump scattering at different locations along the fiber. It is a universal technique that can be applied to single-mode, multi-mode, large-mode-area, photonic crystal, and double-clad rare-earth-doped optical fibers. It is also applicable to fibers made from different materials such as ZBLAN, silica, or chalcogenides. Because the method does not involve the movement of any mechanical or optical components during the measurement process, it can be readily applied to fragile fibers [7], including highly tapered fibers [8].
The presented method is an alternative to the cut-back method, which is widely used to measure the absorption coefficient of optical fibers [9]. In the cut-back method, the output power from the fiber is measured by gradually cutting back the fiber from the end and reducing its length [9]. The cut-back method is destructive; therefore, it cannot be employed in experiments that need to be performed on a single piece of optical fiber. In a sensitive experiment, e.g. for laser cooling, even a slight sample-to-sample variation can affect the outcome; therefore, two pieces of the same fiber may not perform the same way and must be characterized individually [10, 11, 12]. Another issue involves the excitation of the cladding modes that contaminate the cut-back measurements in short pieces of the fiber [13]. Moreover, in the cut-back measurements of highly absorbing rare-earth-doped optical fibers, because the core must be pumped well below the saturation intensity, the output signal can be quite weak and even comparable to the cladding power contamination. Finally, the cut-back method involves undesirable mechanical processing such as cleaving, polishing, and inspecting the fiber that at best can be quite elaborate, and in cases involving fragile fibers totally impractical.
We already mentioned that our proposed method is highly advantageous for characterizing fibers for laser cooling. In a similar context, the accurate determination of is essential for designing radiation-balanced lasers (RBLs) [14, 15, 16, 17, 18, 19, 20, 21, 22, 23, 24]. RBLs have been proposed as a way to mitigate the thermal issues in high-power fiber lasers, which have hindered the progress in power-scaling because of the thermally induced transverse mode instability [25, 26, 27, 28, 29]. RBLs operate based on the fluorescence cooling principle, in which the rare-earth-doped optical fiber is pumped at a wavelength, which is higher than the mean fluorescence wavelength of the active ions; therefore, the anti-Stokes fluorescence removes some of the excess heat [14]. In RBLs, the heat generated due to the quantum defect, parasitic background absorption of the pump and laser, and the non-radiative relaxation of the excited rare-earth ions is balanced against the fluorescence cooling. RBLs pose stringent requirements on the types and levels of dopants, as well as the host materials. In particular, the parasitic background absorption () must be quite small for RBLs to work. Our proposed method, when combined with the laser-induced temperature modulation spectrum (LITMoS) test developed in Sheik-Bahae’s research group [12], allows us to also accurately determine for the doped fiber and the cooling efficiency of rare-earth doped fibers [10, 11].
2 Theory
We refer to this new technique as “measuring the absorption coefficient via side-light analysis” (MACSLA). This method is based on the fact that when a rare-earth doped optical fiber is pumped far below the saturation intensity, the spontaneous emission power emitted from the side of the fiber is directly proportional to the pump power. The method compares the side-collected spontaneous emission at two arbitrary locations along the fiber as a function of the pump wavelength and employs the McCumber theory [30] to extract the spectral form of the absorption coefficient.
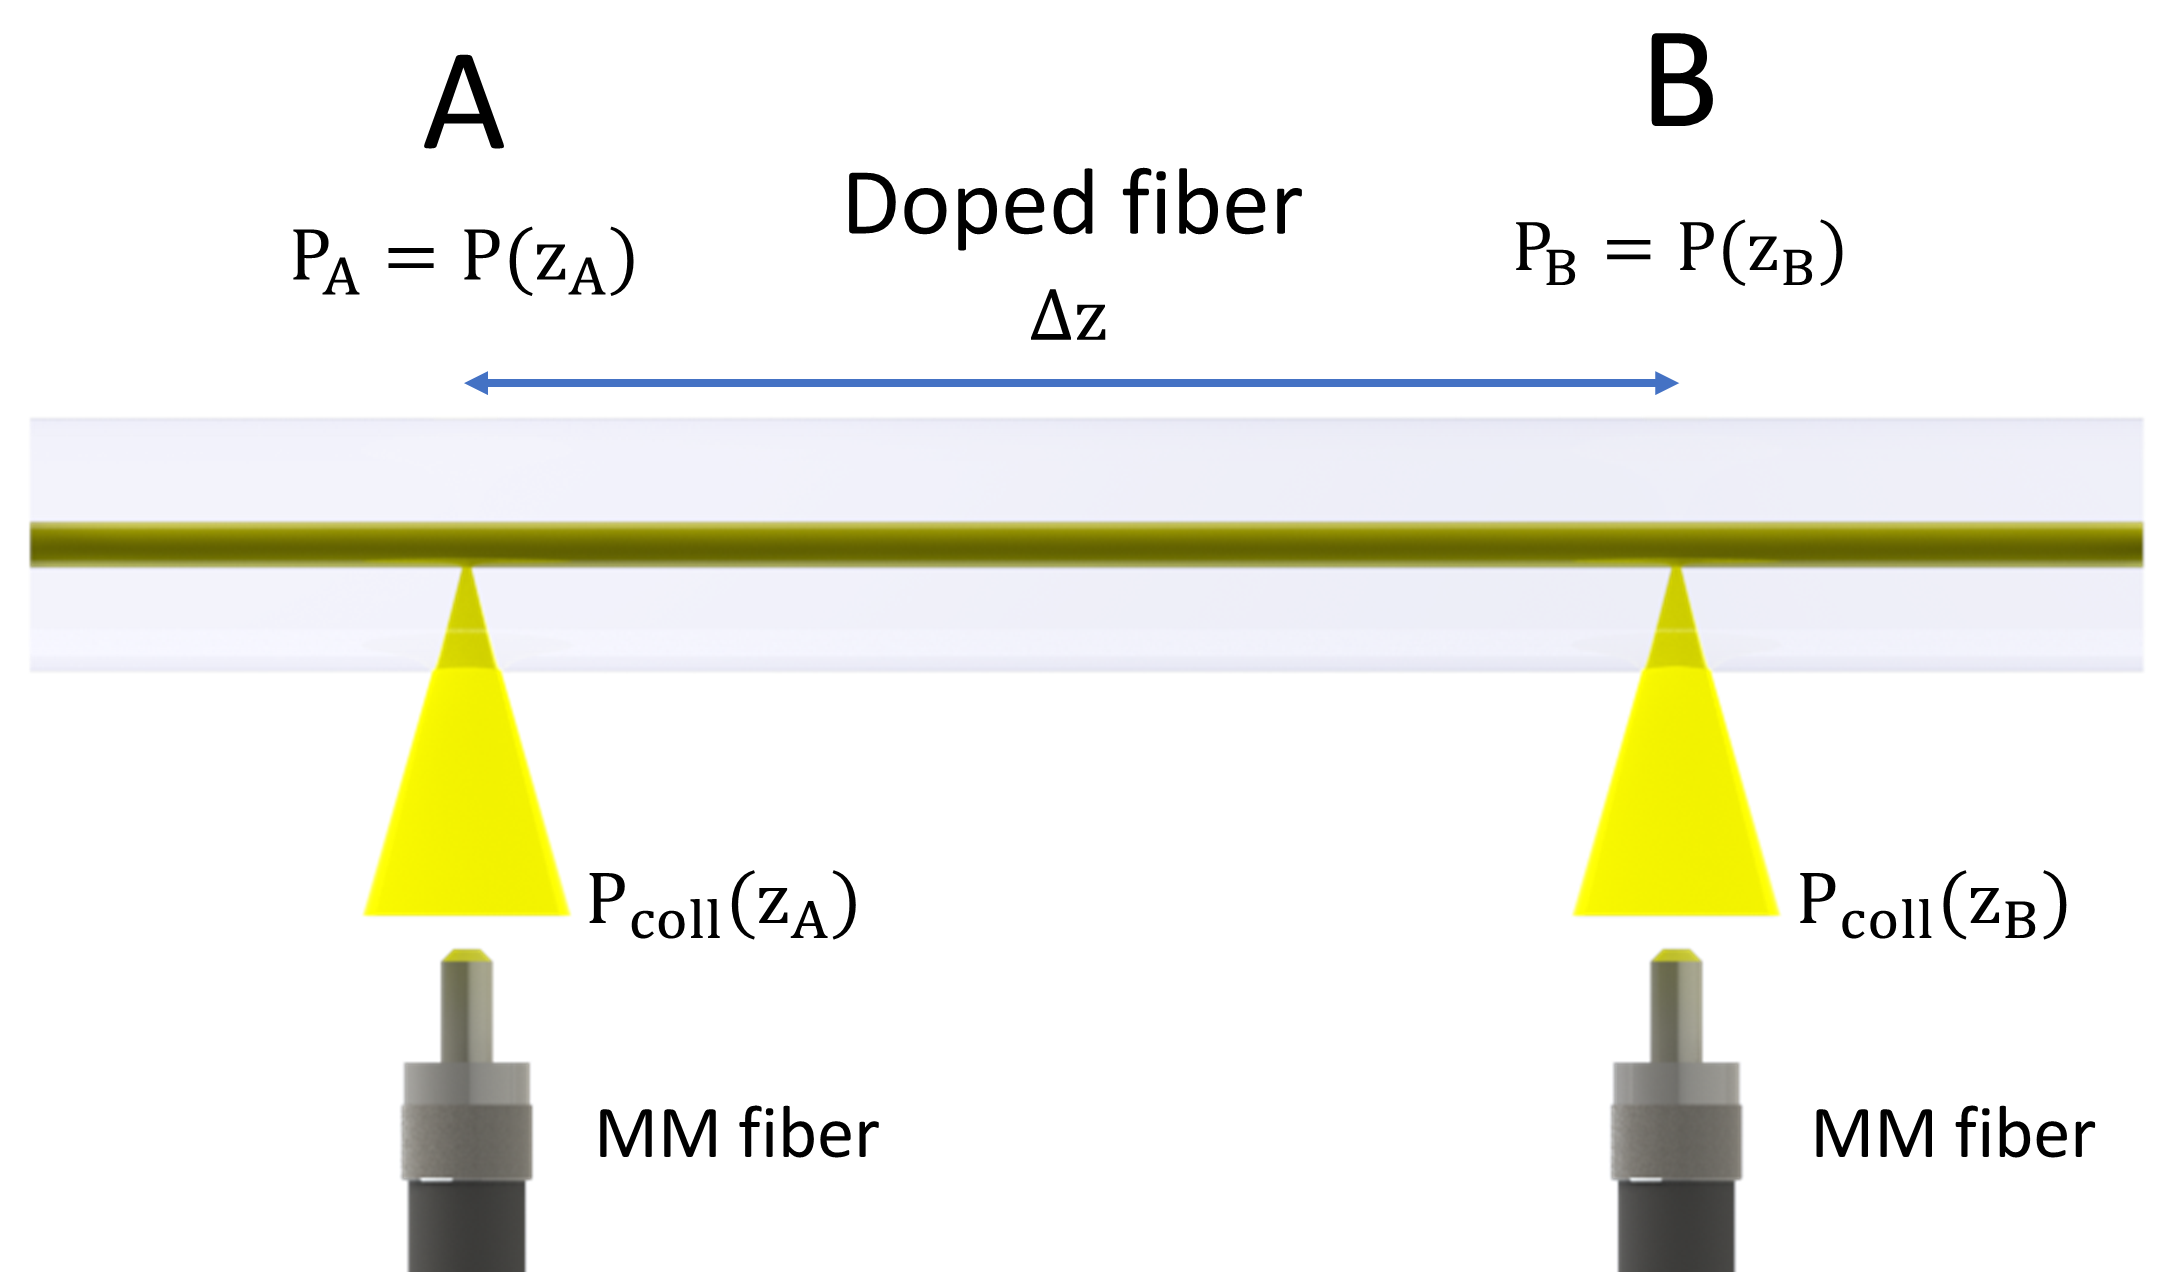
Figure 1 shows a schematic of the proposed method. The pump propagates through the core of the optical fiber from left to right. The pump wavelength is assumed to be in the proximity of the peak absorption wavelength such that is much larger than . The pump intensity in the fiber core is assumed to be far below the saturation intensity; therefore, the pump power propagating in the core, , attenuates exponentially due to the absorption by the rare-earth dopants:
| (1) |
where is input pump power in the core at .
The side-emitted spontaneous emission power is collected by two large-core high-numerical-aperture multimode optical fibers at points A and B along the fiber, which are separated by a distance . The collection points A and B and their distance remain unchanged through the experiment. The collection efficiencies of the two multimode fibers may be slightly different due to inevitable misalignments. Therefore, we can write
| (2a) | ||||
| (2b) | ||||
where and are the collected powers at points A and B, respectively. and are coefficients that relate the propagating power in the core to the collected spontaneous emission power, which also incorporate the coupling efficiencies to the multimode fibers at points A and B, respectively. We now divide Eq. 2b by Eq. 2a, take the natural logarithm of both sides, and obtain:
| (3) |
where
| (4) |
In Eq. 3, follows a strict spectral function of the form (see Appendix A):
| (5) |
where is the emission power spectral density measured by the optical spectrum analyzer, is the Planck constant, is the Boltzmann constant, and is the speed of light in vacuum. We also assume that the ratio is wavelength independent over the narrow range of wavelengths used in this experiment. Therefore, the left-side in Eq. 3, , must also follow the spectral form in Eq. 5 when the pump wavelength is varied. Because the spectral shape of is obtained from Eq. 5, all that is needed is to find its overall magnitude by balancing the left-side and right-side in Eq. 3 over the respective wavelengths. Therefore, we replace in Eq. 3 with , where is the absorption coefficient normalized to its peak value, . This way, we can determine both and through a fitting procedure that involves measurements of and at multiple wavelengths near the peak absorption wavelength.
3 Experiment
In our experiment, we used a commercial Yb-doped optical fiber (SM-YSF-LO-HP, Nufern, Inc.) to demonstrate the utility of the MACSLA method. SM-YSF-LO-HP is a low-doped Yb-silica single-mode and single-clad optical fiber. As we mentioned in the previous section, in order to use the Beer-Lambert exponential decay form in Eq. 1, the pump intensity must be kept considerably below the saturation intensity. As such, we first measured the pump saturation power () by pumping the core of the doped fiber () and measuring the side spontaneous emission power () for different values of the pump power at 976 nm wavelength. The measurements were fitted to the functional form of the saturated power in a doped fiber [31]
| (6) |
For our fiber, the saturation power was determined to be 966 µW. In our later experiments, was kept below 5% of the saturation power to make sure that Eq. 1 could be reasonably applied (see Appendix B).
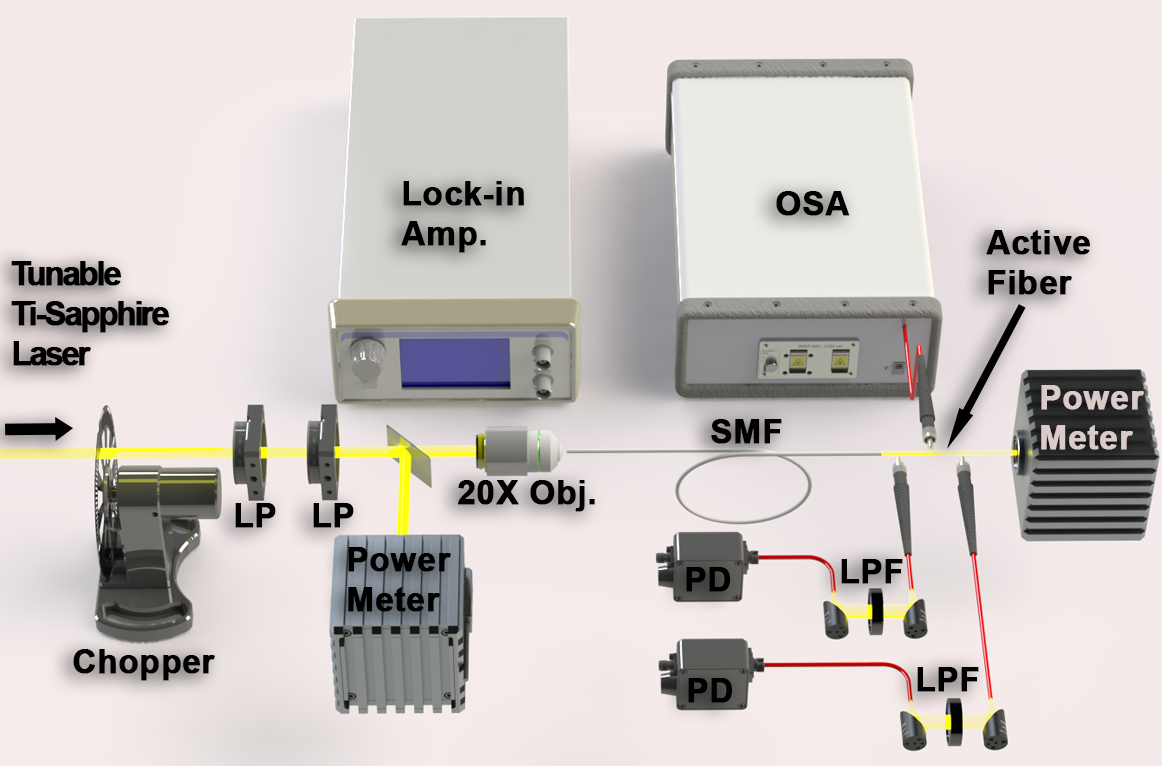
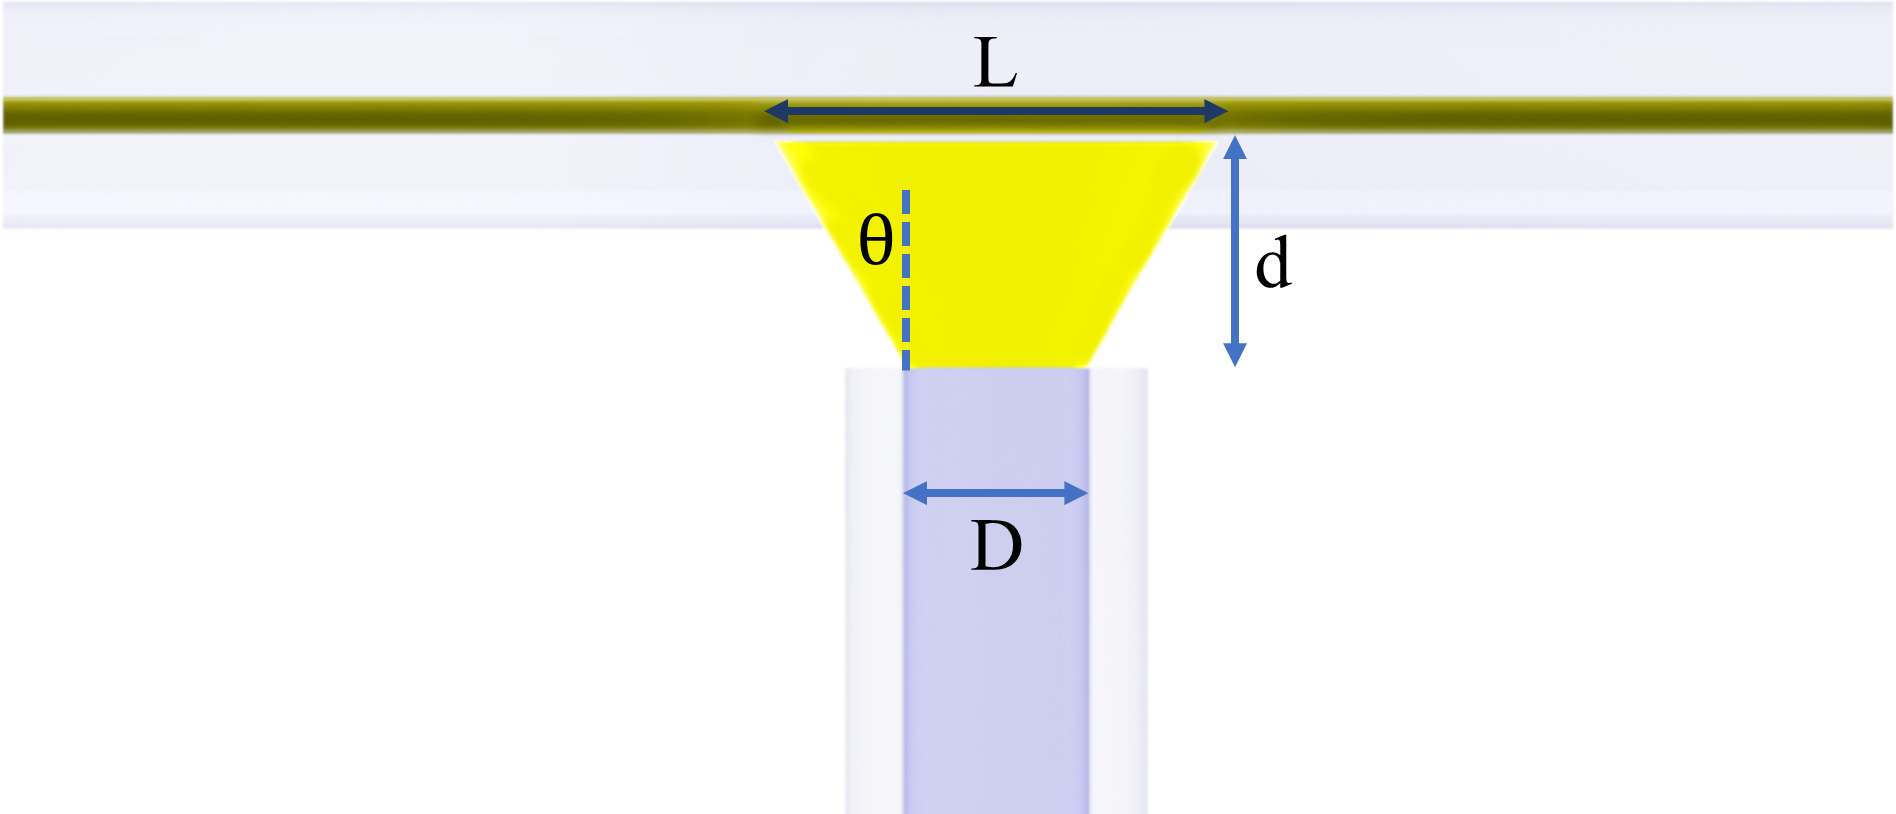
The experimental setup that is used in MACSLA for measuring the absorption coefficient is shown in Fig. 2. The fiber was pumped by a tunable continuous-wave (CW) Ti:Sapphire laser and the side spontaneous emission power was collected at points A and B using two multimode fibers (M124L02, Thorlabs, Inc.), which were connected to InGaAs Detectors (DET08CFC, Thorlabs, Inc.). Long-pass filters (1µm) were placed between the multimode fibers and the detectors in order to ensure that scattered pump does not contaminate the fluorescence signal. The distance between points A and B, , must be substantially larger than the typical length of the Yb-doped fiber segment, , from which the side spontaneous emission is collected by each light-collecting multimode fiber. This is to ensure that the collection segment can be considered a point for all practical purposes relative to . The length of the fiber segment is approximately given by
| (7) |
where is the diameter of the core of the multimode fiber, is the distance between the input tip of the light-collecting multimode fiber and the core-cladding interface of the Yb-doped fiber, is the maximum acceptance angle of the light-collecting multimode fiber, and is the numerical aperture of the light-collecting multimode fiber, as shown in Fig. 3. Using typical values for our experiment in Eq. 7, one concludes that is on the order of 0.5mm and is required. Here, we have used µm, , and µm, including approximately 40µm of gap between the cladding of the doped fiber and the tip of the light-collecting multimode fiber. In our experiments, the light-collecting multimode fibers nearly touched the cladding of the Yb-doped fiber, so was comparable to the radius of the Yb-doped fiber. At the same time, must be sufficiently large to allow for a distinct nontrivial collected power ratio in the form of , while it must be small enough to ensure that the signal to noise ratio at point B is not much different from that of point A, because the signal drops exponentially with . For our experiment, we chose , which satisfied all these constraints.
The detectors were connected to a lock-in amplifier that was used to extract the weak spontaneous emission signal from the noisy background. In order to use the lock-in amplifier, the pump was modulated at 1 KHz with a commercial chopper. Two linear polarizers were used to attenuate the pump power and keep the core power far below the saturation. A beam-splitter and a power-meter were used to measure the input power, and another power-meter was placed at the end of the doped fiber to monitor the output power as a secondary check to make sure that the fiber core power remained far below saturation throughout the experiment. The pump power was coupled to a passive single-mode fiber by a 20X microscope objective, and the single-mode fiber was fusion-spliced to the doped fiber to deliver the pump power. As the pump wavelength is varied, the input pump power changes slightly; however, the MACSLA method relies only on the power ratios collected at points A and B and is not affected by such power variations.
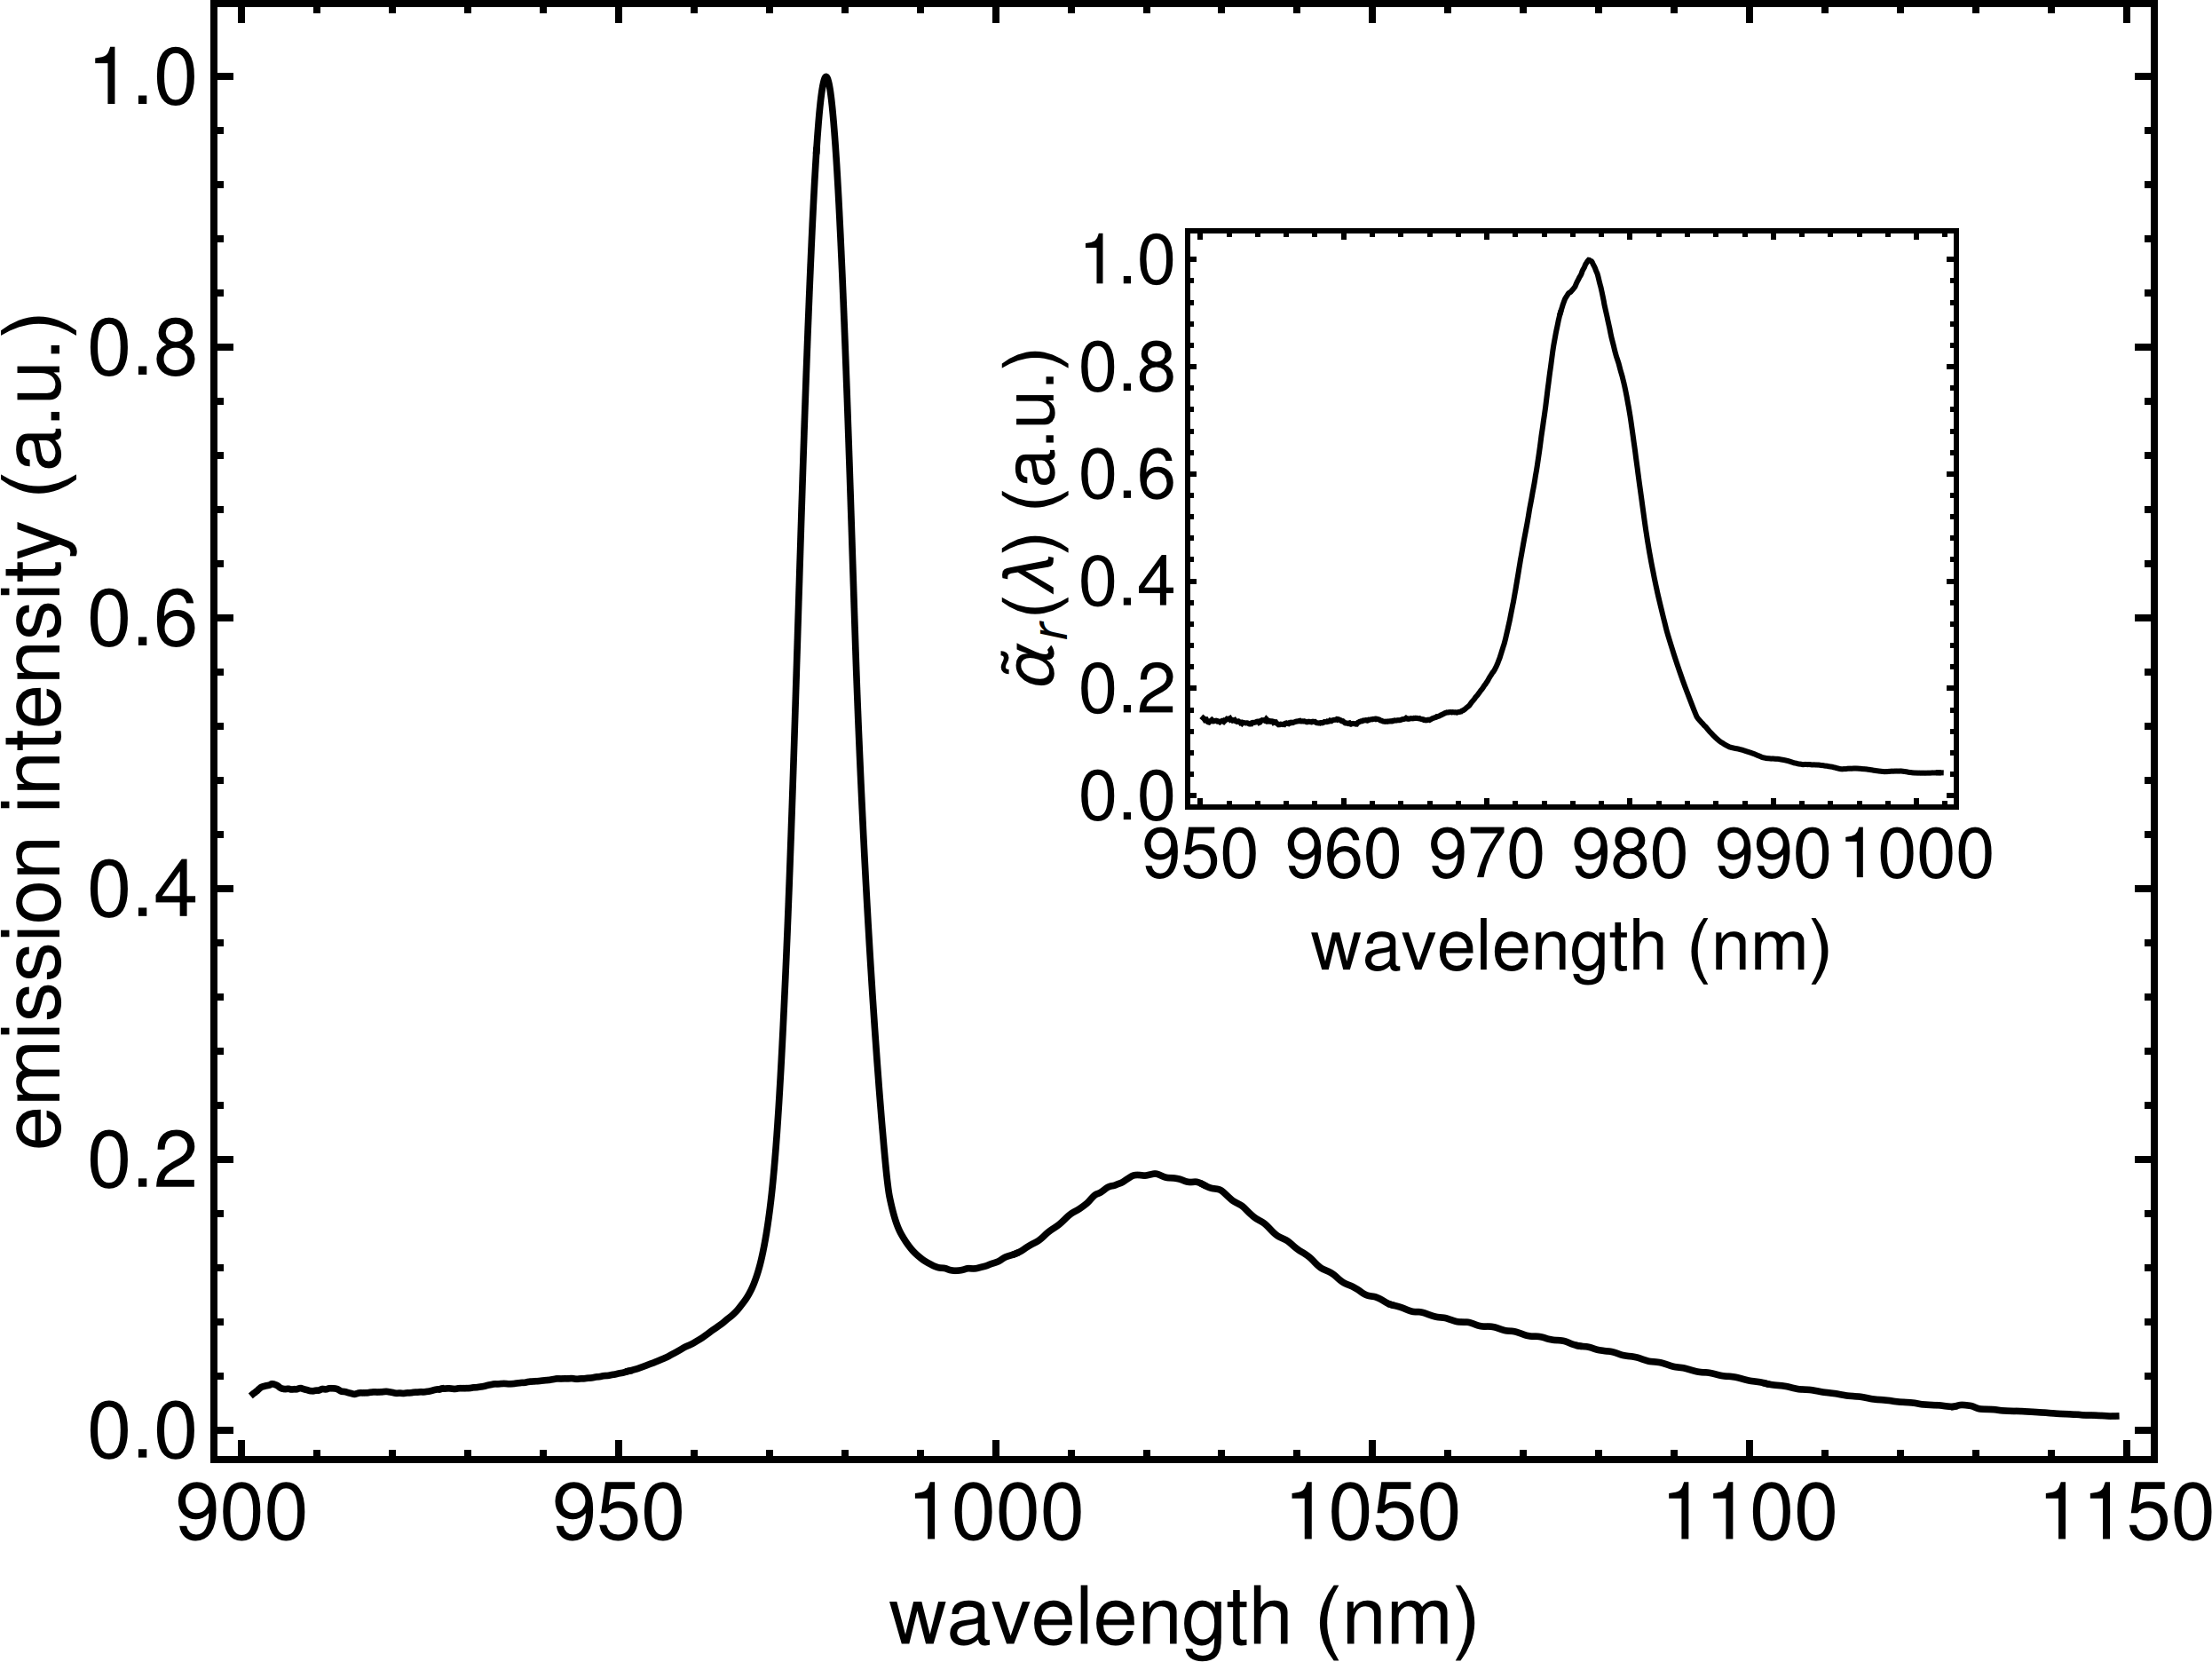
For the fitting procedure, we chose seven different pump wavelengths near the absorption peak wavelength for the Yb-silica fiber ( = 977 nm) by tuning the operating wavelength of the CW Ti:Sapphire laser. For each wavelength, the emission signal power was measured at positions A and B over sufficient time windows until the desired signal-to-noise-ratio was achieved and the error-bars were obtained from the lock-in amplifier. The distance between points A and B was also measured by a digital caliper. The power spectral density of the Yb-silica fiber is shown in Fig. 4. The inset shows the resonant absorption coefficient, which is normalized to its peak value, and is calculated by using the McCumber theory [30].
4 Results and Discussion
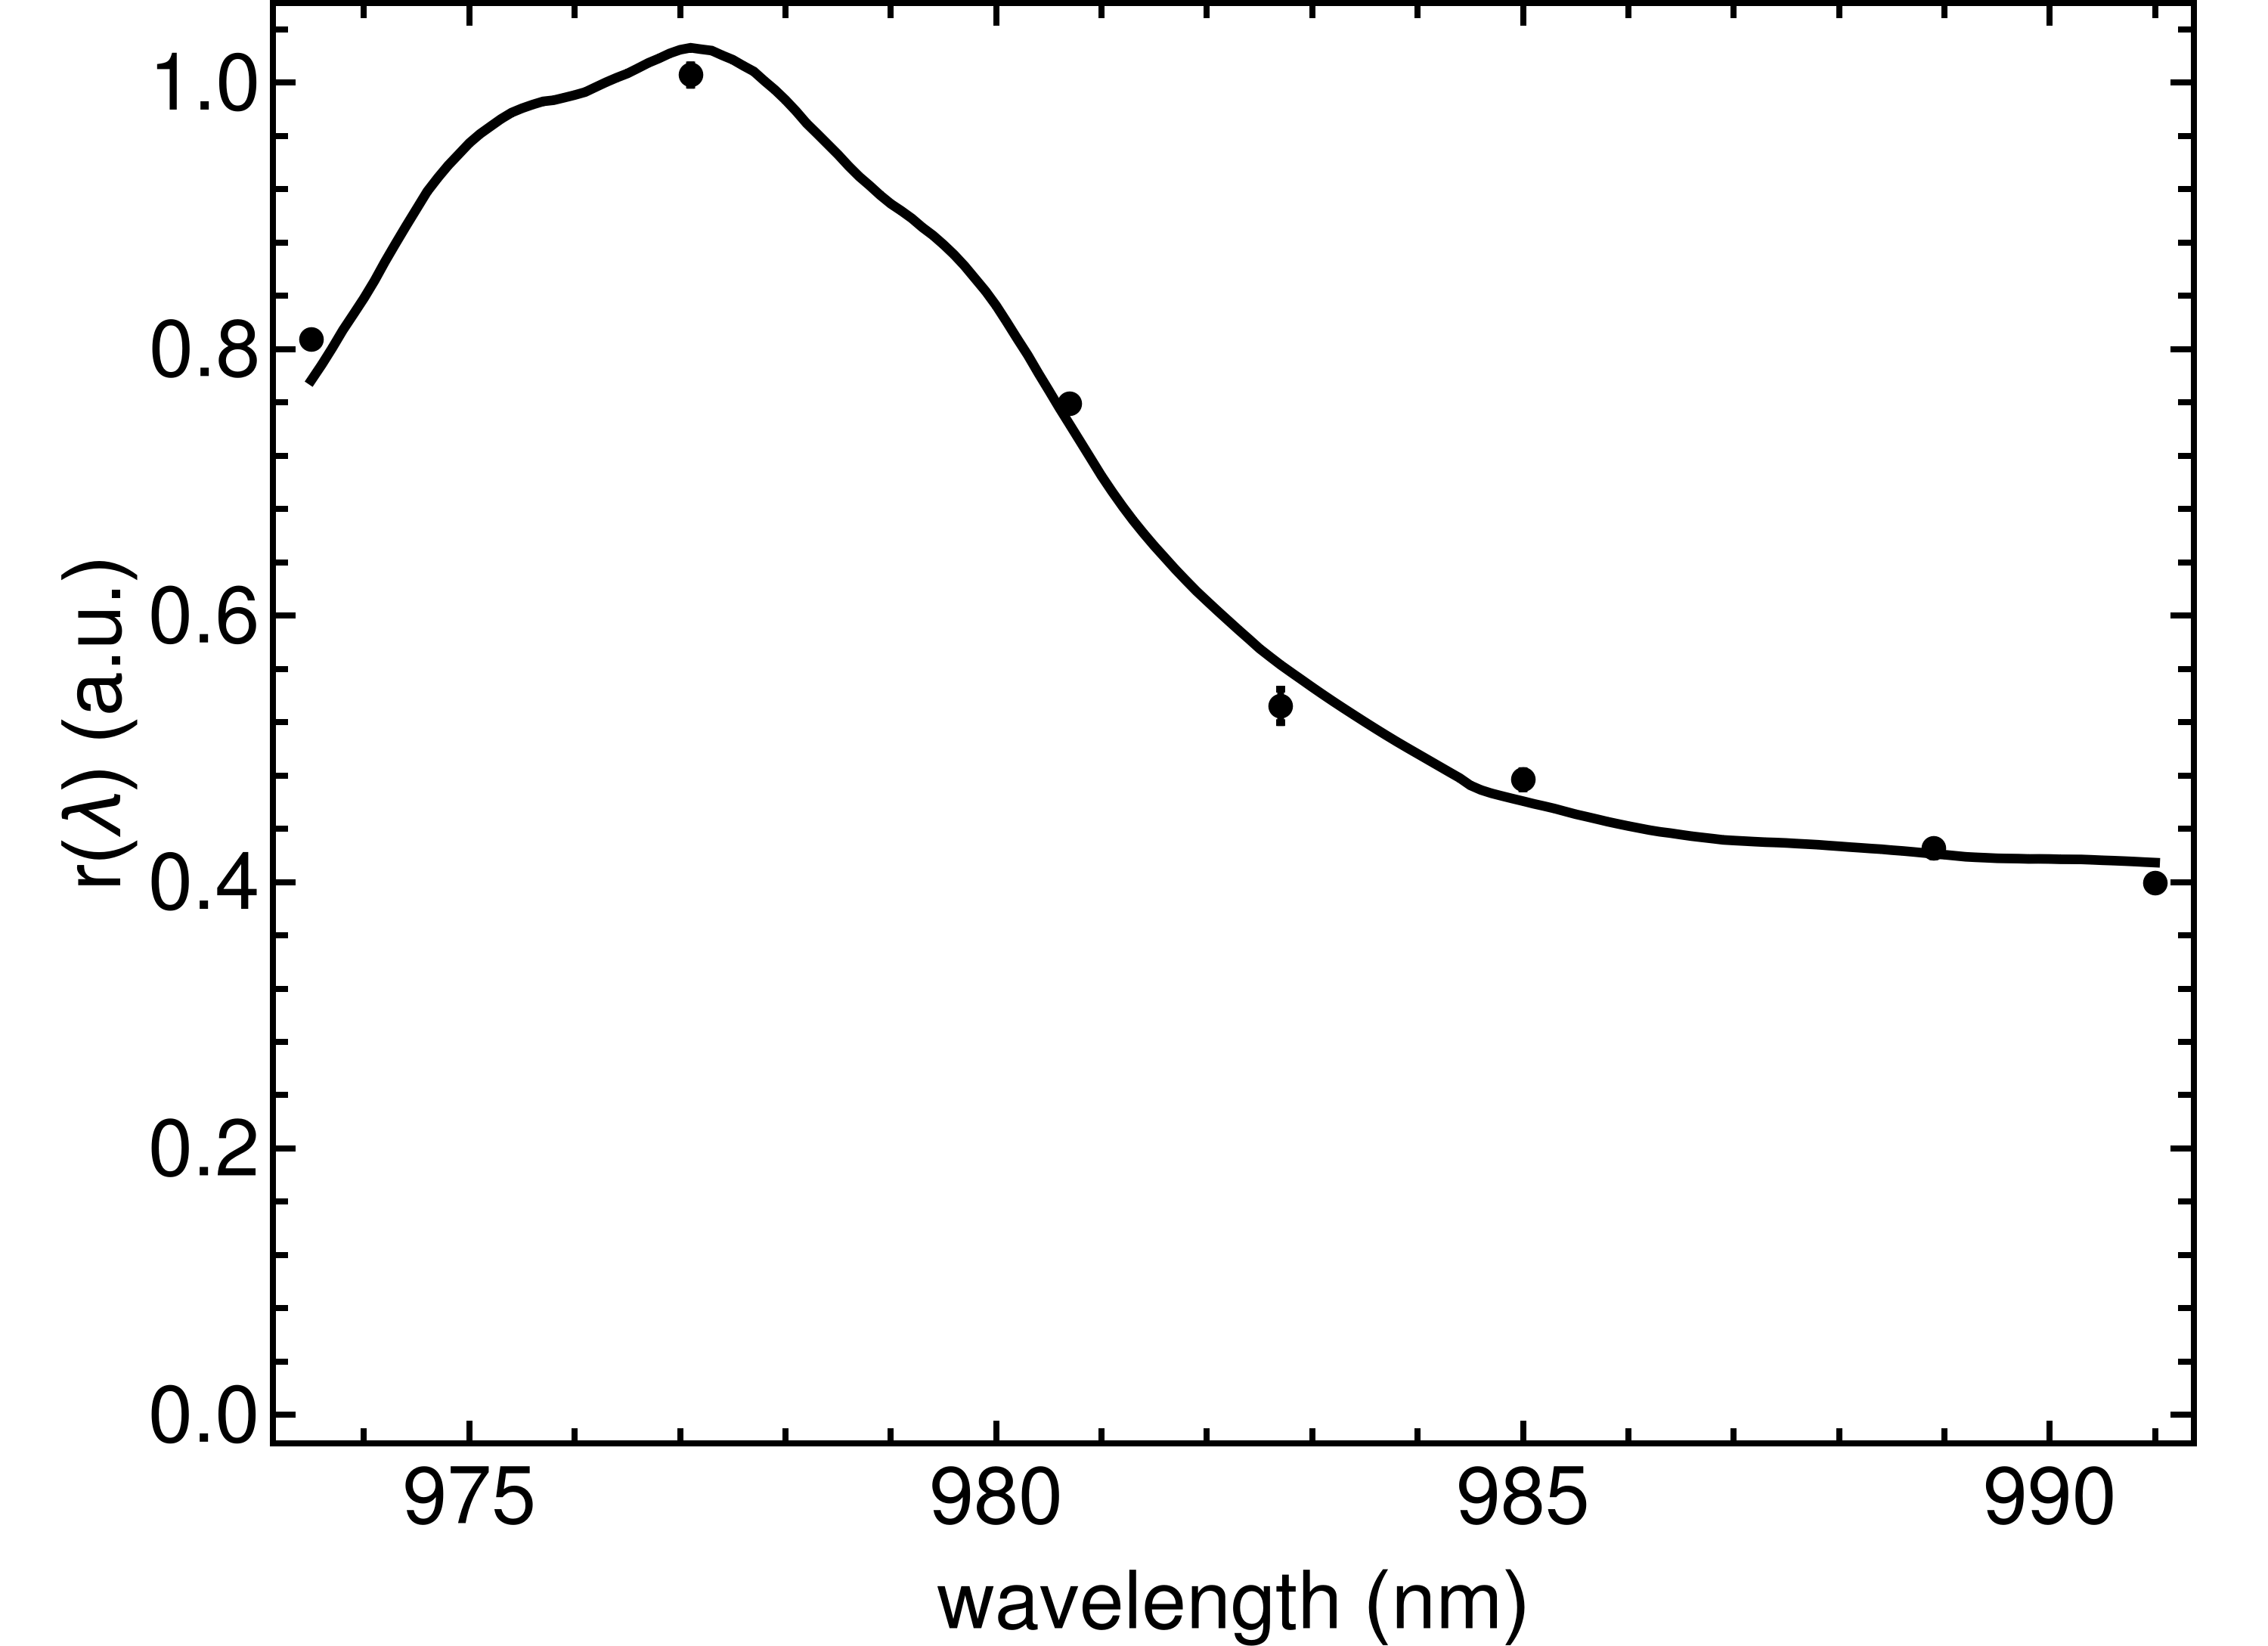
The fitted line over the experimental measurements related to Eq. 3 are shown in Fig. 5. The points (with error-bars) indicate the values of measured at seven different wavelengths, and the fitting curve comes directly from the resonant absorption spectrum shown as the inset in Fig. 4. The outcome of the fitting procedure was the peak value of the resonant absorption coefficient . While unimportant to the procedure, the fitting also resulted in . Our result for should be compared with the value reported by the vendor, which is . We also performed the cut-back as a point of comparison for measuring the peak value of the resonant absorption coefficient. We used the CW Ti:Sapphire laser as the pump operating at the peak resonant absorption wavelength of the Yb-doped fiber and coupled its output using an objective lens to a 50 segment of a passive single-mode fiber (HP-980, Nufern), while the other end the single-mode fiber was fusion-spliced to the Yb-doped fiber.
The intermediate step of using a passive single-mode fiber to couple light to the Yb-doped fiber provided two main advantages: first, it reduced the amount of pump coupling to the cladding modes of the gain fiber for enhanced accuracy; and second, it allowed for the inevitable moving and bending as a result of the incremental cleaving of the gain fiber without having to worry about the fiber alignment to the pump. We also applied index matching gel on the cladding of the Yb-doped fiber to reduced cladding light contamination of our measurement. Our careful cut-back method measurement of the peak value of the resonant absorption coefficient resulted in , which is closer to the value provided by the MACSLA method (see also Appendix B for potential corrections to the result from MACSLA). While the experimental results reported here are for a single segment of the Yb-doped silica fiber, we performed the same procedure on a segment of a Yb-doped ZBLAN fiber and the results came in agreement with those reported by the vendor. We also note that the results are insensitive to the actual value of –while we reported in our experiment simply because that was the value we measured after placing the collection fibers, the results would have been as good if we chose other values such as .
We would like to comment on a recent pioneering method proposed by Min Oh, et al. [32], where they also employ the side-light analysis to measure . In their procedure, the doped fiber is pumped at a fixed wavelength and the spontaneous emission is measured at different positions along the fiber by using an optical spectrometer. They measure at the respective wavelength by fitting the side-collected power to the Beer-Lambert exponential decay form in Eq. 1. In their method, the coupling efficiency to the side-collecting fiber is assumed to remain unchanged at different locations along the doped fiber. This assumption is likely to result in measurement inaccuracies if the gain fiber is single-mode with a small core. The fitting to the Beer-Lambert exponential decay form necessitates mechanical movement to obtain measurements at multiple points; therefore, optical alignment may become an issue and it will be hard to maintain a uniform coupling efficiency to the side-collecting fiber at all points. Moreover, the requirement to keep the pump power far below the saturation power, which is on the order of 1 mW in single-mode fibers, necessitates high-sensitivity spectrometers for adequate signal-to-noise-ratio.
5 Summary and Conclusion
In summary, the MACSLA method provides an attractive and accurate alternative to other techniques for measuring the resonant absorption coefficient in rare-earth-doped optical fibers. In particular, it is superior to the cut-back method, which destroys the sample and is prone to inaccuracies due to the cladding mode contamination. When combined with the LITMoS test [12, 33], the MACSLA method allows one to also determine the parasitic background absorption coefficient (). In laser cooling experiments and RBLs, the cooling efficiency is improved by reducing the ratio of background absorption coefficient to the resonant absorption coefficient () [12, 10, 11, 34, 35, 36, 33]. Our techniques enables an accurate determination of that is essential to design and interpret such fluorescence cooling experiments.
One of the main advantages of the MACSLA method is the fact that it does not require precise alignments, which makes it suitable for commercial applications. Moreover, the technique does not require an accurate knowledge of the actual coupled power into the medium, hence one is not worried about surface reflections and scatterings. In practice, the lock-in amplifier may not be required if one uses a high-sensitivity detector such as a low threshold avalanche photodiode. We verified this in a separate measurement for a multimode Yb-doped optical fiber, where the side-collected spontaneous emission signal was stronger than that of a single-mode Yb-doped fiber due to a higher value of pump power. Finally, we would like to emphasize that while the MACSLA method is used to extract the peak value of the resonant absorption coefficient, when combined with the emission power spectral density , which is measured by the optical spectrum analyzer as in Fig. 4, provides a full characterization of the resonant absorption coefficient at all relevant wavelengths and is not limited to the vicinity of the pump wavelength.
Appendix A
In this Appendix, we would like to justify the form of Eq. 5. We start with the McCumber theory, which relates the absorption cross section () and emission cross section () of dopants in solid-state media [30]:
| (8) |
is the frequency of light, and is the so-called “zero-line” energy. The emission cross section can be formally obtained from [37]:
| (9) |
where the is the Einstein A-coefficient, is the normalized lineshape function, is the free space wavelength, and is the refractive index of the medium. The resonant absorption coefficient, , can be expressed as
| (10) |
where () is the population density of the lower (upper) manifold of the dopant ions, and is the dopant ion number density. The approximation in the right hand side of Eq. 10 holds when the gain material is pumped well below the saturation intensity such that and . The observed spectral florescence intensity, , is given by [37]:
| (11) |
where is the emission power spectral density, previously introduced in the main part of the manuscript, and the rightmost part of Eq. 11 comes from noting that . Combining Eqs. 8–11, we obtain
| (12) |
where the wavelength-dependent part gives Eq. 5.
Appendix B
In this Appendix, we estimate the impact of the finite ratio of the to on our results. In the low emission signal limit, which is valid in our setup, the pump propagation is described by
| (13) |
where . The formal solution to Eq. 13 is given by
| (14) |
where is the Lambert W-function (product logarithm function) defined as the principal solution for in . The zeroth order term in Taylor expansion of Eq. 14 in gives Eq. 1.
If we calculate from Eq. 4 and keep terms to the first order of Taylor expansion in , we obtain
| (15) | ||||
The actual expansion parameter for the correction term in Eq. 15 relative to Eq. 3 is the ratio of , due to the fact that is the input power to the fiber but is the power at the first point of spectral measurement. Employing the fitting procedure using Eq. 15 with gives the peak value of the absorption coefficient at , which must be compared with obtained from fitting with Eq. 3, which is a 4% correction. Such an upward correction is understandable because the increase in the denominator in Eq. 13 due to a finite value of must be compensated by an increase in the numerator in the form of rescaling to a larger value.
Funding Information
This material is based upon work supported by the Air Force Office of Scientific Research under award number FA9550-16-1-0362 titled Multidisciplinary Approaches to Radiation Balanced Lasers (MARBLE).
Acknowledgment
The authors would like to thank M. Sheik-Bahae, R. I. Epstein, and A. R. Albrecht for illuminating discussions.
References
- [1] D. Richardson, J. Nilsson, and W. Clarkson, “High power fiber lasers: current status and future perspectives,” JOSA B 27, B63–B92 (2010).
- [2] M. N. Zervas and C. A. Codemard, “High power fiber lasers: a review,” IEEE Journal of selected topics in Quantum Electronics 20, 219–241 (2014).
- [3] D. Kouznetsov and J. V. Moloney, “Efficiency of pump absorption in double-clad fiber amplifiers. iii. calculation of modes,” JOSA B 19, 1304–1309 (2002).
- [4] E. Yahel and A. Hardy, “Modeling high-power Er3+-Yb3+ codoped fiber lasers,” J. Lightwave Technol. 21, 2044 (2003).
- [5] A. Mafi, J. V. Moloney, D. Kouznetsov, A. Schulzgen, S. Jiang, T. Luo, and N. Peyghambarian, “A large-core compact high-power single-mode photonic crystal fiber laser,” IEEE Photonics Technology Letters 16, 2595–2597 (2004).
- [6] E. Yahel, O. Hess, and A. A. Hardy, “Modeling and optimization of high-power Nd3+-Yb3+ codoped fiber lasers,” J. Lightwave Technol. 24, 1601 (2006).
- [7] X. Zhu and N. Peyghambarian, “High-power zblan glass fiber lasers: review and prospect,” Advances in OptoElectronics 2010, 501956 (2010).
- [8] J. Kerttula, V. Filippov, Y. Chamorovskii, V. Ustimchik, K. Golant, and O. G. Okhotnikov, “Principles and performance of tapered fiber lasers: from uniform to flared geometry,” Appl. Opt. 51, 7025–7038 (2012).
- [9] H. Pask, R. J. Carman, D. C. Hanna, A. C. Tropper, C. J. Mackechnie, P. R. Barber, and J. M. Dawes, “Ytterbium-doped silica fiber lasers: versatile sources for the 1-1.2 region,” IEEE Journal of Selected Topics in Quantum Electronics 1, 2–13 (1995).
- [10] C. Mungan, M. Buchwald, B. Edwards, R. Epstein, and T. Gosnell, “Laser cooling of a solid by 16 k starting from room temperature,” Physical review letters 78, 1030 (1997).
- [11] T. Gosnell, “Laser cooling of a solid by 65 k starting from room temperature,” Optics Letters 24, 1041–1043 (1999).
- [12] S. Melgaard, D. Seletskiy, V. Polyak, Y. Asmerom, and M. Sheik-Bahae, “Identification of parasitic losses in yb: Ylf and prospects for optical refrigeration down to 80k,” Optics Express 22, 7756–7764 (2014).
- [13] L. Yao, T. Birks, and J. C. Knight, “Low bend loss in tightly-bent fibers through adiabatic bend transitions,” Optics express 17, 2962–2967 (2009).
- [14] S. R. Bowman, “Lasers without internal heat generation,” IEEE journal of quantum electronics 35, 115–122 (1999).
- [15] S. Bowman, “Radiation balanced lasers,” in “Advanced Solid State Lasers,” (Optical Society of America, 1999), p. MA6.
- [16] G. Nemova and R. Kashyap, “Athermal continuous-wave fiber amplifier,” Optics Communications 282, 2571–2575 (2009).
- [17] G. Nemova and R. Kashyap, “Radiation-balanced amplifier with two pumps and a single system of ions,” J. Opt. Soc. Am. B 28, 2191–2194 (2011).
- [18] S. R. Bowman, S. P. O’Connor, S. Biswal, N. J. Condon, and A. Rosenberg, “Minimizing heat generation in solid-state lasers,” IEEE Journal of Quantum Electronics 46, 1076–1085 (2010).
- [19] S. R. Bowman, “Low quantum defect laser performance,” Optical Engineering 56, 011104 (2016).
- [20] M. Peysokhan and A. Mafi, “Minimizing heat generation by radiative cooling in a ytterbium-doped silica fiber laser,” in “Frontiers in Optics,” (Optical Society of America, 2017), pp. JTu3A–106.
- [21] Z. Yang, A. R. Albrecht, J. Meng, and M. Sheik-Bahae, “Radiation balanced thin disk lasers,” in “CLEO: Science and Innovations,” (Optical Society of America, 2018), pp. SM4N–5.
- [22] E. Mobini, M. Peysokhan, B. Abaie, and A. Mafi, “Thermal modeling, heat mitigation, and radiative cooling for double-clad fiber amplifiers,” JOSA B 35, 2484–2493 (2018).
- [23] E. Mobini, M. Peysokhan, B. Abaie, and A. Mafi, “Radiation balanced ytterbium-doped silica double-clad fiber amplifier,” in “Frontiers in Optics,” (Optical Society of America, 2018), pp. JW3A–134.
- [24] J. M. Knall, M. Esmaeelpour, and M. J. F. Digonnet, “Model of anti-stokes fluorescence cooling in a single-mode optical fiber,” Journal of Lightwave Technology 36, 4752–4760 (2018).
- [25] D. C. Brown and H. J. Hoffman, “Thermal, stress, and thermo-optic effects in high average power double-clad silica fiber lasers,” IEEE Journal of quantum electronics 37, 207–217 (2001).
- [26] L. Li, H. Li, T. Qiu, V. L. Temyanko, M. M. Morrell, A. Schülzgen, A. Mafi, J. V. Moloney, and N. Peyghambarian, “3-dimensional thermal analysis and active cooling of short-length high-power fiber lasers,” Opt. Express 13, 3420–3428 (2005).
- [27] T. Eidam, C. Wirth, C. Jauregui, F. Stutzki, F. Jansen, H.-J. Otto, O. Schmidt, T. Schreiber, J. Limpert, and A. Tünnermann, “Experimental observations of the threshold-like onset of mode instabilities in high power fiber amplifiers,” Optics express 19, 13218–13224 (2011).
- [28] B. Ward, C. Robin, and I. Dajani, “Origin of thermal modal instabilities in large mode area fiber amplifiers,” Optics Express 20, 11407–11422 (2012).
- [29] C. Jauregui, T. Eidam, H.-J. Otto, F. Stutzki, F. Jansen, J. Limpert, and A. Tünnermann, “Physical origin of mode instabilities in high-power fiber laser systems,” Optics express 20, 12912–12925 (2012).
- [30] D. McCumber, “Einstein relations connecting broadband emission and absorption spectra,” Physical Review 136, A954 (1964).
- [31] H. Zech, “Measurement technique for the quotient of cross sections of erbium-doped fibers,” IEEE Photonics Technology Letters 7, 986–988 (1995).
- [32] M. Oh, J. Yi, U. Seo, H. Lee, H. Cho, M. Hwang, and K. Kim, “Measurement of the absorption coefficient of Yb-doped fibers by a side light analysis,” New Physics: Sae Mulli 67, 499–503 (2017).
- [33] M. Peysokhan, B. Abaie, E. Mobini, S. Rostami, and A. Mafi, “Measuring quantum efficiency and background absorption of an ytterbium-doped zblan fiber,” in “CLEO: Applications and Technology,” (Optical Society of America, 2018), pp. JW2A–118.
- [34] E. Mobini, M. Peysokhan, B. Abaie, and A. Mafi, “Laser cooling investigation of a single-mode Yb-doped ZBLAN optical fiber,” in “Frontiers in Optics,” (Optical Society of America, 2017), pp. JTu3A–8.
- [35] E. Mobini, M. Peysokhan, B. Abaie, and A. Mafi, “Investigation of solid state laser cooling in ytterbium-doped silica fibers,” in “CLEO: QELS_Fundamental Science,” (Optical Society of America, 2018), pp. FF3E–4.
- [36] J. Knall, M. Esmaeelpour, and M. Digonnet, “Model of anti-stokes cooling in a Yb-doped fiber,” in “Optical and Electronic Cooling of Solids III,” , vol. 10550 (International Society for Optics and Photonics, 2018), vol. 10550, p. 105500K.
- [37] B. E. A. Saleh and M. C. Teich, “Fundamentals of Photonics, 2nd edition,” (Wiley, Hoboken, NJ, 2007).