Wigner solids of wide quantum wells near Landau filling
Abstract
Microwave spectroscopy within the Landau filling () range of the integer quantum Hall effect (IQHE) has revealed pinning mode resonances signifying Wigner solids (WSs) composed of quasi-particles or -holes. We study pinning modes of WSs in wide quantum wells (WQWs) for , varying the density, , and tilting the sample by angle in the magnetic field. Three distinct WS phases are accessed. One phase, S1, is phenomenologically the same as the WS observed in the IQHEs of narrow QWs. The second phase, S2, exists at further from than S1, and requires a sufficiently large or , implying S2 is stabilized by the Zeeman energy. The melting temperatures of S1 and S2, estimated from the disappearance of the pinning mode, show different behavior vs . At the largest or , S2 disappears and the third phase, S1A, replaces S1, also exhibiting a pinning mode. This occurs as the WQW IQHE becomes a two-component, Halperin-Laughlin state. We interpret S1A as a WS of the excitations of , which has not been previously observed.
I Introduction
At the extremes of low temperature and high applied magnetic field, two-dimensional electron systems (2DESs) exhibit a vast array of phenomena. Among the most prominent of these are the quantum Hall effects that can occur at integer (IQHE) and fractional (FQHE) values of the Landau level filling factor, where is the carrier density and is the perpendicular component of the magnetic field, and is the total magnetic field. At the large termination of the FQHE series, the kinetic energy of the 2DES is frozen out, and the preferred ground state is a Wigner solid (WS),(Lozovik and Yudson, 1975; Lam and Girvin, 1984; Andrei et al., 1988; Goldman et al., 1990; Jiang et al., 1990; Williams et al., 1991; Shayegan, 1997; Yang et al., 2001; Archer et al., 2013; Rhim et al., 2015; Deng et al., 2016) which is insulating due to pinning by residual disorder. In single-layer, n-type 2DESs, this termination occurs for . Additionally, WSs have been observed within IQHEs by microwave spectroscopy,(Chen et al., 2003; Lewis et al., 2004; Zhu et al., 2010a) NMR,(Tiemann et al., 2014) and tunneling spectroscopy.(Jang et al., 2017) IQHE WSs are composed of an effectively dilute concentration of quasi-particles or quasi-holes that crystallize in the presence of a filled Landau level within the range of IQHE plateau, though not exactly at integer .
Microwave spectroscopy is of value for the study of WSs because these phases exhibit a characteristic microwave or rf resonance. (Andrei et al., 1988; Williams et al., 1991; Chen et al., 2003, 2004; Lewis et al., 2004; Zhu et al., 2010b, a; Wang et al., 2012; Hatke et al., 2014, 2015, 2017) The resonance is understood as a pinning mode, in which the solid oscillates within the disorder potential. This paper will describe the behavior of the pinning modes of multiple solid phases Liu et al. (2012, 2014); Hatke et al. (2014) found in the neighborhood of the IQHE around in GaAs wide quantum wells (WQWs). Pinning resonances in narrower quantum wells, where only one subband is occupied, were observed within IQHEs some time ago.Chen et al. (2003) The resonances are absent at exactly , but as moves away from in either direction they develop and exhibit a maximum in intensity and sharpness, and disappear for farther than about from . The peak frequency, , is largest for closest to , and decreases monotonically as moves away from . We refer to the solid that gives rise to the resonances seen in narrower wells as S1.
In the WQWs that concern us in this paper, there is evidence from dc transport Liu et al. (2012, 2014) and from earlier microwave spectroscopyHatke et al. (2014) that an additional solid, which we call S2, can form under certain conditions on either side of at further away from than S1. Reference Liu et al., 2014 showed that FQHEs for several on either side of exhibited spin state transitions, which appeared at particular Zeeman energies, , at which the FQHE was suppressed. For sufficient to produce the FQHE transitions at or a reentrant integer quantum Hall effect Liu et al. (2012) (RIQHE) appeared around the fractional filling. The RIQHE is a signature of insulating behavior in the partially filled Landau level. The range of the RQIHE is not contiguous with the IQHE centered at , but still has Hall resistance quantized at and vanishing dc longitudinal resistance. Reference Liu et al., 2014 ascribes the (or ) FQHE in the WQW to a mixed state of different two-flux composite fermionJain (2007) (2CF) -levels (analogous to Landau levels). Here the lower -level is spin up on both sides of the spin transition and the upper -level changes from spin down to spin up. The emergence of the RIQHE was associated with a fully spin-polarized 2CF Wigner solid.Archer and Jain (2011); Archer et al. (2013); Rhim et al. (2015)
The microwave spectroscopic studies on the same systemHatke et al. (2014) showed that at even higher density () relative to the spin transition (hence higher ), a microwave resonance was present well outside the normal range of the pinning modes of the IQHE centered at , and at relatively higher peak frequency, . The -region of enhanced was taken as a signature of S2 of which the RIQHE was a precursor seen in dc transport at lower and farther from . In all cases S2 gave way to S1 as got close enough to , and the pinning mode gave evidence of a solid-solid transition from S2 to S1 as was approached.
In this paper we systematically study the evolution of the pinning mode resonance around in a WQW by investigating the role of , in situ sample rotation, and temperature. At relatively low and small tilt angle () we observe a resonance that can be associated with S1. With increase of either or , (hence total magnetic field and ) S2 is observed as well, characterized by an enhanced- region that occurs farther from . Upon increasing , starting from low without S2 present, S2 first sets in for , at low (higher , far from ), then sets in for , again at low (in this case near ). This is consistent with an stabilizing S2, and we find that at all and , S2 sets in for roughly constant in units of the Coulomb energy. The temperature dependence is different for the two solids, consistent with the two solids being made up of different types of carriers such as different flux-number CFs. Near the large and limits of our studies S2 again disappears; this occurs as the IQHE state becomes the two-component Halperin-Laughlin state. (Eisenstein et al., 1992; Murphy et al., 1994; Lay et al., 1994; Mueed et al., 2016) The remaining resonance, which is found close to like the S1 resonance, is then a pinning mode of WS of the quasi-particles or -holes of the state. We denote this solid, for which the present paper provides the first evidence, as S1A.
II Experimental Methods
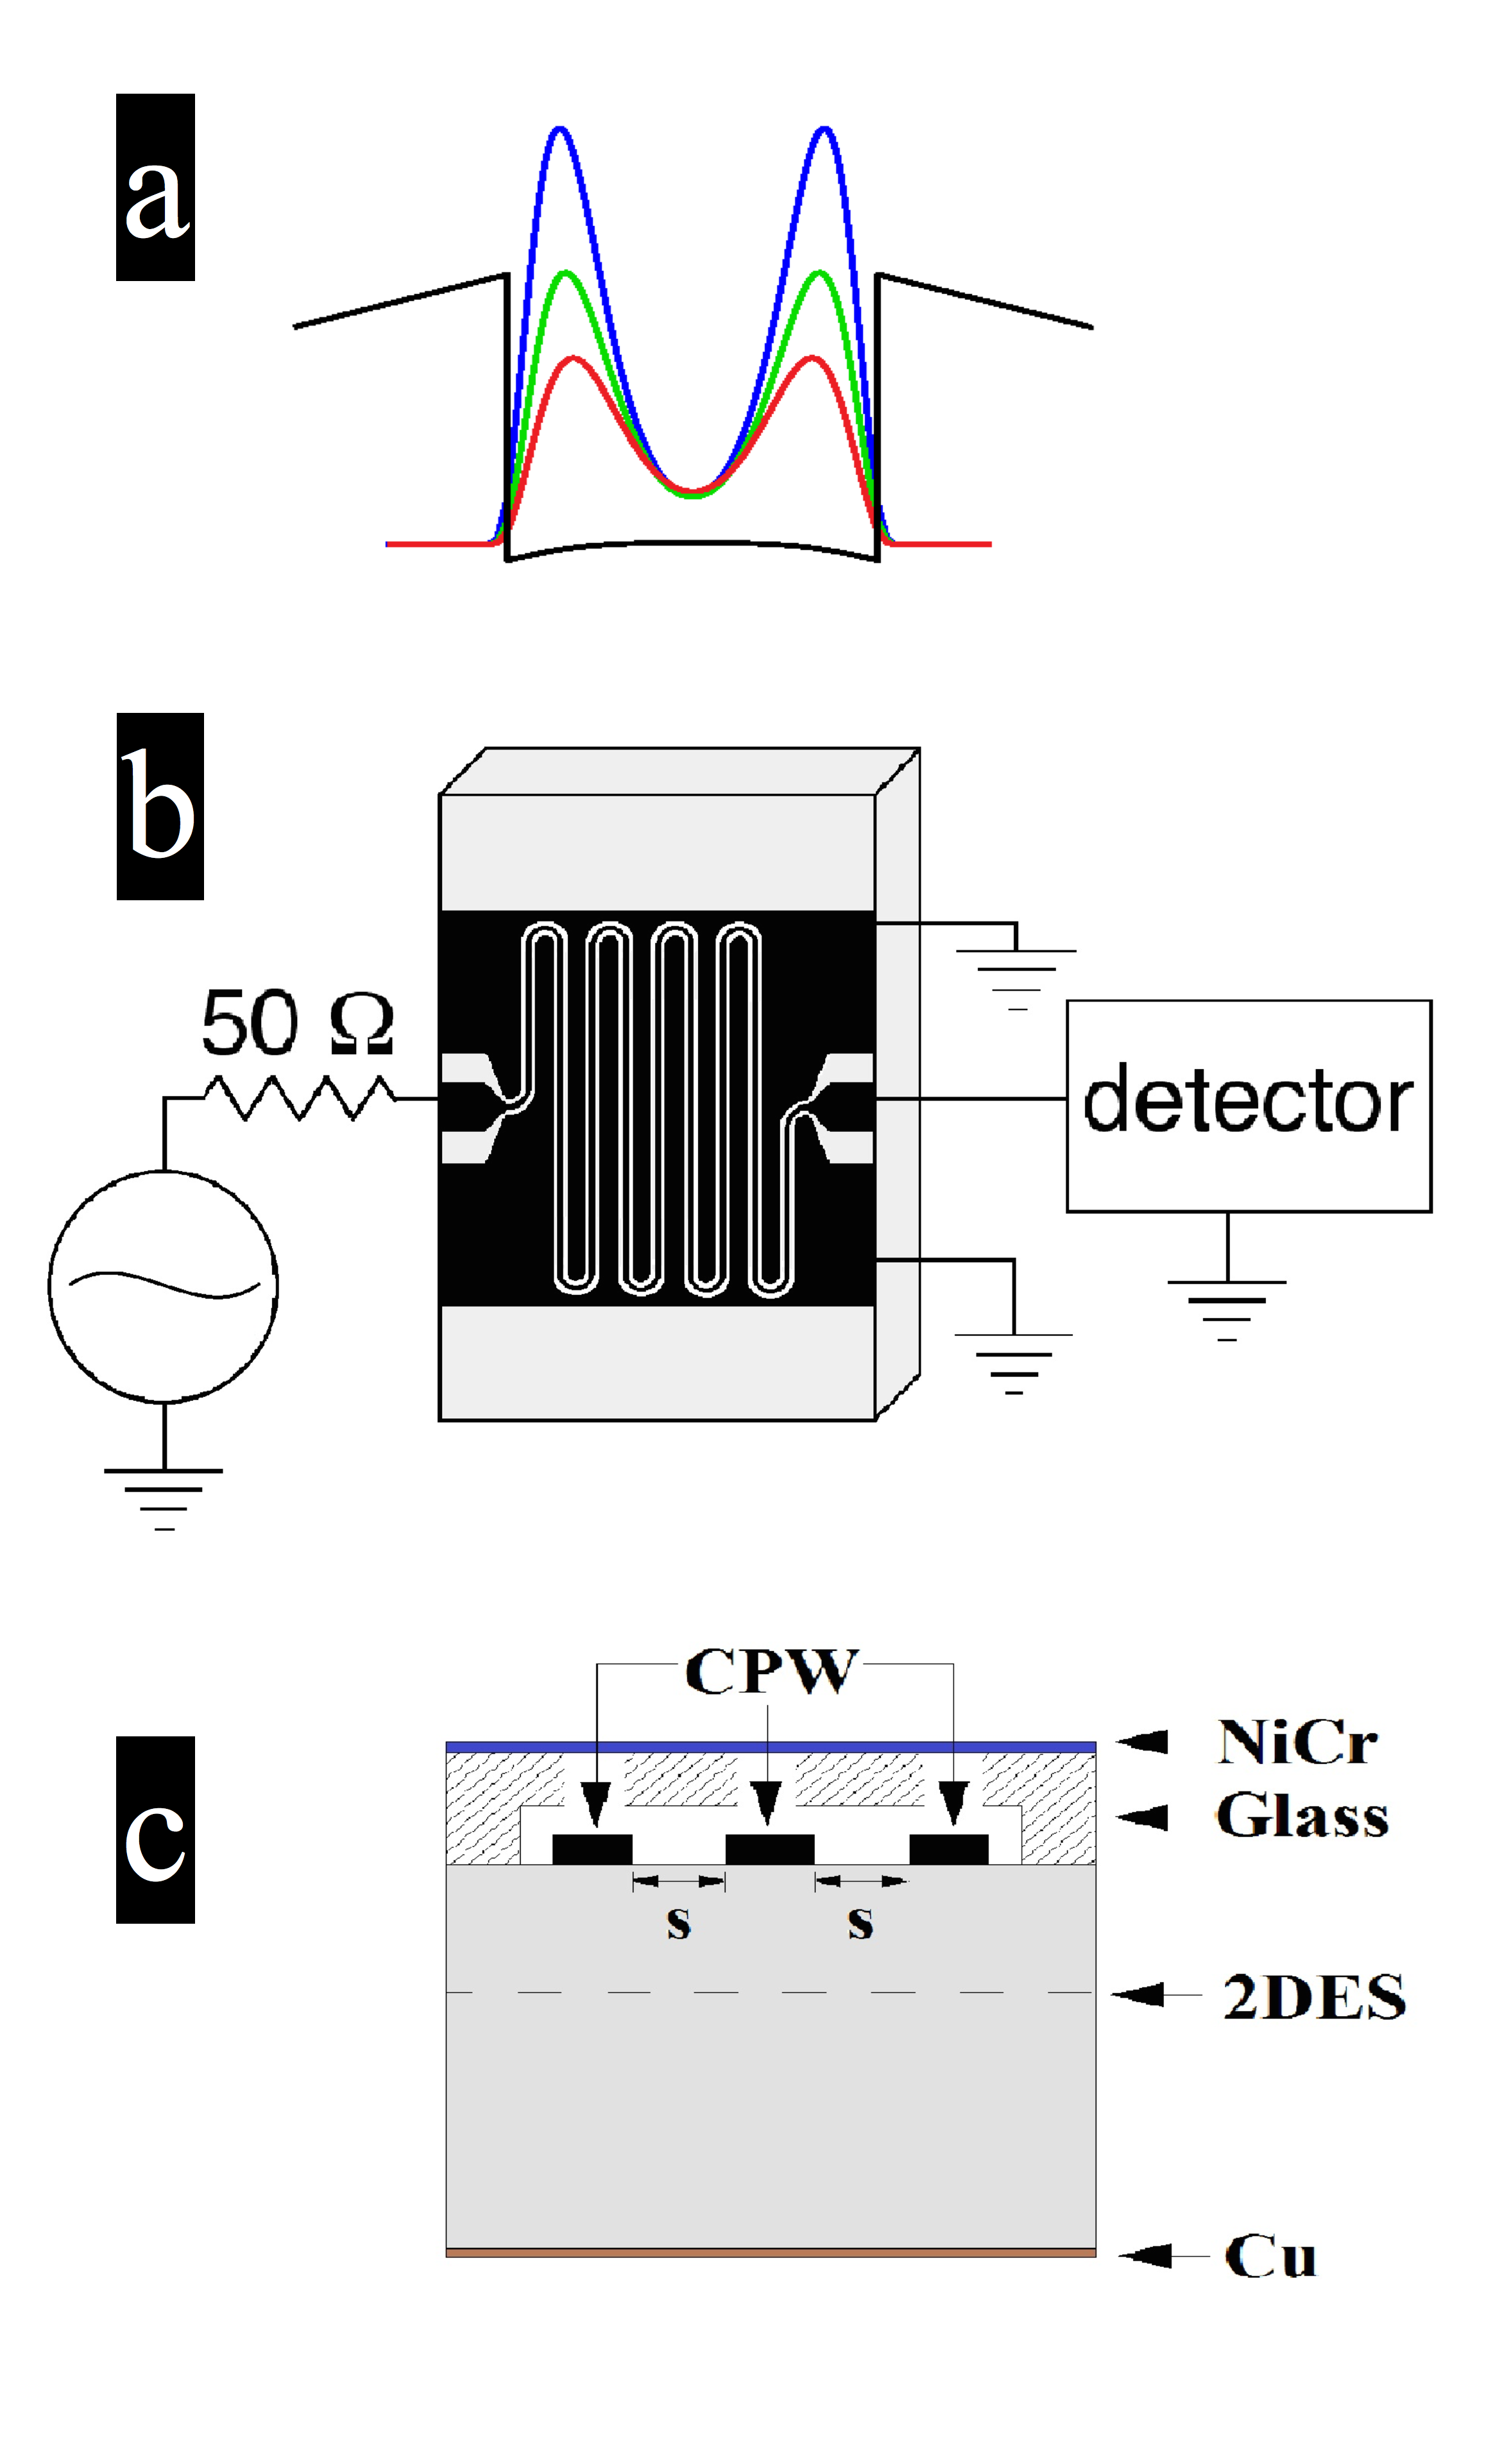
Our microwave spectroscopy technique Chen et al. (2003, 2004); Zhu et al. (2010b); Wang et al. (2012); Hatke et al. (2014, 2015, 2017) uses a meandering coplanar waveguide (CPW) patterned in Cr:Au on the sample surface. Figure 1(b) shows a schematic diagram of the microwave measurement technique and Fig. 1(c) shows a cutaway side view of the sample. A Cu back gate was in direct contact with the back of the sample and a NiCr front gate was deposited on a piece of glass that was etched to space it from the CPW by m, as in Refs. Hatke et al., 2014, 2015, 2017. We balanced the charge in the growth direction between the front and back halves of the well by biasing front and back gates such that individually each would change the carrier density by equal amounts. Charge asymmetry of was found not to affect our results. The samples were mounted on a rotatable sample stage with flexible, low-reflection broadband microwave microstrip in a dilution refrigerator running at mK, unless otherwise noted. We find , defined as the angle between the sample normal and applied magnetic field, from the total magnetic field, , of prominent IQHE features of known . The microwave measurements were carried out in the low-power limit, where the measurement is not sensitive to the excitation power.
As in earlier work (Chen et al., 2003, 2004; Wang et al., 2012; Hatke et al., 2014, 2015) we calculate the diagonal conductivity as , where m is the distance between the center conductor and ground plane, mm is the length of the CPW, is the characteristic impedance without the 2DES, and is the normalized transmitted signal with the amplitude at the receiver and the amplitude for . Hence is the difference between the conductivity and that for ; just at the conductivity is vanishing at low temperature. Using to normalize for instead produced a shift of the spectra by S, which does not affect our conclusions. In this paper, the peak frequency of a resonance, , is found using the condition(Hatke et al., 2014) Im.
To cover the density range of interest, microwave spectra were obtained from two WQW wafers, Sample A and Sample B, with well width nm but as-cooled densities, and and mobilities cmVs and cmVs, respectively. Throughout the paper will retain units of cm-2, which will be omitted for brevity. Sample A could only be gated up to 1.97 and Sample B could only be gated down to 2.28. Figure 1(a) shows charge distributions for a 65 nm WQW with densities like those studied here.
III Results
III.1 Spectra as density and tilt angle change
This section will show the development of the experimental signature of S2, which appears as or increase, but vanishes at the largest or .
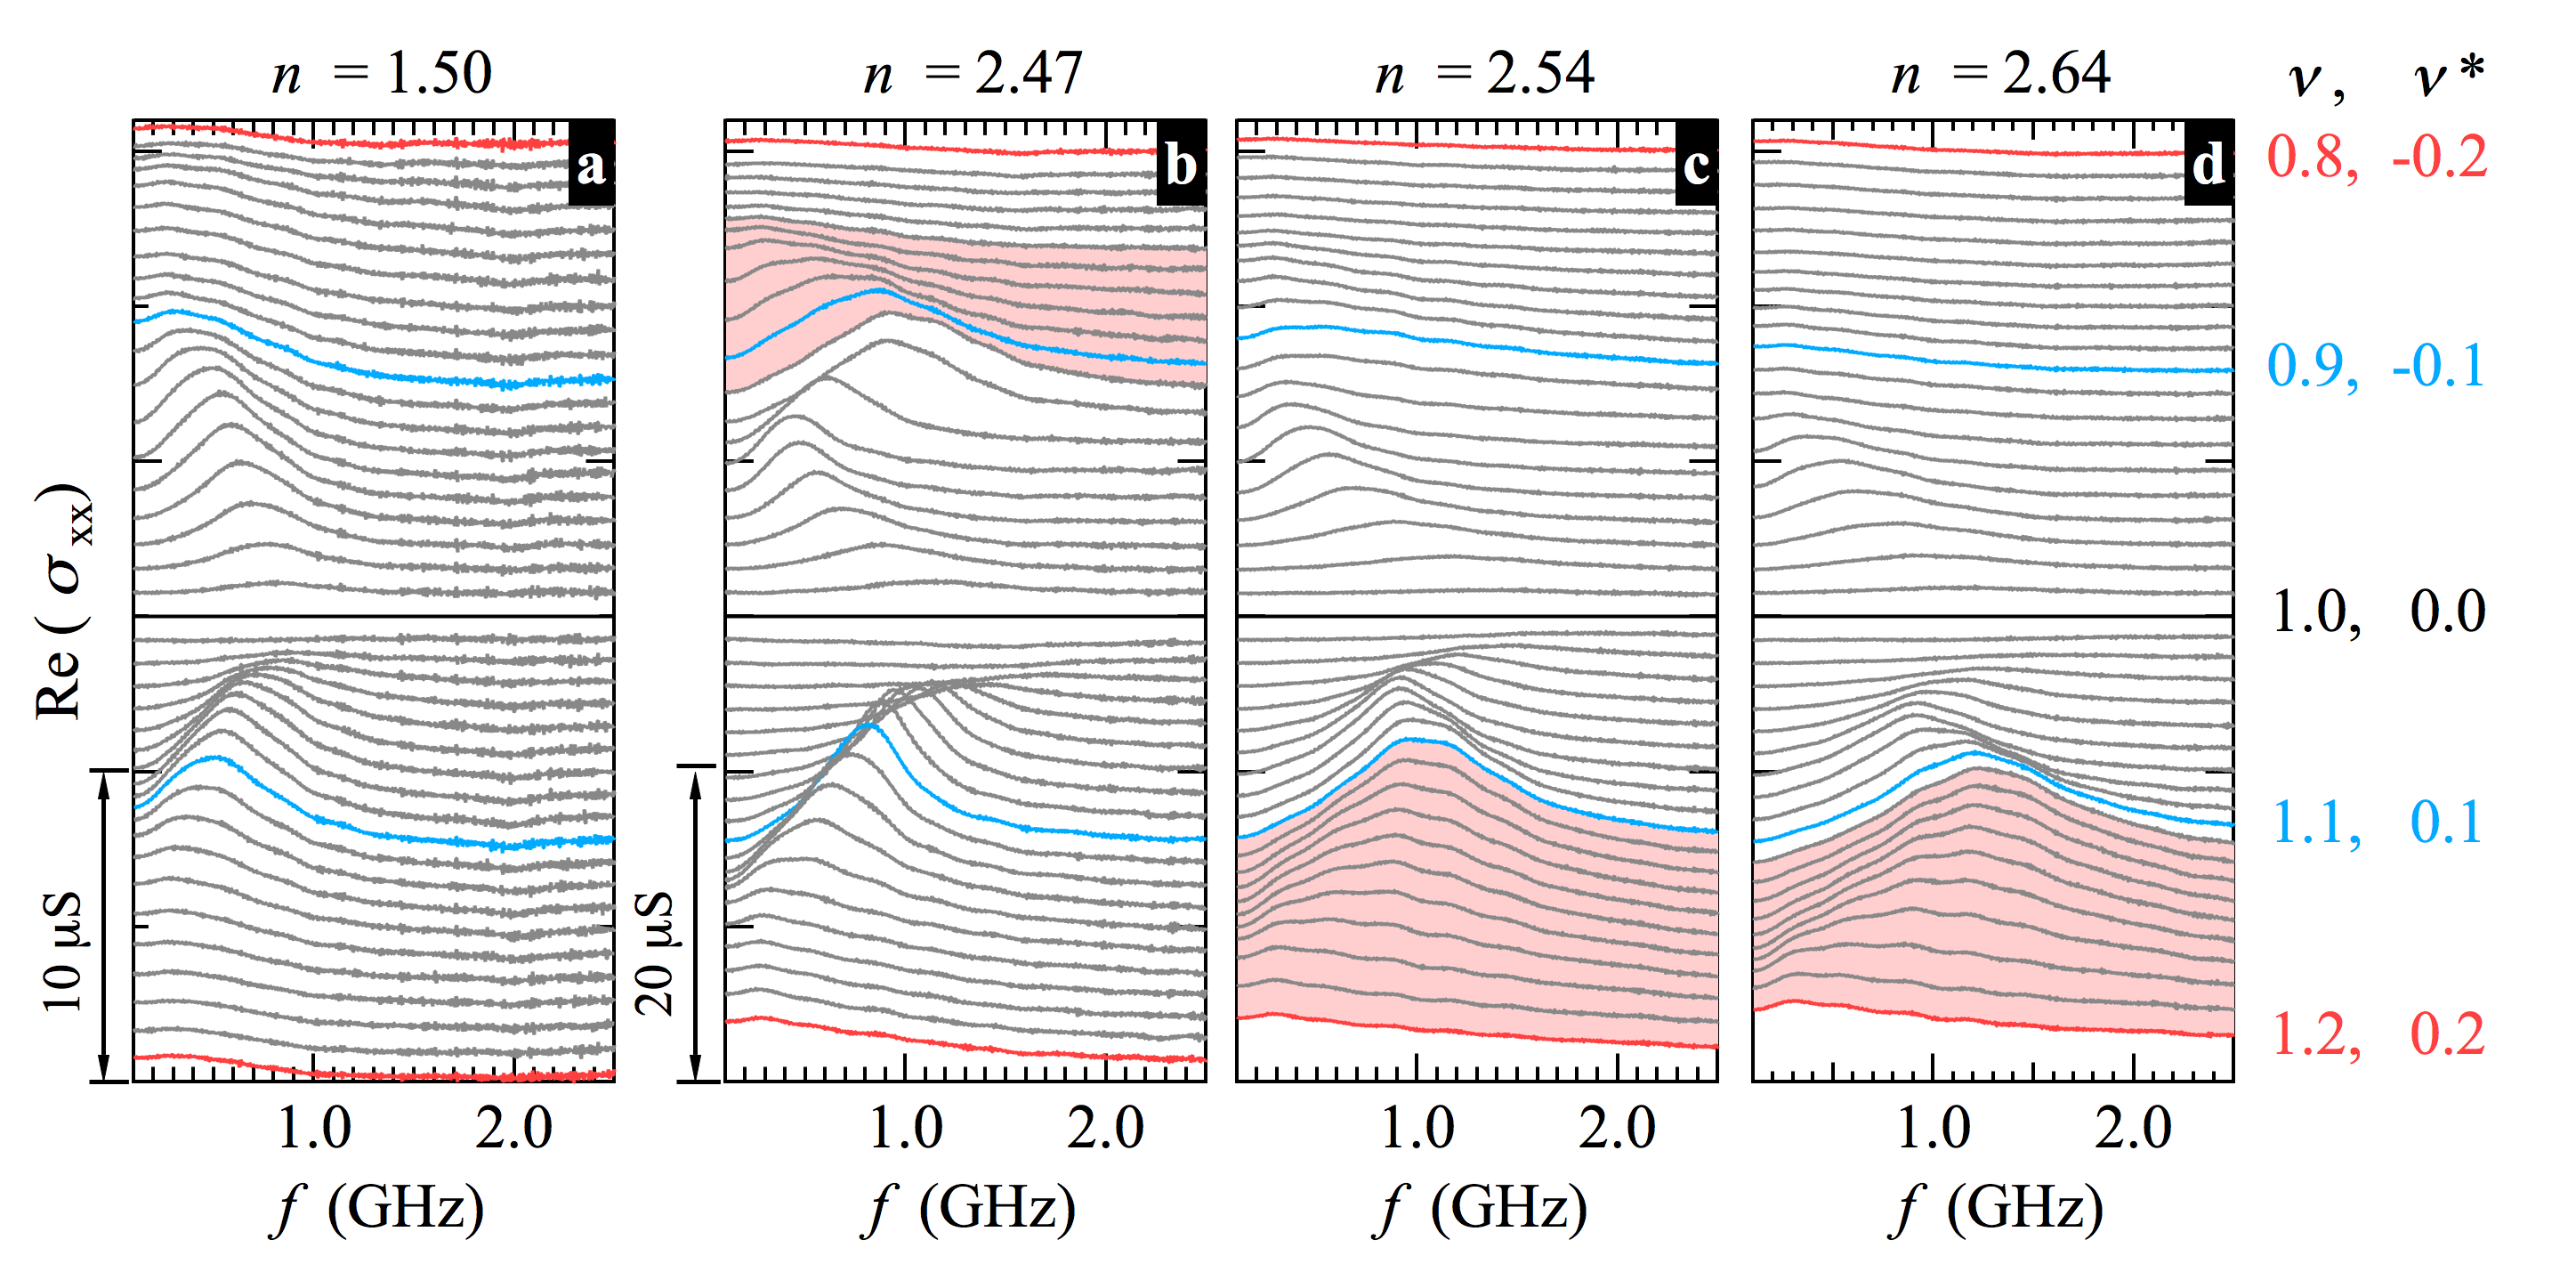

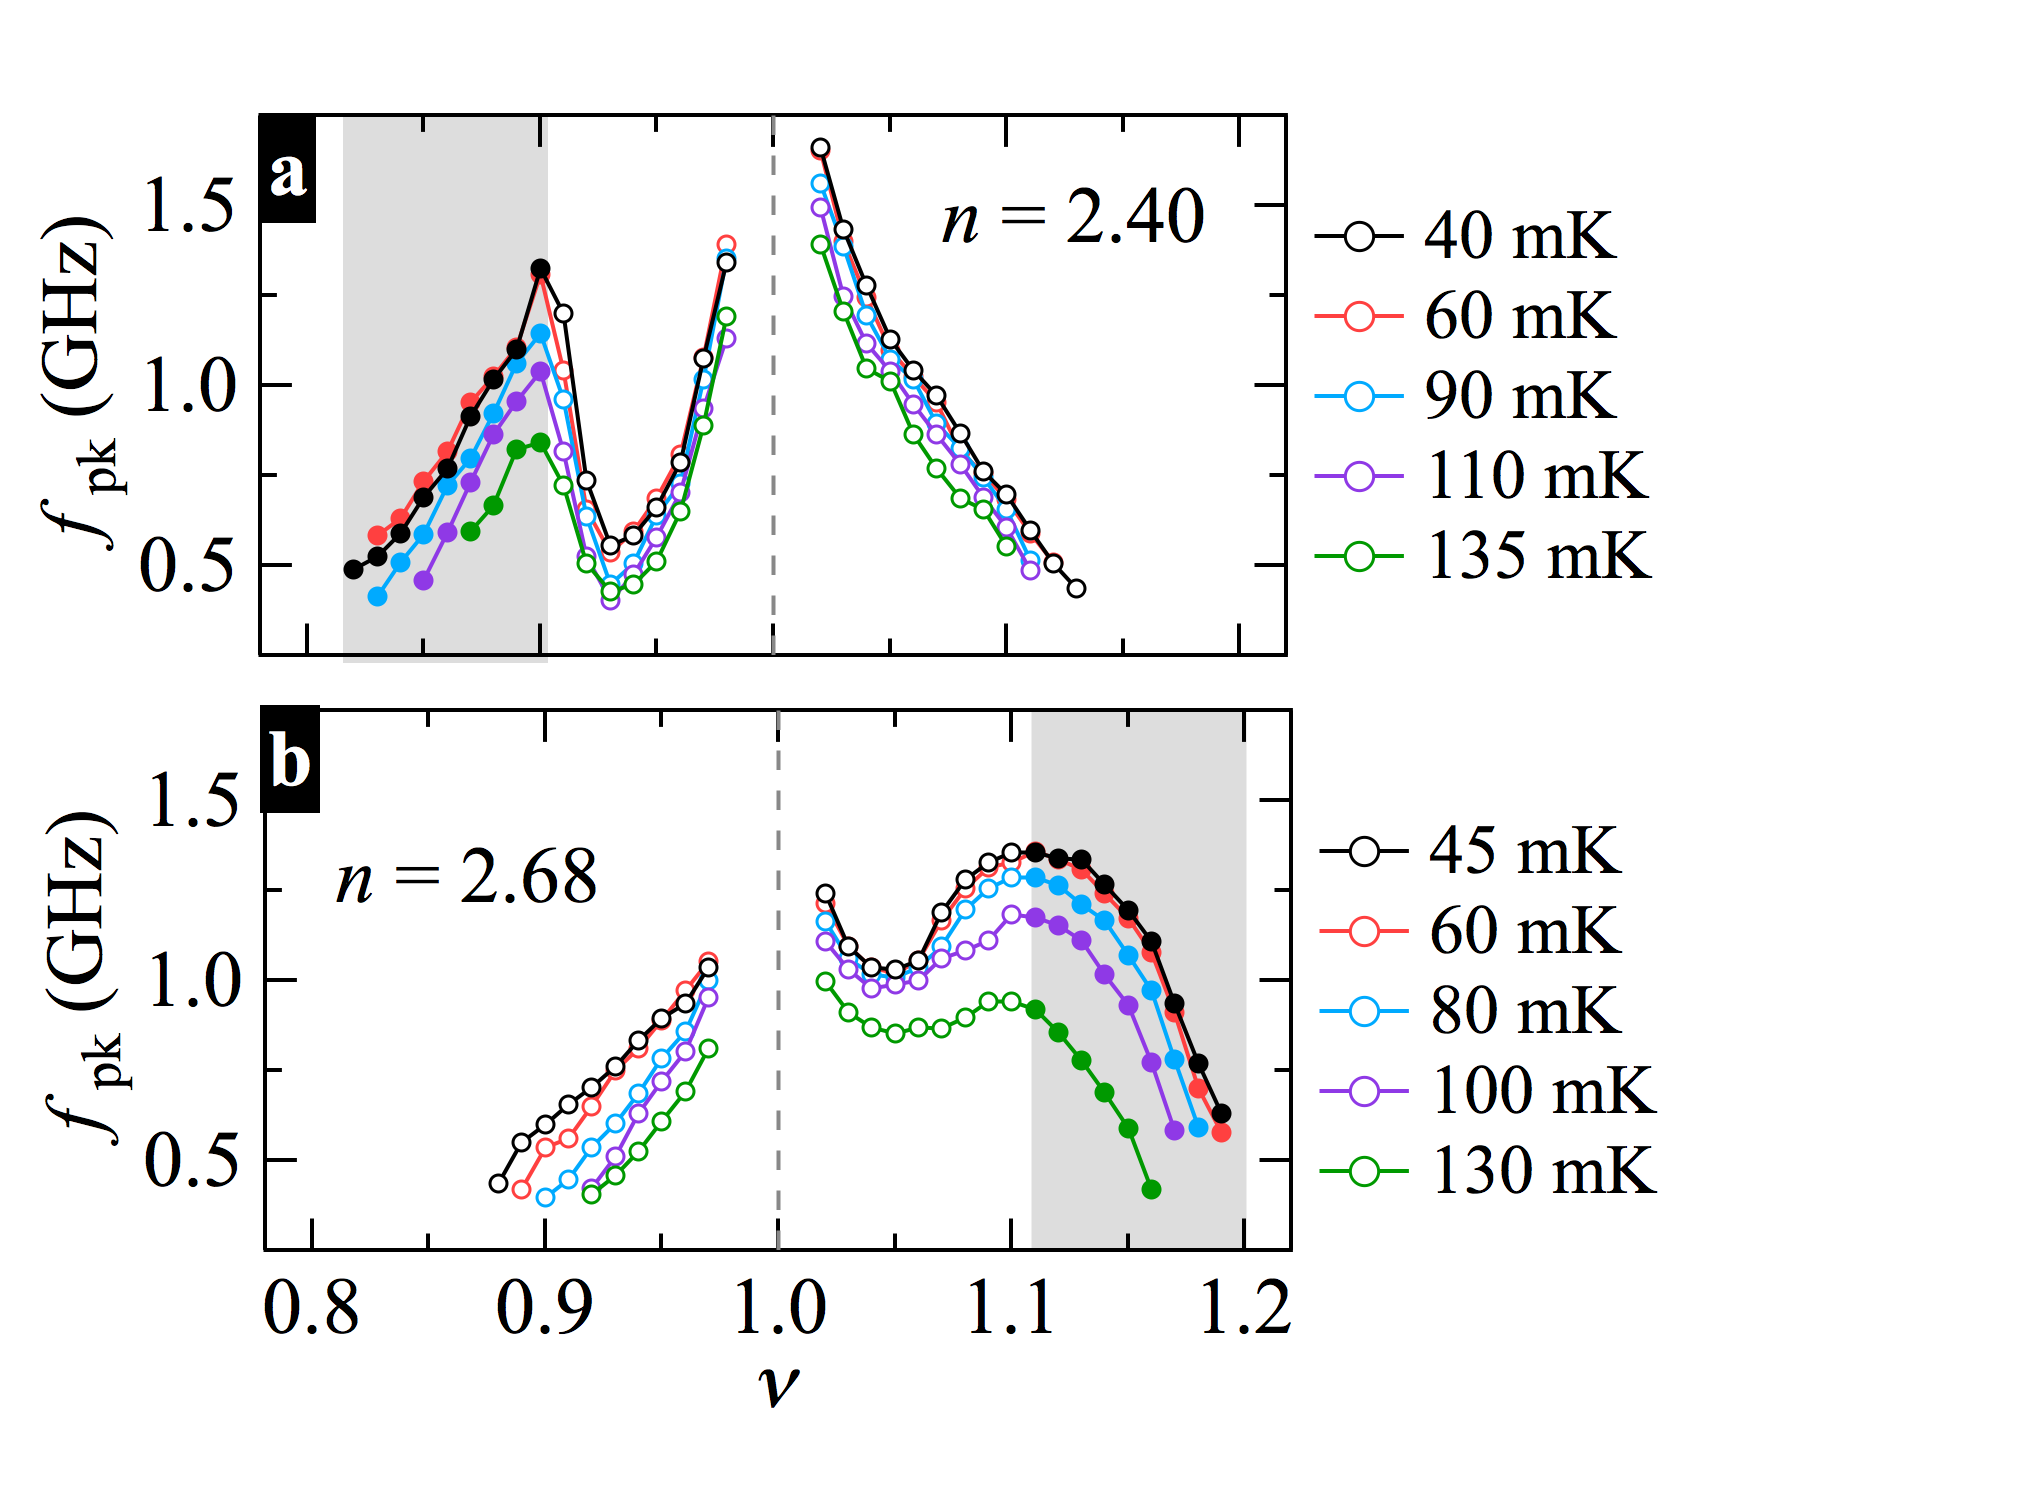
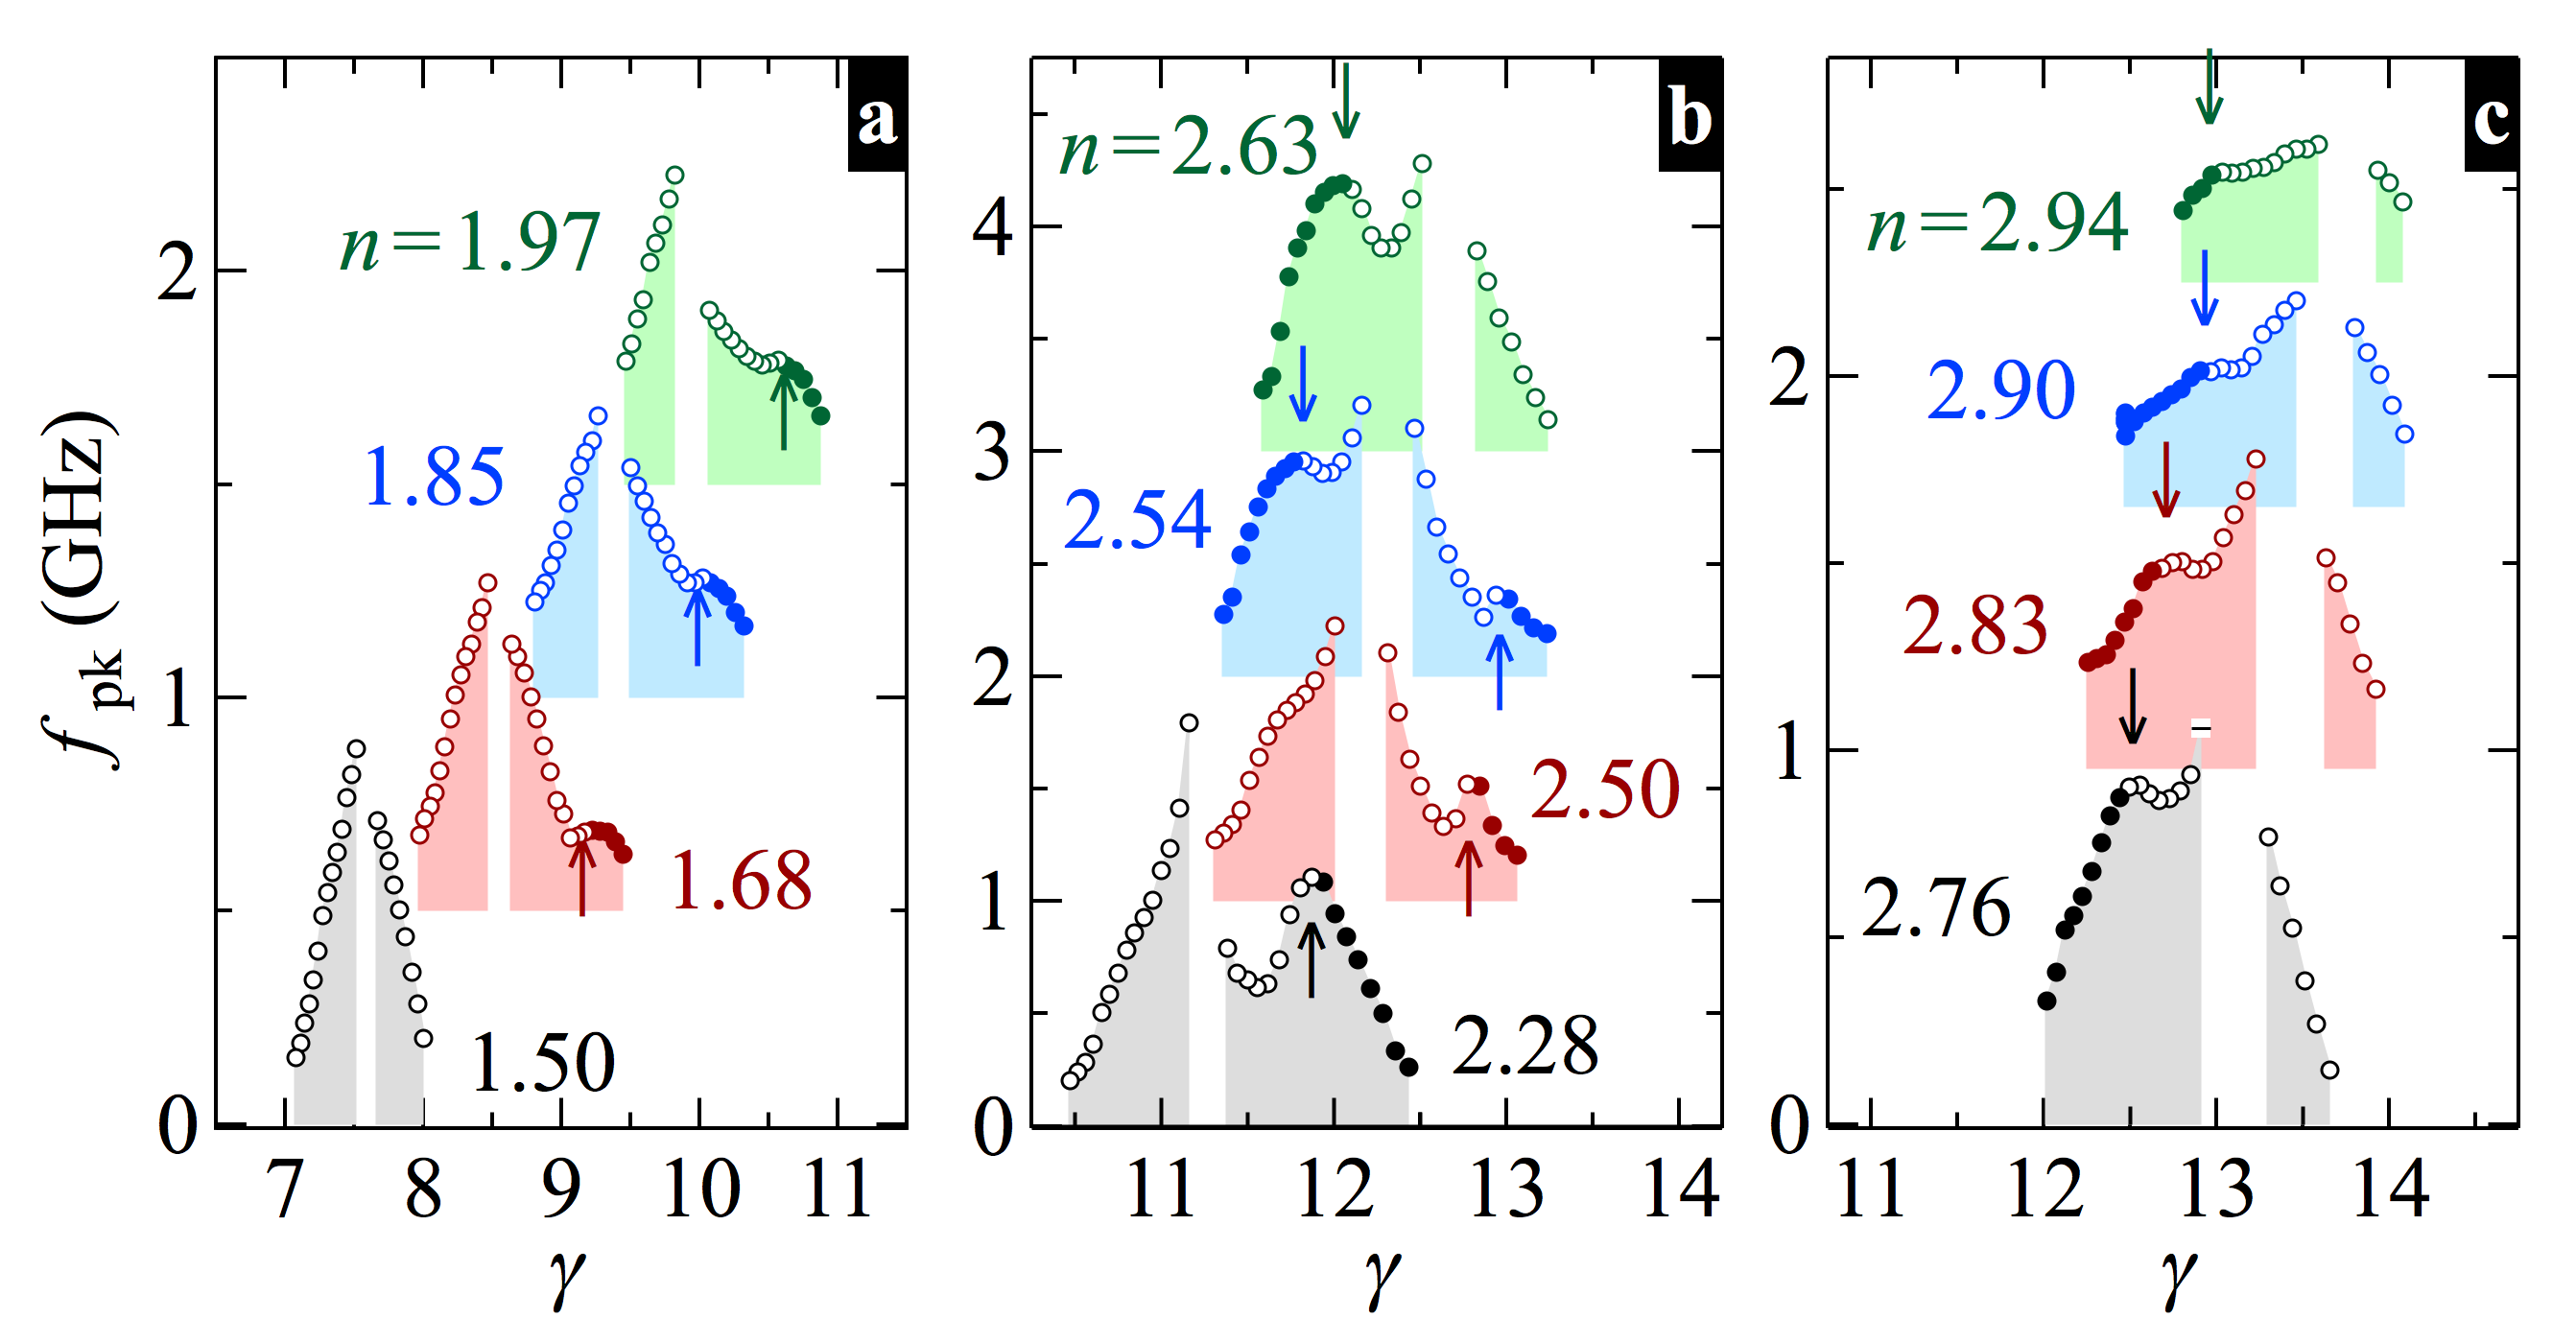
Figures 2(a)-(d) show Re vs spectra, at different , for pinning modes near . The spectra are offset upward proportional to , which is marked at right. For reference, the development of S1 alone is shown in Fig. 2(a), for Sample A at . As moves away from 1, the resonance frequency decreases, while the amplitude first increases then eventually vanishes. We ascribe this behavior, first observedChen et al. (2003) long ago, to the evolution of a single solid, which we call S1, as its carrier density changes. Because the solid is made up of quasi-particles or -holes created as moves away from one, its charge density is proportional to , where . While in some cases the quasi-particle and -hole vs are nearly symmetric around , this is not the case for much of the data presented here. The lack of symmetry could plausibly be due to the features of the disorder potential (which may for example have sharp spikes of one sign only) not acting in the same way on positively and negatively charged WS. The dependence on charge density, which we call the “density effect,” is generic to pinning modes,Li et al. (2000); Chen et al. (2003); Wang et al. (2012) and is qualitatively predicted in weak-pinning theories.Fertig (1999); Chitra et al. (2001); Fogler and Huse (2000) WSs of lower charge density (here, smaller ) have larger because they are less stiff, and carrier positions are more closely associated with the disorder potential.Li et al. (2000) The intensity of the resonance initially increases because the charge density of the solid increases, but at large enough falls off as the solid gives way to fractional quantum Hall liquid states.
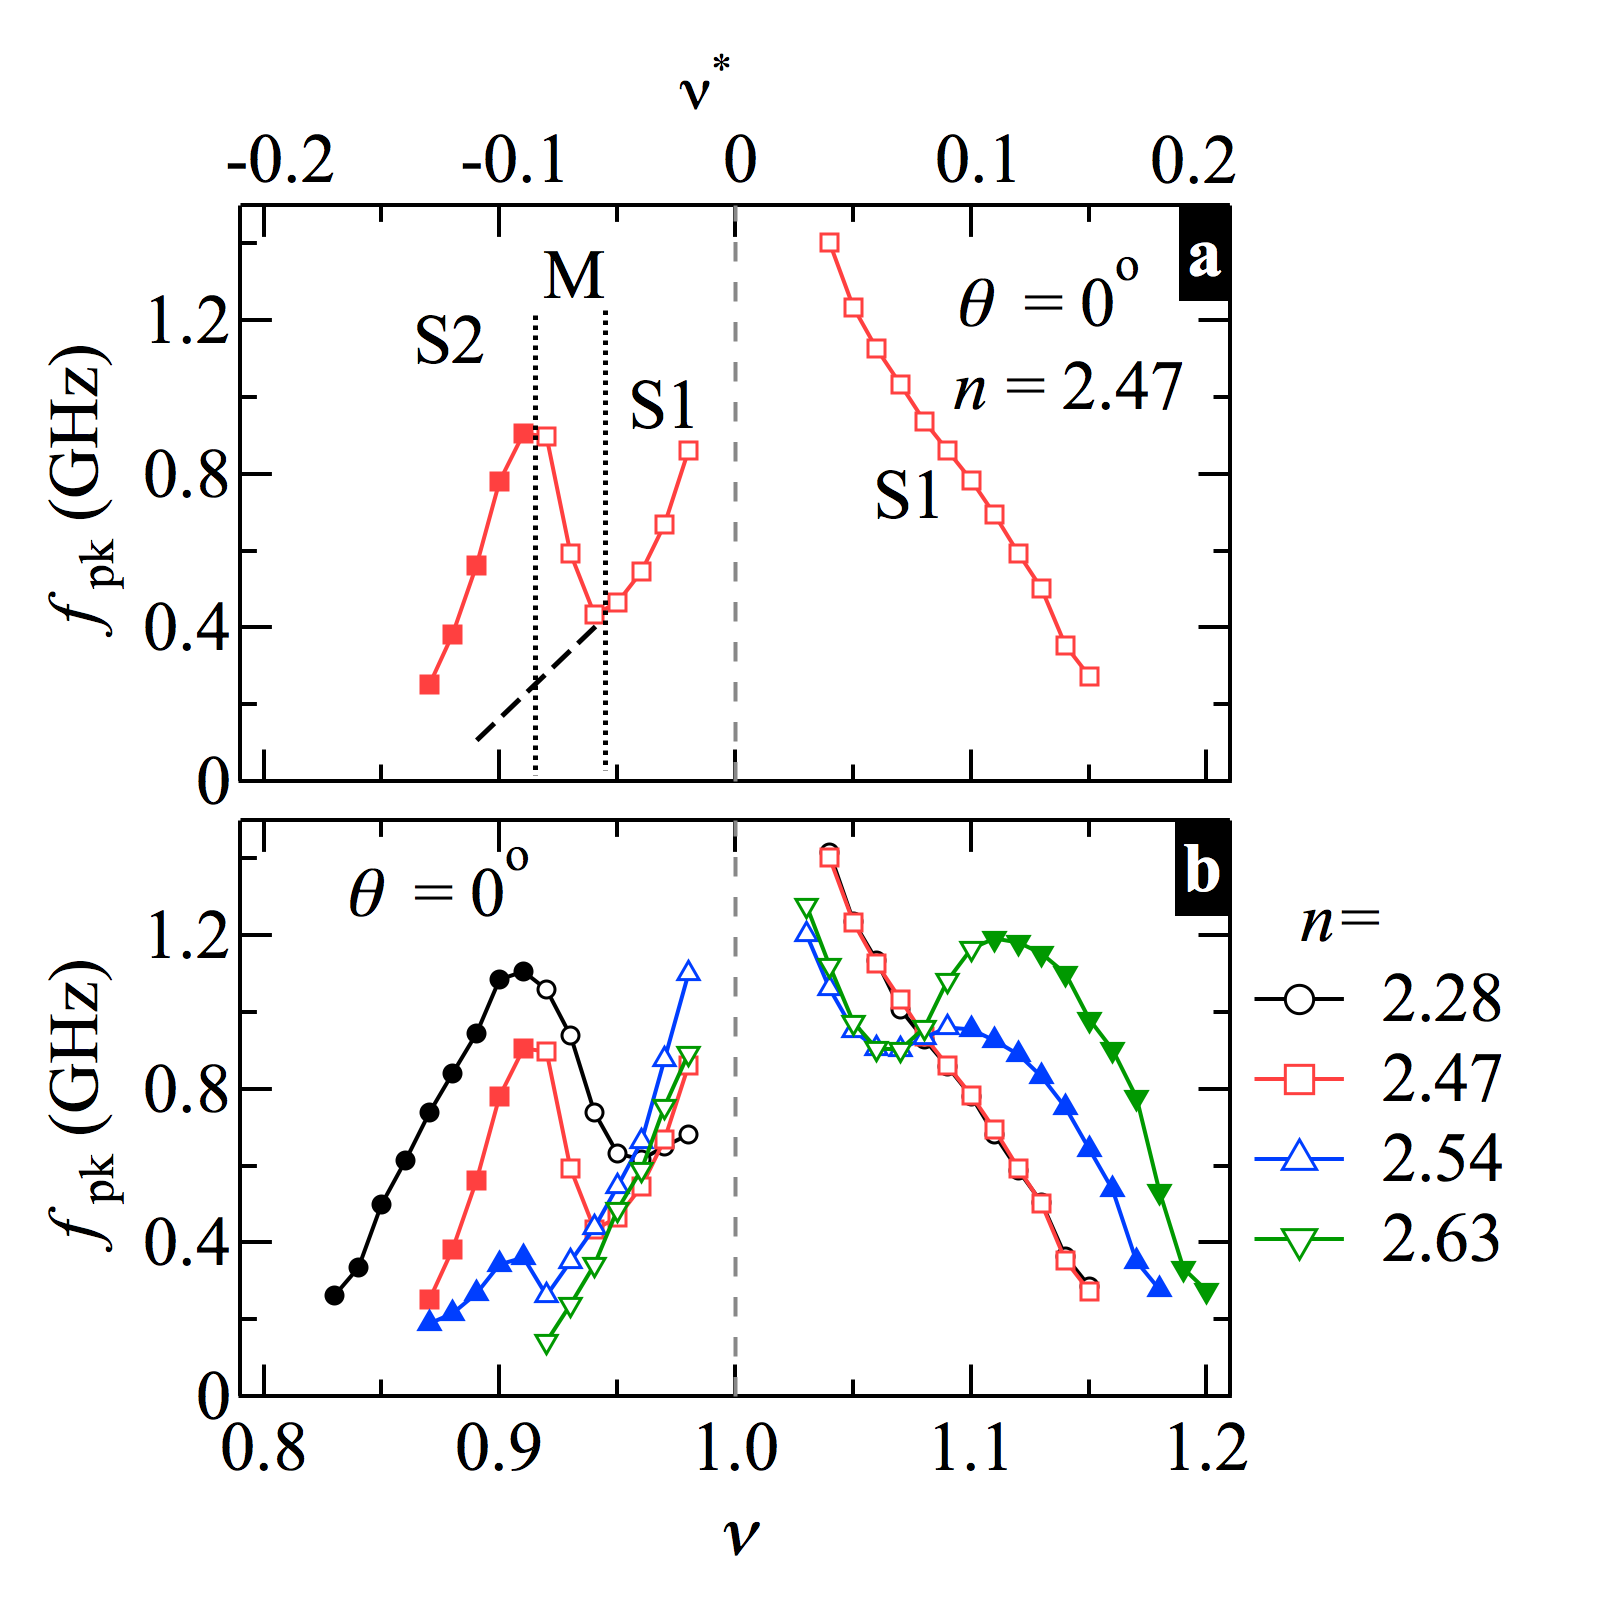
Figure 2(b) shows spectra for in Sample B. The development of spectra for is similar to that in Fig. 2(a), but is markedly different for , where the signature of S2 develops. This signature is most easily shown in a graph of vs . Figure 3(a), shows such data from the spectra in Fig. 2(b) with also on the top axis, to summarize the interpretationHatke et al. (2014) of the data in terms of S1 and S2. At this , for , decreases monotonically as increases; this is interpreted as due to the density effect in a single solid (S1). For , as first increases, in the region marked S1, decreases, then shows a sharp upturn in the region marked M, then begins to decrease again. The region of increase of with cannot be explained by the density effect, so the existence of another WS phase is implied,Hatke et al. (2014) which we call S2. The region marked S2 shows again decreasing with , because the density effect acts on S2. The region M is interpreted as a transition, with a mixture of S1 and S2. The points in the S2 region are filled, as will be the convention for the rest of this paper. The signature of S2 is the region of enhanced above what would be expected by extrapolating S1 vs . The extrapolated for S1 is represented by a dashed line in the Fig. 3(a).
In Fig. 2, spectra from S2 are highlighted by shading between the traces. While Fig. 2(b) shows S2 only for , Figs. 2(c) and (d), show that on increasing further, the enhancement of in S2 becomes weaker for as it emerges and grows stronger for . At of 2.54, in Fig. 2(c), S2 is present on both sides of . For Fig. 2(d), with data for , only S1 is present for , although S2 remains well-developed for .
The vs curves of Fig. 3(b) summarize the development of S2 with increasing . For , the enhancement of S2 is largest for , and is absent for . For , S2 is not visible for , and the amount of enhancement due to S2 is increasing up to the largest of 2.63.
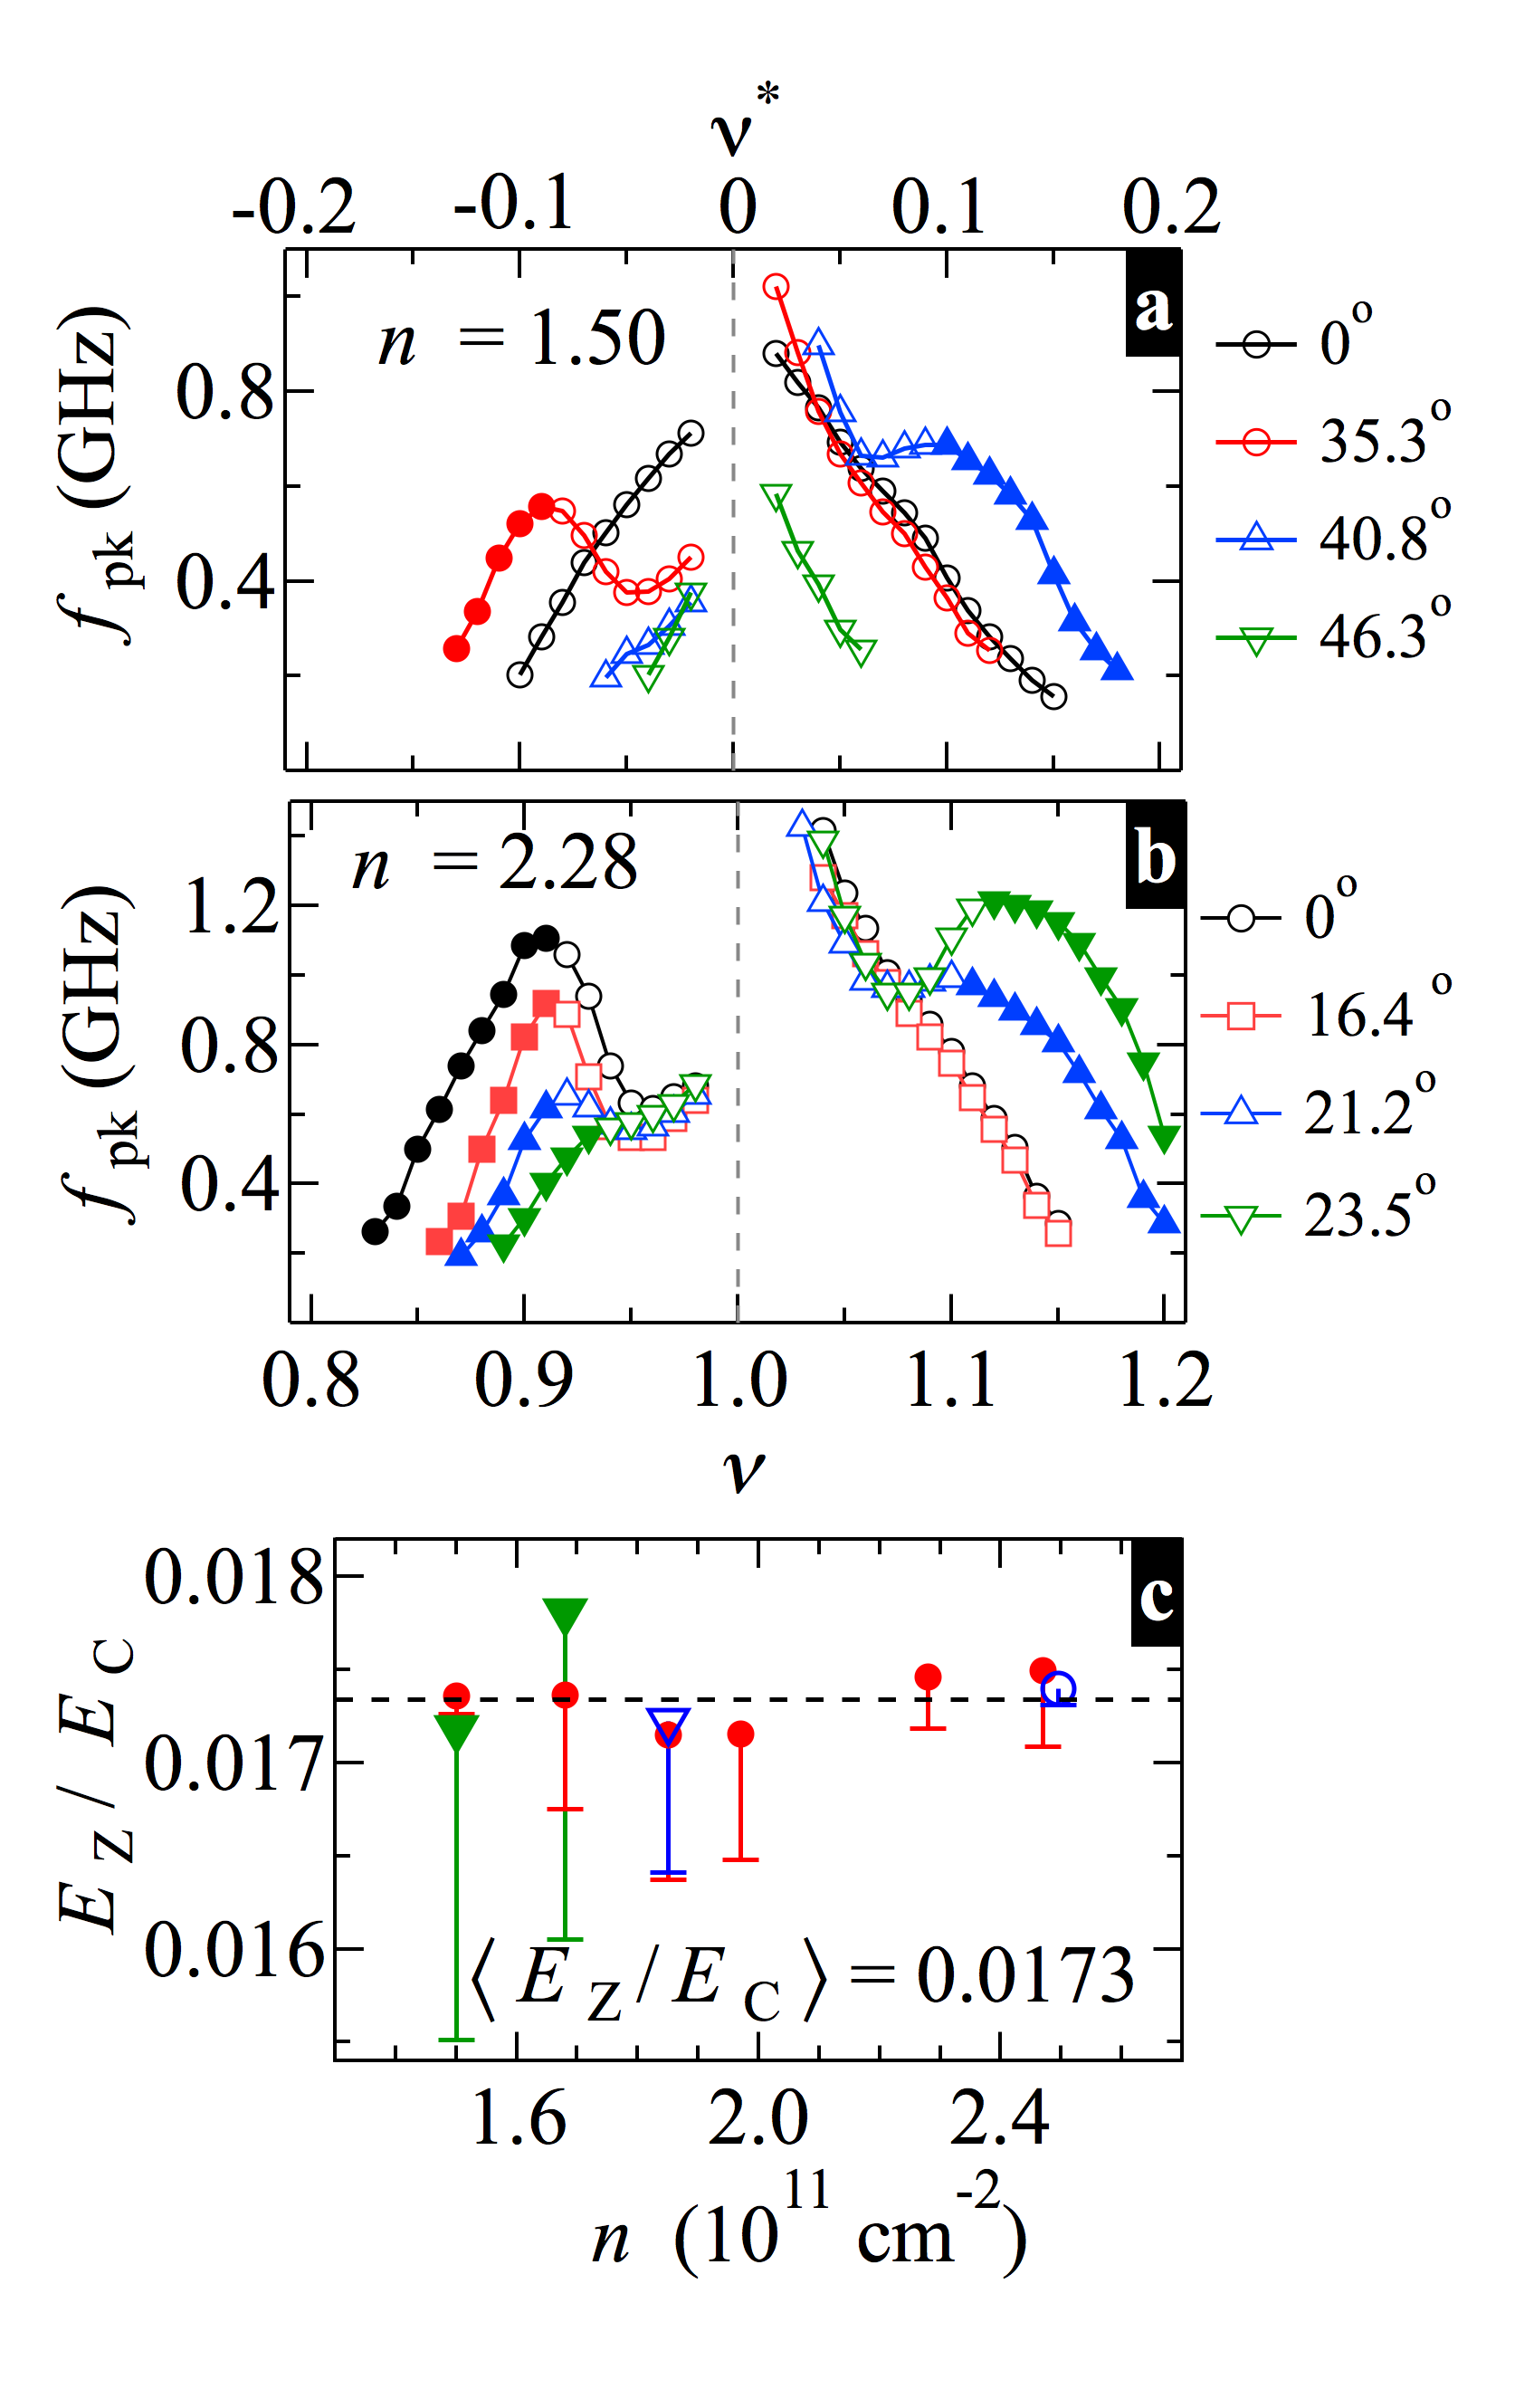
Increasing has much the same effect as increasing , causing the signature of S2 to turn on, then subside. This is illustrated as spectra in Fig. 4 and as vs in Figs. 5(a) and (b). In Fig 4 the spectra are from Sample A with , at different . Figure 4(a), for (same as Fig. 2(a)), shows no sign of S2. Figure 4(b), with spectra taken at , shows S2 for only, but is essentially the same as panel (a) for . In Fig. 4(c), with data taken at larger , S2 has subsided for , but is well-developed for . Finally, in panel (d), for there is no signature of S2 on either side of .
Figures 5(a) and (b) show the evolution of vs with . In Fig. 5(a), for Sample A at , as increases, S2 emerges and then disappears, first for , then for . In Fig. 5(b) at , for Sample B, the development with increasing is similar, but S2 is already present at .
The observed appearance of the S2 signature as either or are increased is consistent with S2 becoming visible at sufficiently large total magnetic field , which at fixed increases with both and . This suggests the Zeeman energy, , where , is important to stabilizing S2, as Ref. Liu et al., 2014 pointed out for the RIQHE phases that lie further from . The disappearance of S2 at still higher or is dealt with below in Section III.C.
To quantify the role of Zeeman energy we present the minimum required to observe S2, where the Coulomb energy is defined as and is the magnetic length. For each , we find the minimum for which S2 can be seen, then calculate at the highest (lowest ) within S2. This gives a minimum for each , plotted in Fig. 5(c) as closed symbols. We do not continuously vary , so the differences between for which S2 is seen and for which it is not are used to obtain error bars. In addition, for we measured vs at many fixed , as exemplified by the data in Fig. 3(b). We also estimate a minimum from the lowest for which S2 can be seen, choosing the lowest- point within S2. Figure 5(b) shows data for S2 minimum required to observe S2 for (triangles) as well as for . Averaging all the minimum obtained in this way gives an estimated of 0.017 for the emergence of S2. The close grouping of the points in Fig. 5(c) is consistent with stabilizing S2.
III.2 Temperature Dependence
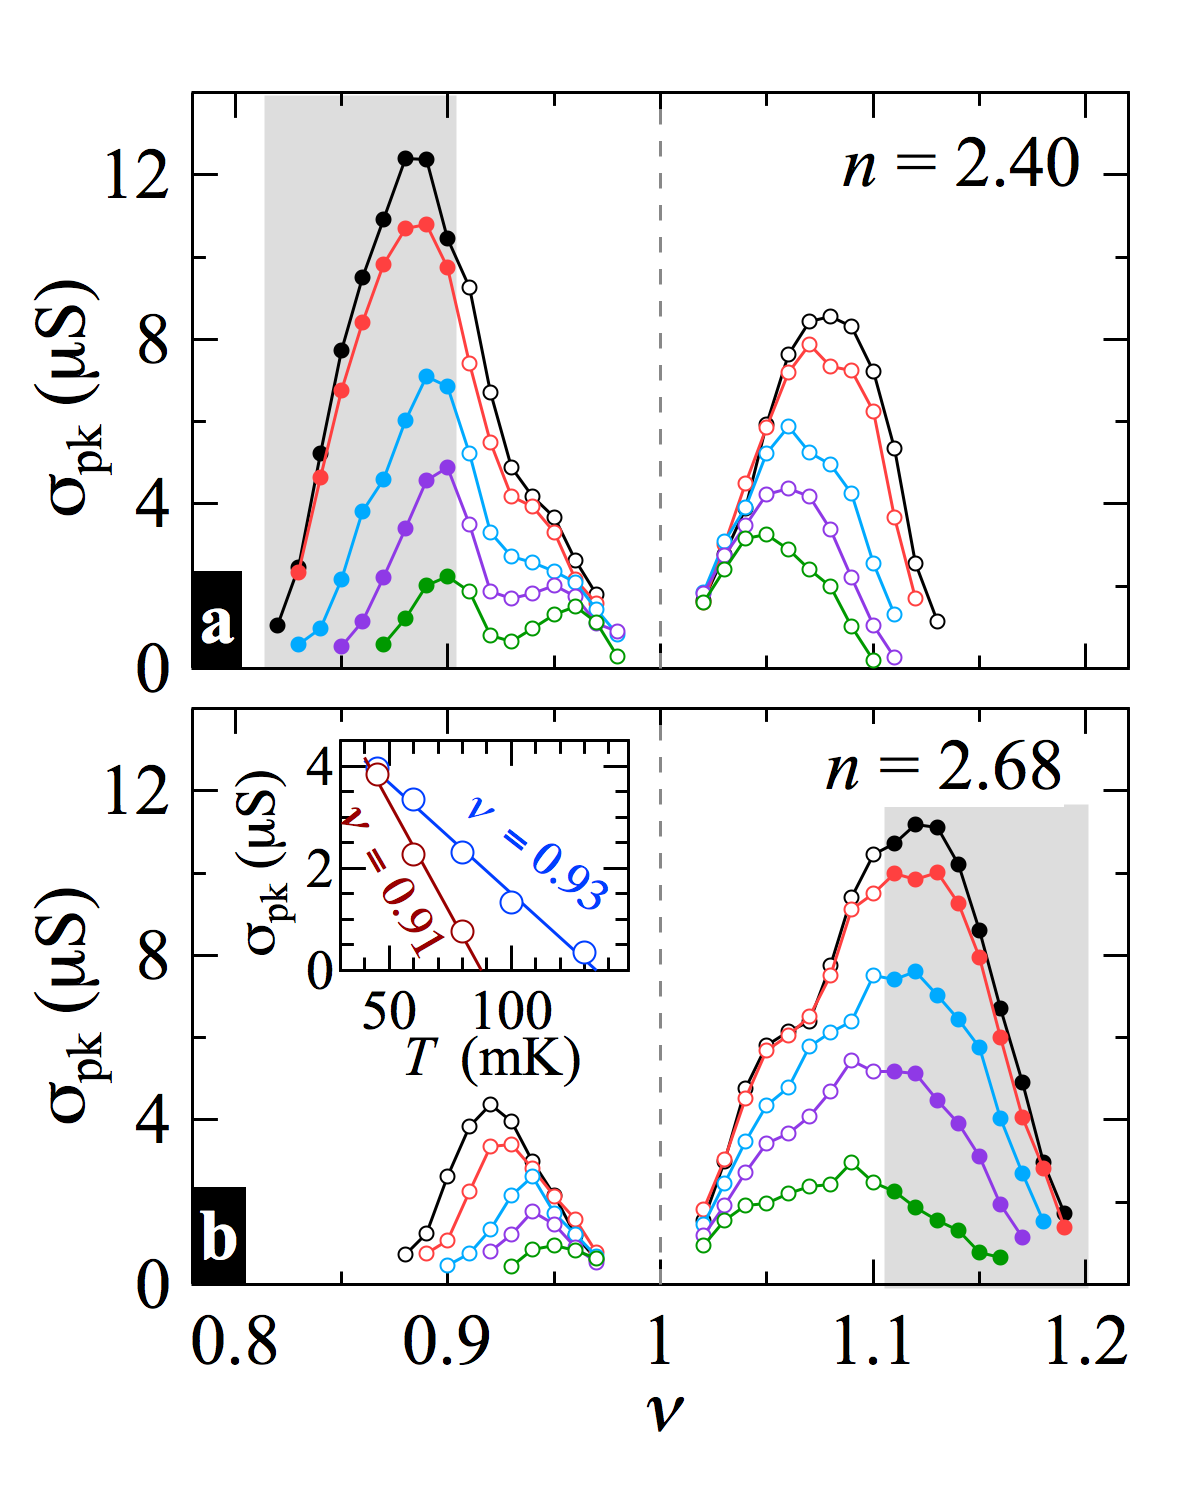
The interpretation of S1 and S2 as distinct solids is in accord with different temperature () dependences of their pinning modes. Figures 6 (a) and (b) show vs at various temperatures for and , with S2 respectively present for and . The region of well-developed S2, for which decreases with is shaded. As increases decreases, at all , indicating the pinning is weaker at higher . The position of the transitions from S1 to S2, as marked by the local maxima in vs , are nearly insensitive to .
Figures 8 (a) and (b) show (Re ) vs also for and . The maxima in vs do not occur at the same place as the maxima in vs . As increases, the resonance decreases and the -range of its existence shrinks, with the resonance farthest from disappearing first.
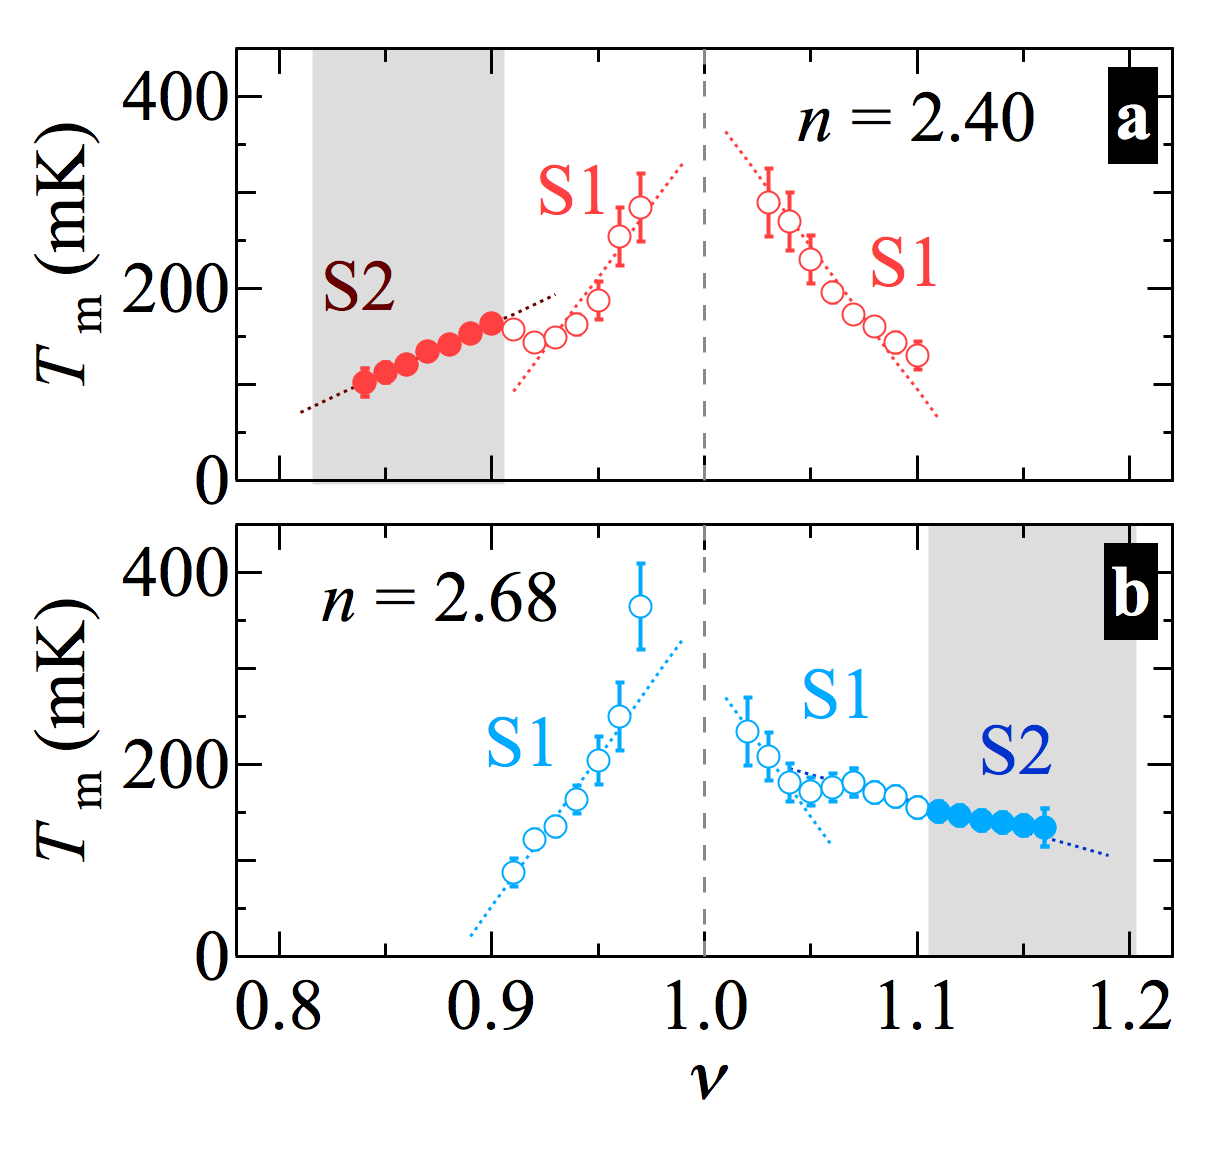
Following Ref. Chen et al., 2006, we estimate a melting temperature, , as the temperature at which vs extrapolates to zero. The inset of Fig. 8 (b) shows vs with the lines used to extrapolate, for at and .
Figures 8 (a) and (b) show vs for and , respectively. As increases, the main trend is for to decrease, similar to the behavior seen for vs in Ref. Chen et al., 2006. The -ranges of S2 are marked as shaded regions, and are identified as explained above from the low- vs in Fig. 6, as the regions further from than the local maximum in vs . Dotted lines, as guides to the eye, are drawn in the S1 and S2 regions of Figs. 8. S2 shows a much weaker dependence of on than S1; the magnitude of the slope for S2 is about a factor of three smaller for at and a factor of six smaller for at . In Fig. 8(a ), with S2 present for , there is a local maximum in vs just at the local maximum in vs , i.e. just at the edge of the shaded S2 region. In Fig. 8(b), with S2 present for , the local maximum in vs occurs at , which is closer to than the vs maximum Fig. 6(b), in the region of increasing vs .
III.3 Bilayer Transition
We have shown that S2 is present for sufficiently high or , but then disappears if or is increased further, as in Fig. 2(d) for and in Fig. 4(d). It is clear from our data in tilted field and also inferred from dc transport data Liu et al. (2014) that larger plays a role in stabilizing S2. In this section we show that the disappearance of S2 at still larger or can be explained by the system undergoing a transition from a single-layer to a bilayer state. Even when the system is a bilayer, the IQHE is clear in the data, and is understood as a two-component, interlayer-correlated, state,(Eisenstein et al., 1992; Murphy et al., 1994; Lay et al., 1994, 1997) which emerges when intra- and interlayer interactions have comparable importance.
Single-layer to bilayer transitions are well-known in WQWs at sufficiently large or in-plane magnetic field(Suen et al., 1992, 1994; Manoharan et al., 1996; Shayegan et al., 1996; Manoharan et al., 1997; Lay et al., 1997; Hasdemir et al., 2015; Mueed et al., 2016). The dimensionless parameter , (Suen et al., 1994; Manoharan et al., 1996; Shayegan et al., 1996) is a measure of the tendency of the system to be in a bilayer state, where is the interlayer tunneling gap. Experimentally (Suen et al., 1994; Manoharan et al., 1996; Shayegan et al., 1996) the change from one-component (1C) to bilayer two-component (2C) states has been shown to occur when . While is not well-defined at large in-plane fields, the in-plane field is known to suppress tunneling and to drive a WQW into a bilayer state.(Manoharan et al., 1997; Lay et al., 1997; Hasdemir et al., 2015; Mueed et al., 2016)
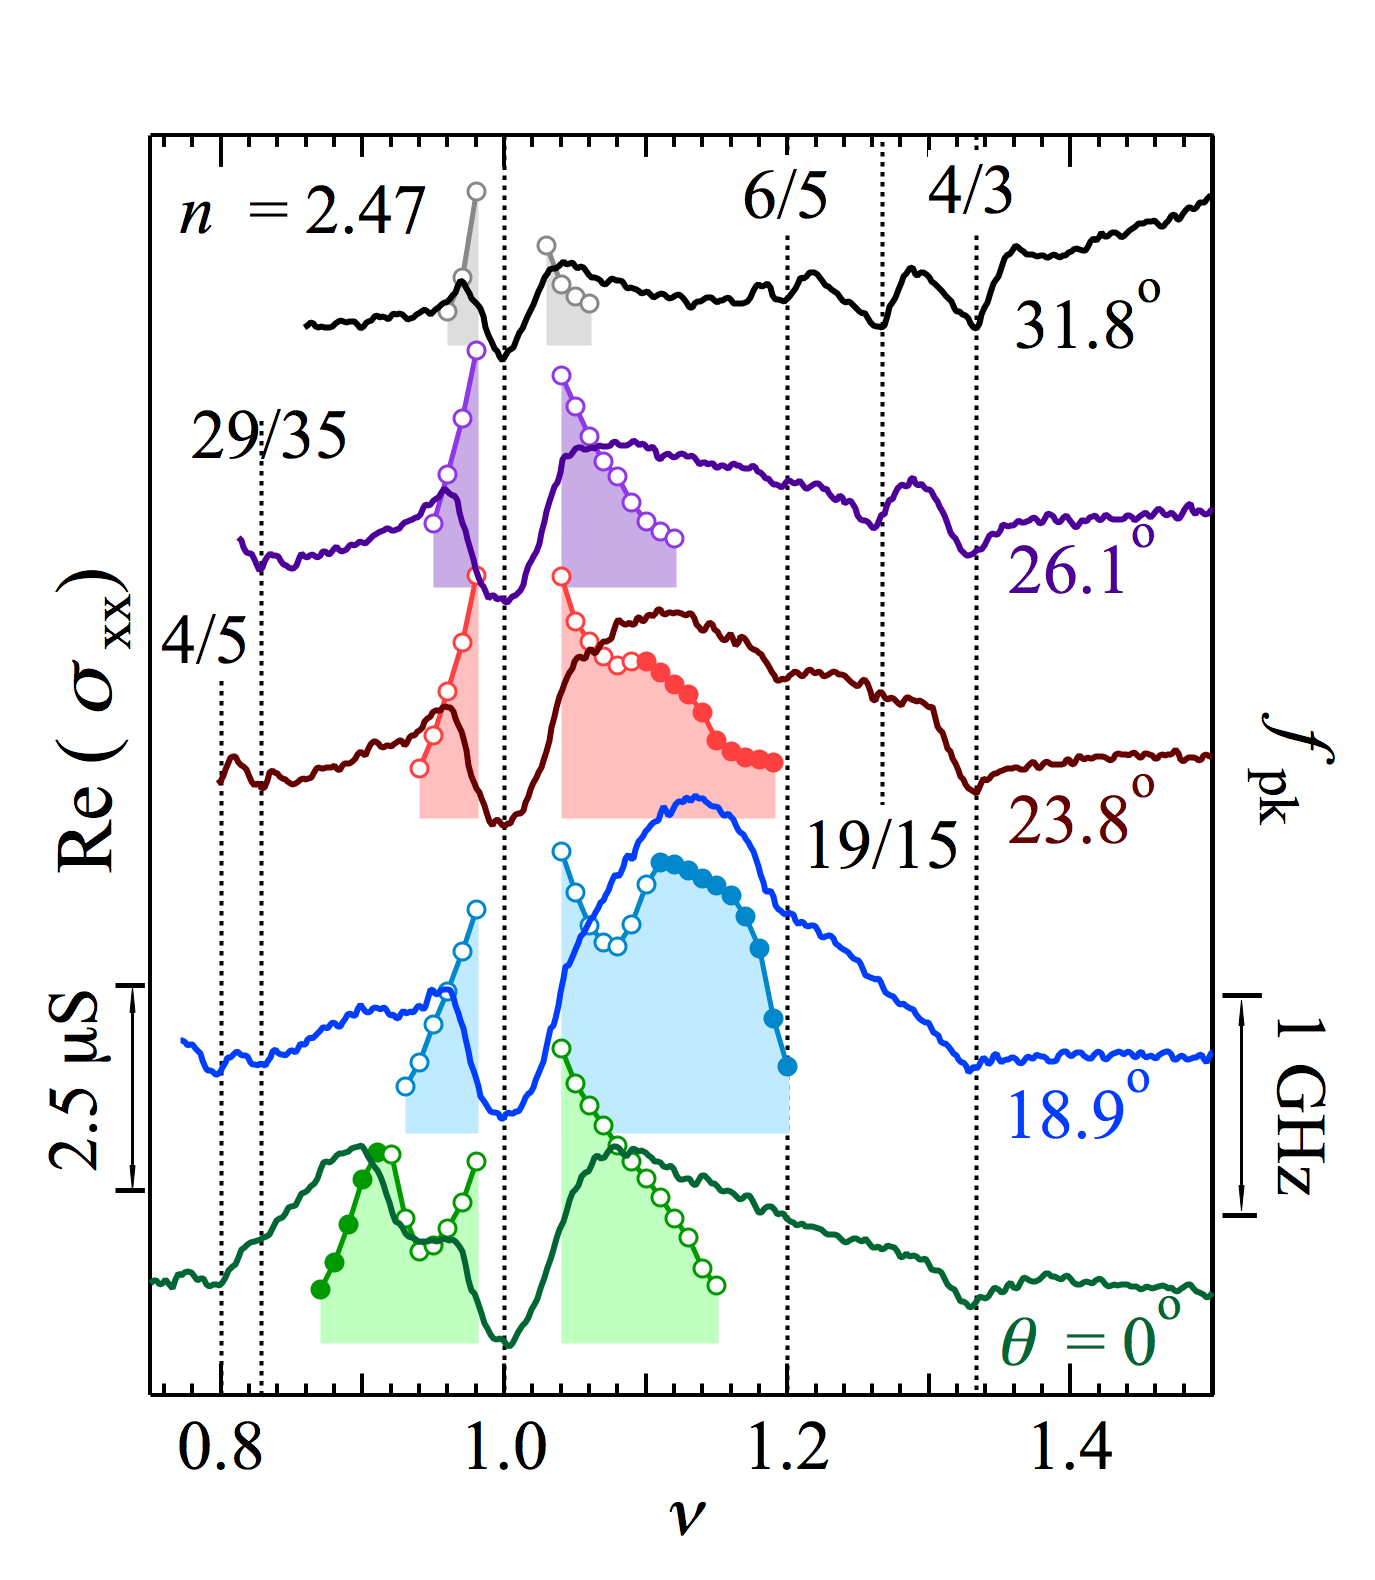
For and several , varying through the range where S2 disappears at large tilt, Fig. 9 shows the 0.5 GHz magneto-conductivity as Re vs , with vs superposed. At , Re shows FQHE minima centered at and , and S2 is present for but not for . In the vs data in Fig. 9, S2 is lost for , but is present for . At the same , a Re minimum at becomes clear. Under further sample rotation to , the S2 enhanced- region for is reduced relative to that at , and with this weakening of S2 a new Re minimum at starts to develop. By this minimum is well-developed and S2 is no longer observable on either side of . Hence minima at and appear just as S2 fades on their respective sides of
Transport studies (Manoharan et al., 1997) of WQWs have identified the and FQHE states as inherently 2C and stabilized by a spontaneous interlayer charge transfer. For such states, the capacitive energy that works against charge transfer is compensated by the energy gained by forming incompressible FQHE states. The state is stabilized by one layer supporting a FQHE and the other layer a FQHE; similarly for the layer fillings are and . Observation of these FQHE states in Re vs indicates the system is in a bilayer state. The appearance of bilayer-state minima just as S2 disappears at large suggests the destabilization of S2 is associated with bilayer formation.
The turn-off of S2 at large and , at which is well-defined is demonstrated in Fig. 10, which shows that S2 fades as approaches the value for the transition to bilayer. The figure shows traces of vs for various , with the transitions from S1 to S2 marked by arrows. Ranges of filling immediately next to correspond to the gaps between curves for each , and as is increased, the traces move to higher .
In Fig. 10(a) the development of S2 with increasing occurs as described above, with , S1 only at low for which the charge distribution is single-layer. On increasing to , and the traces show S2 for ( corresponds to the high- side of ) developing and growing stronger. Turning to Fig. 10(b), at , the -enhancement of S2 for is most pronounced, but further increase of results in a decrease in the size of this enhancement. Increasing from to causes the enhanced- region of S2 for to disappear as is approached. For , on the left sides of the gaps in the curves, S2 appears for and strengthens as goes to . In Fig. 10(c), the curves exhibit no sign of S2, but S2 for also disappears as approaches .
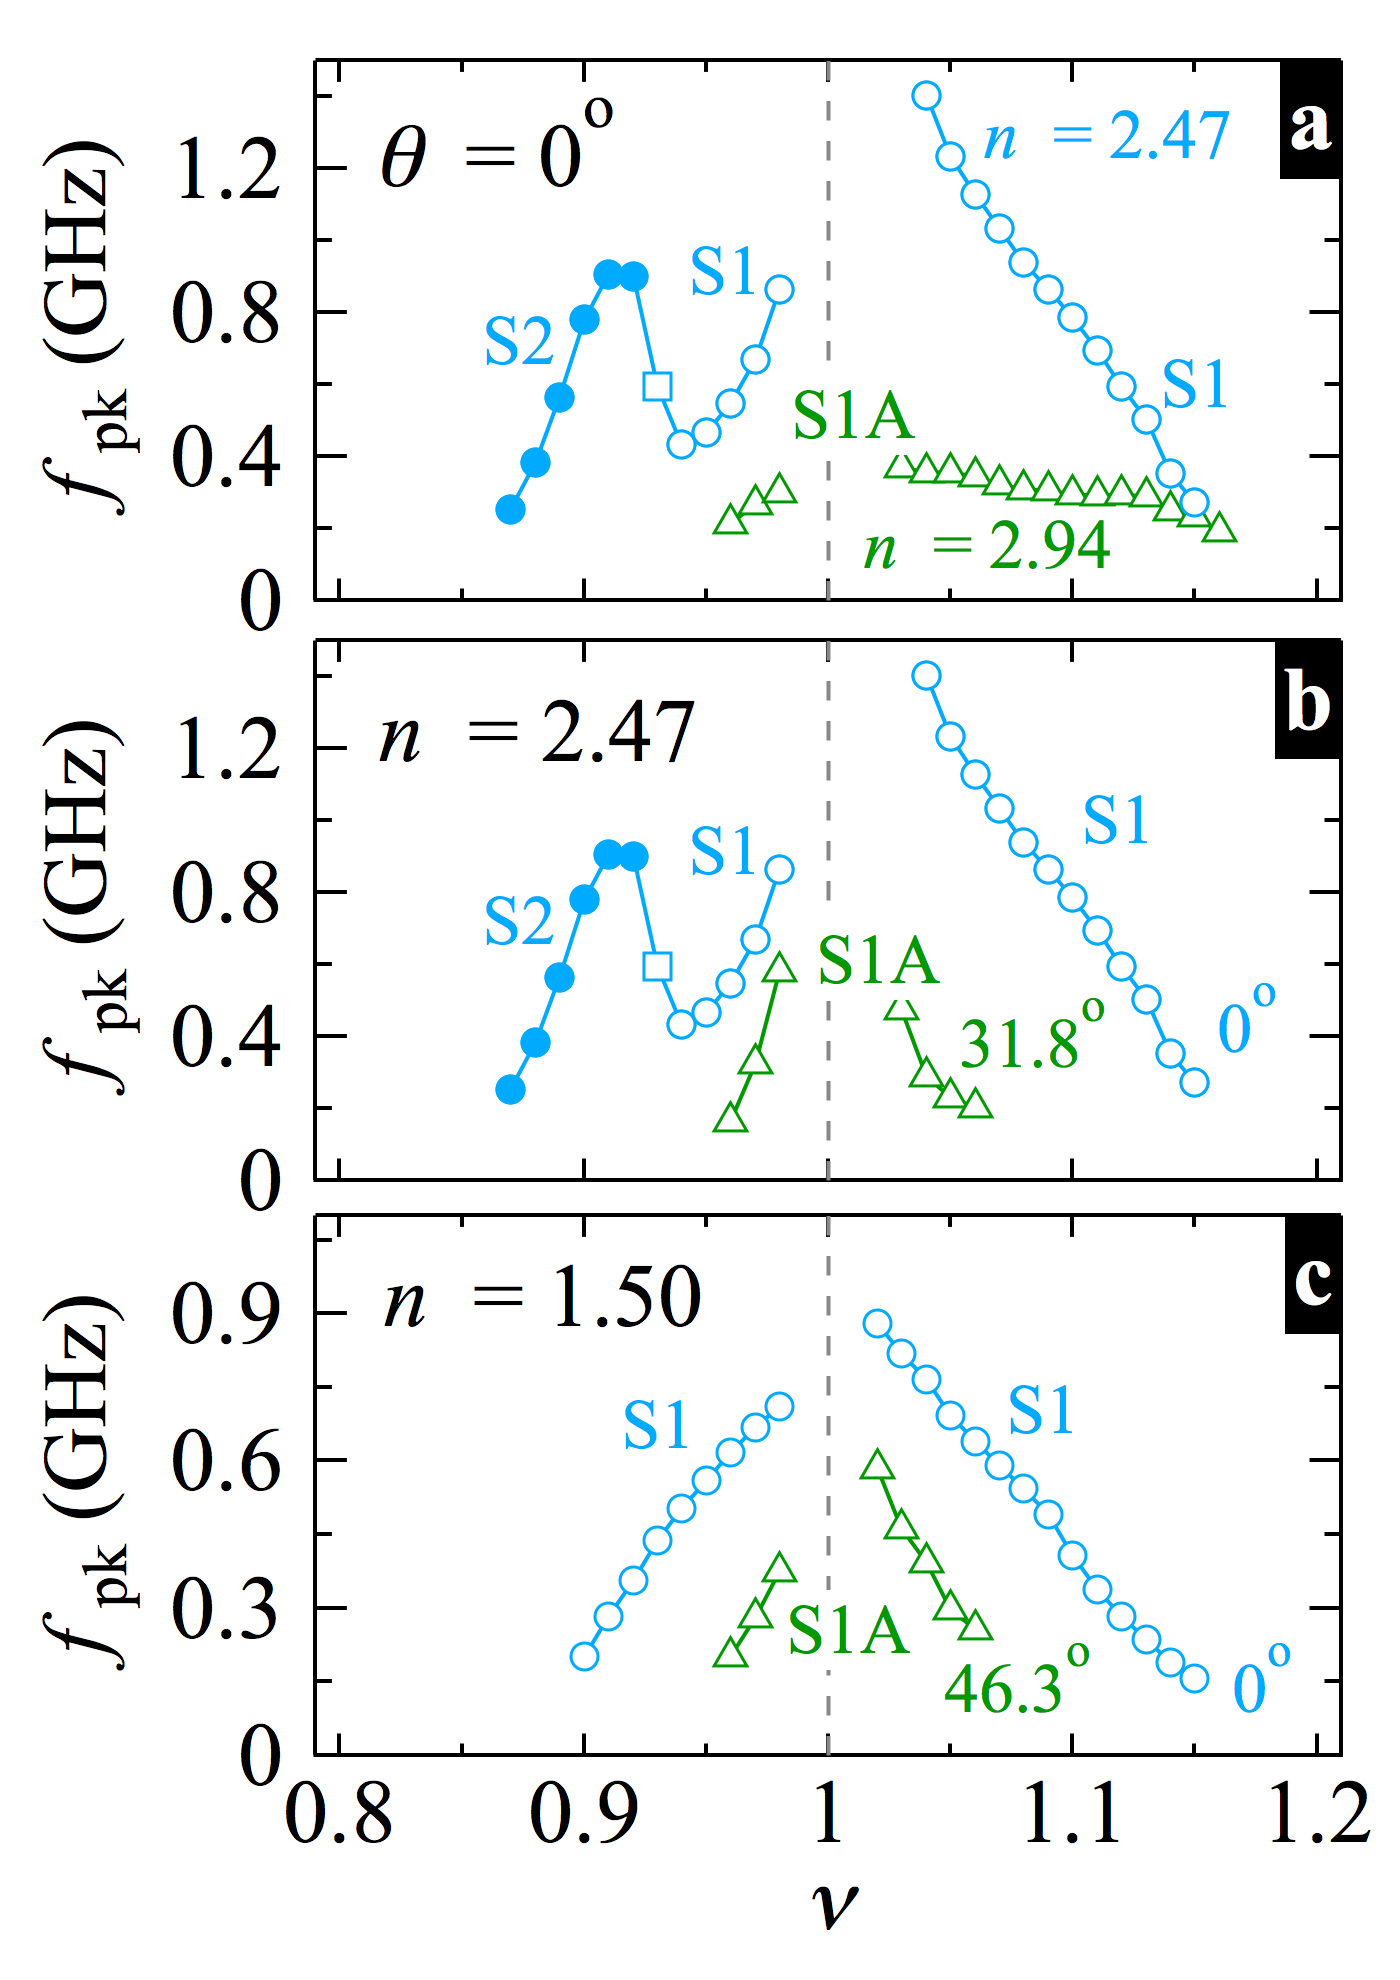
Figure 11 compares vs traces in single-layer and bilayer states. In Fig. 11(a), vs is plotted at and , for . The density is too low to show S2 for , and shows S1 and S2 for . At , has and is in the state, S2 is completely suppressed for and nearly suppressed for . It is clear that near is much smaller when the IQHE is of the type. We ascribe this reduced- resonance to a solid of quasi-particles or quasi-holes of the state, which we refer to as S1A. Figures 11(b) and (c) compare vs at and at sufficiently large to suppress S2 on both sides of . As in Fig. 11(a), in the high- cases when is bilayer, is markedly reduced from that of S1 (or S2) in the single-layer cases, and we ascribe the high- resonance to S1A. The spectra from which Fig. 11(c) is derived are shown in Figs. 4(a) and (d).
IV Discussion
Earlier microwave studiesHatke et al. (2014) showed that S2 was an extension, as approaches 1, of the RIQHE observed in transport.(Liu et al., 2012) The RIQHE is insulating as expected for a pinned solid, but does not exhibit a pinning mode resonance except in the range that we denote as supporting S2. An explanation may be that the RIQHE is a solid, but has pinning modes that are overdamped, for example by thermally excited carriers, even at our lowest working temperature. That would be consistent with the shrinking -range of the S2 resonance seen on increasing temperature, as mentioned in section III.B.
Reference Liu et al., 2014 shows that the RIQHE emerges on the high side of clear spin transitions exhibited by the 4/5 and 6/5 FQHEs as was increased. The high FQHE states alongside of which the RIQHEs develop are fully spin-polarized, composed of a fully filled 2CF level from the partly-filled higher 2CF level. The 4/5 FQHE in this picture is the interacting state of 2CFs at their filling , with the lower level fully filled, and the upper level 1/3 filled. The 6/5 state is explained the same way, taking particle-hole conjugate accounting for spin, . On the high side of the spin transition, where the RIQHE and S2 are present, the upper level has the same spin as the lower one. S2 seen here which lies closer to (which is ) than the or FQHEs is inferred also to be composed of CFs from the same levels, but with the upper level less filled. The picture advanced in Ref. Liu et al., 2014 explicitly requires interaction of CFs, as do CF WSs. The present and dependence studies on either side of show directly from the pinning mode that S2 requires a sufficiently large , consistent with the interpretation of S2 as composed of fully spin-polarized states.
If the lower level remains filled, S2 can then be thought of as composed of carriers in the partly-filled upper level. A different case of CF solid in the presence of CF liquid, quasi-particles of an FQHE liquid coexisting with that liquid, was described theoretically in Refs. Archer et al., 2013 and Archer and Jain, 2011, where it was referred to as type-2 CF WS. Such a WS, of quasi-particles and -holes of the 1/3 FQHE state, was reported from microwave spectroscopy.Zhu et al. (2010a) (Type-1 CF WS on the other hand referred to WSs without the coexisting liquid, such as can be found at the low- termination of the FQHE series.) Solids of type 2 were shown to have different wave functions than those of type I. The different and seen here for S1 and S2 raise the question of whether the underlying filled level present for S2 is affecting its wave functions or playing a role in stabilizing it when both levels have the same spin.
The different -dependences of for S1 and S2, as shown in Fig. 8, confirm our interpretation of S1 and S2 as distinct phases. In weak pinning,Chitra et al. (2001); Fertig (1999); Fogler and Huse (2000) enhanced (as for S2) is an indication of a smaller shear modulus (as in the density effect), or an increased “effective disorder”. Effective disorder is the disorder potential integrated over the charge profile for a carrier. Studies(Chen et al., 2006) of pinned WSs for well below the low- termination of the FQHE series show that the pinning affects , such that larger disorder produces both larger and higher for the same , while (which affects the shear modulus) had little effect on when was held constant in a given sample. For S2, and are enhanced relative to their values for S1 extrapolated to the larger at which S2 exists, suggesting S2 experiences larger effective disorder.
Regardless of , when is below about , S2 does not survive, and S1 prevails. In theoriesArcher and Jain (2011); Archer et al. (2013); Rhim et al. (2015) of single-layer systems, recently corroborated near in tunneling experiments,Jang et al. (2017) low favors CF crystals of larger vortex number . Applying those theories to the S1 quasi-particles and -holes near , in the range of partial filling below 0.09, . However, it is not unreasonable to assume that the -range of may be modified when the theory is applied to the case of the IQHE instead of the low- case.
Neglecting the correlations that give rise to CFs, Skyrme crystals have also been reportedBrey et al. (1995); Bayot et al. (1996); Côté et al. (1997); Zhu et al. (2010a) near . Reference Zhu et al., 2010a reported to be reduced when was small and for low , i.e. under conditions which Ref. Côté et al., 1997 discussed crystallization of spin skyrmions containing two or more spins. The reduction of in Ref. Zhu et al., 2010a was strongest for the resonances seen at the smallest , and was strongly -dependent for samples of similar to those in this work. This reduction is clearly not observed here, for example in Fig. 5(a), in which the points of smallest , in S1, have little dependence. The present QW samples, unlike the samples of Ref. Zhu et al., 2010a, are wide enough and have sufficiently high that two subbands are occupied at . It may be that the correlations of CFs overwhelm the spin skyrmion effects in the present case.
S1A, which supplants S1 in the extreme case of our measurements for large or , is taken as a WS composed of excitations of the bilayer state. It has been proposedGirvin and MacDonald (1997); Moon et al. (1995) that such excitations, for the layer separations and of the present samples, are merons connected together by a domain wall. A variety of bilayer WS phases near were considered in Ref. Bourassa et al., 2006, although those calculations apply at smaller layer separations than those of the present samples.
V Summary
To summarize, we have studied systematically the evolution with and of the solids S1 and S2 found near in WQWs. We find that S2 is an extension of the RIQHE of Refs. Liu et al., 2012 and Liu et al., 2014 to closer to 1, at which a pinning mode can be observed. The appearance of S2 as or increase is enabled by sufficiently large Zeeman energy, above 0.017, to produce a fully-polarized combined state of levels. S2 however, does not extend closer to than 0.09. At larger or , S2 disappears as the state becomes a bilayer. We also have seen pinning modes due to excitations of the state for , and find they have smaller than for S1 in single-layer states.
VI Acknowledgements
The microwave spectroscopy work at NHMFL was supported through Department of Energy Basic Energy Sciences grant DE-FG02-05-ER46212 at NHMFL/FSU. The National High Magnetic Field Laboratory (NHMFL), is supported by NSF Cooperative Agreement No. DMR-0654118, by the State of Florida, and by the DOE. The work at Princeton University was supported by the Department of Energy Basic Energy Sciences (Grant No. DE-FG02-00-ER45841) for characterization, and the National Science Foundation (Grants No. DMR 1709076 and MRSEC DMR 1420541), and the Gordon and Betty Moore Foundation (Grant No. GBMF4420) for sample fabrication.
References
- Lozovik and Yudson (1975) Y. E. Lozovik and V. I. Yudson, JETP Letters 22, 11 (1975).
- Lam and Girvin (1984) P. K. Lam and S. M. Girvin, Phys. Rev. B 30, 473 (1984).
- Andrei et al. (1988) E. Y. Andrei, G. Deville, D. C. Glattli, F. I. B. Williams, E. Paris, and B. Etienne, Phys. Rev. Lett. 60, 2765 (1988).
- Goldman et al. (1990) V. J. Goldman, M. Santos, M. Shayegan, and J. E. Cunningham, Phys. Rev. Lett. 65, 2189 (1990).
- Jiang et al. (1990) H. W. Jiang, R. L. Willett, H. L. Stormer, D. C. Tsui, L. N. Pfeiffer, and K. W. West, Phys. Rev. Lett. 65, 633 (1990).
- Williams et al. (1991) F. I. B. Williams, P. A. Wright, R. G. Clark, E. Y. Andrei, G. Deville, D. C. Glattli, O. Probst, B. Etienne, C. Dorin, C. T. Foxon, et al., Phys. Rev. Lett. 66, 3285 (1991).
- Shayegan (1997) M. Shayegan, in Perspectives in Quantum Hall Effects, edited by S. Das Sarma and A. Pinczuk (Wiley-Interscience, New York, 1997), p. 343.
- Yang et al. (2001) K. Yang, F. D. M. Haldane, and E. H. Rezayi, Phys. Rev. B 64, 081301 (2001).
- Archer et al. (2013) A. C. Archer, K. Park, and J. K. Jain, Phys. Rev. Lett. 111, 146804 (2013).
- Rhim et al. (2015) J.-W. Rhim, J. K. Jain, and K. Park, Phys. Rev. B 92, 121103 (2015).
- Deng et al. (2016) H. Deng, Y. Liu, I. Jo, L. N. Pfeiffer, K. W. West, K. W. Baldwin, and M. Shayegan, Phys. Rev. Lett. 117, 096601 (2016), URL https://link.aps.org/doi/10.1103/PhysRevLett.117.096601.
- Chen et al. (2003) Y. Chen, R. M. Lewis, L. W. Engel, D. C. Tsui, P. D. Ye, L. N. Pfeiffer, and K. W. West, Phys. Rev. Lett. 91, 016801 (2003).
- Lewis et al. (2004) R. M. Lewis, Y. Chen, L. W. Engel, D. C. Tsui, P. D. Ye, L. N. Pfeiffer, and K. W. West, Phys. Rev. Lett. 93, 176808 (2004).
- Zhu et al. (2010a) H. Zhu, G. Sambandamurthy, Y. P. Chen, P. Jiang, L. W. Engel, D. C. Tsui, L. N. Pfeiffer, and K. W. West, Phys. Rev. Lett. 104, 226801 (2010a).
- Tiemann et al. (2014) L. Tiemann, T. D. Rhone, N. Shibata, and K. Muraki, Nat. Phys. 10, 648 (2014).
- Jang et al. (2017) J. Jang, B. M. Hunt, L. N. Pfeiffer, K. W. West, and R. C. Ashoori, Nat Phys 13, 340 (2017).
- Chen et al. (2004) Y. P. Chen, R. M. Lewis, L. W. Engel, D. C. Tsui, P. D. Ye, Z. H. Wang, L. N. Pfeiffer, and K. W. West, Phys. Rev. Lett. 93, 206805 (2004).
- Zhu et al. (2010b) H. Zhu, Y. P. Chen, P. Jiang, L. W. Engel, D. C. Tsui, L. N. Pfeiffer, and K. W. West, Phys. Rev. Lett. 105, 126803 (2010b).
- Wang et al. (2012) Z. Wang, Y. P. Chen, H. Zhu, L. W. Engel, D. C. Tsui, E. Tutuc, and M. Shayegan, Phys. Rev. B 85, 195408 (2012).
- Hatke et al. (2014) A. T. Hatke, Y. Liu, B. A. Magill, B. H. Moon, L. W. Engel, M. Shayegan, L. N. Pfeiffer, K. W. West, and K. W. Baldwin, Nat. Commun. 5, 4154 (2014).
- Hatke et al. (2015) A. T. Hatke, Y. Liu, L. W. Engel, M. Shayegan, L. N. Pfeiffer, K. W. West, and K. W. Baldwin, Nat. Commun. 6, 7071 (2015).
- Hatke et al. (2017) A. T. Hatke, Y. Liu, L. W. Engel, L. N. Pfeiffer, K. W. West, K. W. Baldwin, and M. Shayegan, Phys. Rev. B p. 045417 (2017).
- Liu et al. (2012) Y. Liu, C. G. Pappas, M. Shayegan, L. N. Pfeiffer, K. W. West, and K. W. Baldwin, Phys. Rev. Lett. 109, 036801 (2012).
- Liu et al. (2014) Y. Liu, D. Kamburov, S. Hasdemir, M. Shayegan, L. N. Pfeiffer, K. W. West, and K. W. Baldwin, Phys. Rev. Lett. 113, 246803 (2014).
- Jain (2007) J. K. Jain, Composite Fermions (Cambridge University Press, Cambridge, 2007).
- Archer and Jain (2011) A. C. Archer and J. K. Jain, Phys. Rev. B 84, 115139 (2011).
- Eisenstein et al. (1992) J. P. Eisenstein, G. S. Boebinger, L. N. Pfeiffer, K. W. West, and S. He, Phys. Rev. Lett. 68, 1383 (1992).
- Murphy et al. (1994) S. Q. Murphy, J. P. Eisenstein, G. S. Boebinger, L. N. Pfeiffer, and K. W. West, Phys. Rev. Lett. 72, 728 (1994).
- Lay et al. (1994) T. S. Lay, Y. W. Suen, H. C. Manoharan, X. Ying, M. B. Santos, and M. Shayegan, Phys. Rev. B 50, 17725 (1994).
- Mueed et al. (2016) M. A. Mueed, D. Kamburov, L. N. Pfeiffer, K. W. West, K. W. Baldwin, and M. Shayegan, Phys. Rev. Lett. 117, 246801 (2016), URL https://link.aps.org/doi/10.1103/PhysRevLett.117.246801.
- Li et al. (2000) C.-C. Li, J. Yoon, L. W. Engel, D. Shahar, D. C. Tsui, and M. Shayegan, Phys. Rev. B 61, 10905 (2000).
- Fertig (1999) H. A. Fertig, Phys. Rev. B 59, 2120 (1999).
- Chitra et al. (2001) R. Chitra, T. Giamarchi, and P. L. Doussal, Phys. Rev. B 65, 035312 (2001).
- Fogler and Huse (2000) M. M. Fogler and D. A. Huse, Phys. Rev. B 62, 7553 (2000).
- Chen et al. (2006) Y. P. Chen, G. Sambandamurthy, Z. H. Wang, R. M. Lewis, L. W. Engel, D. C. Tsui, P. D. Ye, L. N. Pfeiffer, and K. W. West, Nature Phys. 2, 452 (2006).
- Lay et al. (1997) T. S. Lay, T. Jungwirth, L. Smrčka, and M. Shayegan, Phys. Rev. B 56, R7092 (1997), URL https://link.aps.org/doi/10.1103/PhysRevB.56.R7092.
- Suen et al. (1992) Y. W. Suen, L. W. Engel, M. B. Santos, M. Shayegan, and D. C. Tsui, Phys. Rev. Lett. 68, 1379 (1992).
- Suen et al. (1994) Y. W. Suen, H. C. Manoharan, X. Ying, M. B. Santos, and M. Shayegan, Phys. Rev. Lett. 72, 3405 (1994).
- Manoharan et al. (1996) H. C. Manoharan, Y. W. Suen, M. B. Santos, and M. Shayegan, Phys. Rev. Lett. 77, 1813 (1996).
- Shayegan et al. (1996) M. Shayegan, H. C. Manoharan, Y. W. Suen, T. S. Lay, and M. B. Santos, Semiconductor Science and Technology 11, 1539 (1996).
- Manoharan et al. (1997) H. C. Manoharan, Y. W. Suen, T. S. Lay, M. B. Santos, and M. Shayegan, Phys. Rev. Lett. 79, 2722 (1997).
- Hasdemir et al. (2015) S. Hasdemir, Y. Liu, H. Deng, M. Shayegan, L. N. Pfeiffer, K. W. West, K. W. Baldwin, and R. Winkler, Phys. Rev. B 91, 045113 (2015).
- Brey et al. (1995) L. Brey, H. A. Fertig, R. Côté, and A. H. MacDonald, Phys. Rev. Lett. 75, 2562 (1995).
- Bayot et al. (1996) V. Bayot, E. Grivei, S. Melinte, M. B. Santos, and M. Shayegan, Phys. Rev. Lett. 76, 4584 (1996), URL https://link.aps.org/doi/10.1103/PhysRevLett.76.4584.
- Côté et al. (1997) R. Côté, A. H. MacDonald, L. Brey, H. A. Fertig, S. M. Girvin, and H. T. C. Stoof, Phys. Rev. Lett. 78, 4825 (1997).
- Girvin and MacDonald (1997) S. M. Girvin and A. H. MacDonald, in Perspectives in Quantum Hall Effects, edited by S. Das Sarma and A. Pinczuk (Wiley-Interscience, New York, 1997).
- Moon et al. (1995) K. Moon, H. Mori, K. Yang, S. M. Girvin, A. H. MacDonald, L. Zheng, D. Yoshioka, and S.-C. Zhang, Phys. Rev. B 51, 5138 (1995), URL https://link.aps.org/doi/10.1103/PhysRevB.51.5138.
- Bourassa et al. (2006) J. Bourassa, B. Roostaei, R. Côté, H. A. Fertig, and K. Mullen, Phys. Rev. B 74, 195320 (2006), URL https://link.aps.org/doi/10.1103/PhysRevB.74.195320.