Gamma-Ray Emission from Molecular Clouds Generated by Penetrating Cosmic Rays
Abstract
We analyze the processes governing cosmic-ray (CR) penetration into molecular clouds and the resulting generation of gamma-ray emission. The density of CRs inside a cloud is depleted at lower energies due to the self-excited MHD turbulence. The depletion depends on the effective gas column density (“size”) of the cloud. We consider two different environments where the depletion effect is expected to be observed. For the Central Molecular Zone, the expected range of CR energy depletion is GeV, leading to the depletion of gamma-ray flux below GeV. This effect can be important for the interpretation of the GeV gamma-ray excess in the Galactic Center, which has been revealed from the standard model of CR propagation (assuming the CR spectrum inside a cloud to be equal to the interstellar spectrum). Furthermore, recent observations of some local molecular clouds suggest the depletion of the gamma-ray emission, indicating possible self-modulation of the penetrating low-energy CRs.
1 Introduction
The diffuse gamma-ray emission observed in the Galaxy is an ubiquitous phenomenon, which is described well by standard models of cosmic-ray (CR) interactions with the interstellar gas and photons (see e.g. Berezinskii et al., 1990, as well as Strong et al., 2004, Ackermann et al., 2012a and Acero et al., 2016). In the Galactic plane gamma rays are mainly generated by interactions of CR protons and nuclei with the interstellar gas; bremsstrahlung and inverse Compton, produced by CR electrons, also contribute to the emission. The nuclear collisions create -mesons, which immediately decay into gamma-ray photons. The rest energy of a -meson is 135 MeV, which means that the kinetic energy of CR protons in the laboratory system should be higher than MeV.
Due to the threshold in the production, a depletion in the diffuse gamma-ray spectrum at MeV should be observed. Above this energy, the diffuse flux from the Galactic plane is mainly due to proton-proton (pp) collisions. However, observations with the Fermi Large Area Telescope (LAT) in the direction of the Inner Galaxy revealed a GeV excess, i.e., the flux above predictions of the standard CR propagation and interactions model, with a peak in the spectrum around a few GeV (see Goodenough & Hooper, 2009; Vitale, 2009; Hooper & Goodenough, 2011; Abazajian & Kaplinghat, 2012; Hooper & Slatyer, 2013; Gordon, & Macías, 2013; Calore et al., 2015; Zhou et al., 2015; Ajello et al., 2016; Daylan et al., 2016). Carlson et al. (2016) pointed out that the value of excess depends on the assumed spectrum of CRs in the Galactic Center (GC).
A possible interpretation of the GeV excess is the annihilation of DM around the GC (see, e.g., Hooper & Goodenough, 2011; Gherghetta et al., 2015; Kaplinghat et al., 2015). This interpretation is based on the fact that the hypothetical DM distribution in the Galaxy has a spherically symmetric density distribution with a peak at the GC (see e.g. Berezinskii et al., 1992; Navarro et al., 1996, for a general review see Bergström, 2012). Millisecond pulsars were also suggested as sources of the excess from the GC (see e.g. Fragione et al., 2018; Gordon, & Macías, 2013; Arca-Sedda et al., 2017; Bartels et al., 2018; Hooper & Linden, 2018), although CR interactions with the gas and photons cannot be excluded either (see e.g. Yang & Aharonian, 2016; Campbell et al., 2017).
Recently, a self-consistent model of CR modulation in dense molecular clouds was proposed by Ivlev et al. (2018) (denoted below as Paper I). While the inner structure of molecular clouds could be quite complex, in that paper we considered a simplified model of a cloud, consisting of a core with a high gas density and a diffuse surrounding envelope. The core was assumed to absorb completely the penetrating CR flux. It was shown that the modulation of the flux occurs due to CR scattering on self-generated turbulence, excited by propagating CRs in the diffuse envelope. In the present paper we generalize the theory of Paper I and investigate whether this can explain gamma-ray features observed in the GC and local molecular clouds. In Section 2 we discuss the available observations of gamma-ray emission from GC and local molecular clouds, and briefly analyze the processes that can affect the emission due to CR protons. In Section 3 we summarize important results of the model of Paper I, which are necessary to calculate the expected depletion of the gamma-ray spectrum, and investigate modifications introduced due to the finite cloud size and heavy CR species. In Sections 4 and 5 we present the results of our calculations for the Central Molecular Zone (CMZ) and local clouds, respectively, pointing out the expected features of the gamma-ray emission. Finally, in Section 6 we summarize our major findings.
2 Diffuse gamma-ray emission
The CMZ is a region with some of the most dense molecular clouds. More than 90% of its mass is concentrated in very dense clouds (cores) of the average density over cm-3 on the scale about several pc (see e.g. Launhardt et al., 2002; Ginsburg et al., 2016). Compared to the clouds in other parts of the Galactic Disk, these clouds show unusually shallow density gradients (see Kauffmann et al., 2017). On the other hand, the CMZ volume is mostly filled with a diffuse gas (envelope) surrounding the cores, with the density of cm-3 (see Oka et al., 2005; Le Petit et al., 2016; Riquelme et al., 2018).
Thus, in the context of interactions with Galactic CRs, the CMZ can be treated as a very large cloud of the characteristic size of pc (see Ferrière et al., 2007). The gas mass is concentrated in a single dense core with the line-of-sight column density cm-2, surrounded by a diffuse envelope with the gas density of less than cm-3. At a distance of 8.5 kpc to the GC, the core has the angular size of , i.e., comparable to the spatial resolution of the Fermi LAT at GeV. Therefore, it is a challenging task to separate the emission generated by CRs in molecular clouds of the CMZ from other gamma-ray sources, including Sgr A∗.
The CMZ region contains several GeV point sources of unknown origin (see the Fermi source catalog Acero et al., 2015). For example, Malyshev et al. (2015) concluded that the spectrum of one of these sources in the direction of Sgr A∗ does not show a turnover at MeV energy, expected for gamma rays originating from -decay. One of the explanation is that this emission is produced by high-energy electrons emitted by the central source (see e.g. Malyshev et al., 2015; Chernyshov et al., 2017, and references therein). Observations with the HESS telescope suggest that Sgr A∗ is a source of PeV CRs (see Abramowski et al., 2016).
Also, CRs can be locally produced in the CMZ when a supernova shock interacts with a nearby cloud, generating a gamma-ray flux from the cloud. Several such sources were found by Fermi-LAT (see e.g. Uchiyama et al., 2010). This component of the CMZ gamma-ray emission correlates with the star formation regions (Carlson et al., 2016) and may also contribute to the total flux. Moreover, CRs of relatively low energies (up to hundreds MeV or several GeV) can be directly accelerated inside molecular clouds, e.g., in the inner regions of collapsing molecular clouds or circumstellar discs (Padovani et al., 2016, 2018), but their contribution into the total CMZ flux still needs to be analyzed.
Another source of gamma-ray emission from the GC region may be the Fermi bubbles (see Su et al., 2010; Ackermann et al., 2014). In this case, the emission could be produced by CR protons which are generated in the star-forming regions of CMZ and transported into the halo by a strong wind (see Crocker & Aharonian, 2011; Crocker et al., 2011). Alternatively, the emission could be due to CRs which are accelerated at the Bubble edges by a shock resulting from stellar accretion onto the central black hole in the past (see Cheng et al., 2011, for the review of Bubble models, see also Yang et al. 2018). The presence of the wind is detected by the observation of UV absorption lines (see Karim et al., 2018, and references therein) independently of the model of the Fermi bubbles. This wind may modulate the CR spectrum in the inner Galaxy.
In addition to CMZ observations, the possible modulation of CR spectra at lower energies may be deduced from observations of local molecular clouds, with the advantage that gamma-ray emission produced in such objects is measured directly (see Yang et al., 2014; Neronov et al., 2017; Remy et al., 2017). However, we should take into account a substantial difference between the physical parameters of the CMZ and of local molecular clouds, in particular the fact that the gas column density of local clouds does not exceed cm-2. Therefore, special conditions are needed for the CR modulation in the latter case, as discussed in Section 5.
We remind the reader that the goal of this paper is to focus specifically on the effect of self-modulation of CRs, occurring upon their penetration into molecular clouds, on the resulting gamma-ray emission. As we pointed out above, this effect is one of the many other effects (such as the local sources of CRs and the wind) that influence the resulting CR spectrum. A comparison of the importance of the different effects that shape the spectrum of CRs near the GC is postponed to a future work. At the moment, the self-modulation effect is not included in the CR propagation codes, such as GALPROP (Vladimirov et al., 2011).
2.1 Analysis of gamma-ray emission in the direction of CMZ and above
For gamma-ray emission produced due to the interaction of CRs with molecular clouds of the CMZ, one would also expect to observe the spectral variations in the direction perpendicular to the Galactic Plane. In particular, de Boer et al. (2017) claimed that there exists a change in the spectrum of the Galactic gamma-ray emission as a function of the latitude. They assumed that the gamma-ray emission produced by CR protons consists of two components. One is generated inside molecular clouds, by “modulated” CRs with the energy spectrum which is harder than that in the interstellar medium; the other is generated outside the clouds, with the CR spectrum similar to that near the Earth. According to their model, the “excess” emission is seen directly from the CMZ ( and , where a significant fraction of molecular hydrogen is concentrated), with the energy flux of GeV s-1 cm-2 at GeV. In their analysis they have not found any evidence for the GeV excess.
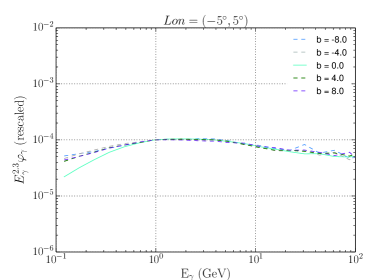
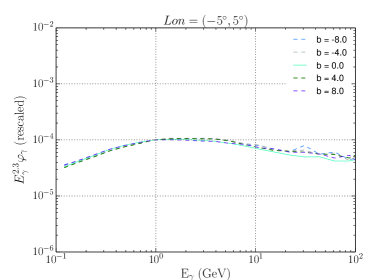
In Figure 1 we present the rescaled latitude profile of the gamma-ray data above and below the GC after subtracting the contribution of point sources and isotropic emission. In this plot, we use the same data sample as in Ackermann et al. (2017), i.e., 6.5 years of Pass 8 UltraCleanVeto Fermi-LAT data. The point sources are modeled using the 3FGL catalog (see Acero et al., 2015) with an overall rescaling factor determined in the Sample model of Ackermann et al. (2017). The isotropic emission model is also taken from the Sample model of Ackermann et al. (2017). The upper panel shows the latitude profile of the gamma-ray data after subtraction of emission from point sources and isotropic emission. Although there is an apparent variation in the spectra at low energies, one has to take into account the increase of the point spread function (PSF) in this case. The 68% containment is worse than at MeV, reaching about at MeV, which is larger than the width of the latitude stripes in the plot. Since the gamma-ray emission is the brightest within from the Galactic Plane, the smearing of the data due to angular resolution results in a depletion of the observed number of photons in the plane (relative to the expected flux with perfect angular resolution). By the same token, the photons which leak from the plane will contaminate the flux at low energies at higher latitudes. In order to correct for these effects, we calculate the correction coefficients for each energy bin and each latitude stripe, by taking the ratio of the counts in Galactic diffuse gamma-ray emission model before and after the PSF convolution of the model (we use the Sample model of Ackermann et al., 2017). The data multiplied by the correction coefficients is shown in the lower panel of Figure 1.
One can see that the spectra of the Galactic diffuse gamma-ray emission at different latitudes are consistent with each other at low energies after the PSF correction. Several groups have studied the gamma-ray emission correlated with the gas distribution in the inner Galaxy (Ackermann et al., 2012a; Calore et al., 2015; Gaggero et al., 2015; Acero et al., 2016; Ajello et al., 2016; Daylan et al., 2016). Although at high energies some differences are observed in the emissivity in the inner Galaxy compared to the average emissivity (Gaggero et al., 2015; Acero et al., 2016), there is no appreciable hardening of the spectrum at lower energies, which is consistent with the lower panel of Figure 1. This implies that available Fermi data do not allow us to draw reliable conclusions on possible modulation of CR proton spectrum. We anticipate that data with a substantially higher resolution will be available with the next low-energy gamma-ray missions, such as ASTROGAM (see De Angelis et al., 2017) or AMEGO (e.g., Hartmann, 2018).
The other problem of interpretation of diffuse gamma-ray flux from the CMZ is that it is model-dependent. The above-mentioned GeV excess was determined by subtracting (from the total observed flux) contributions of gamma-ray sources and known components of gamma-ray emission generated by CRs, which were calculated from models of CR propagation in the Galaxy (e.g., GALPROP, see Vladimirov et al., 2011). After the subtraction, a relatively small (but statistically significant) component of emission is seen in the GC region, with the energy flux of GeV s-1 cm-2 at GeV, which stretches to or even radius from the GC (see Hooper & Slatyer, 2013; Calore et al., 2015). Calore et al. (2015) and Ackermann et al. (2017) have pointed out that excesses of similar magnitude as in the GC are observed in other locations along the Galactic Plane. As a result, the DM interpretation cannot be robustly confirmed.
3 Self-consistent model of CR penetration into dense molecular clouds
Attempts to analyse variations of CR spectra inside molecular clouds were undertaken long before the excess discovery. Several mechanisms may cause these variations, such as particle acceleration inside and near molecular clouds (Morfill, 1982a, b; Dogiel et al., 1987; Dogel′ & Sharov, 1990), or modulation of the CR flux by MHD turbulence excited in diffuse envelopes (Skilling & Strong, 1976; Cesarsky & Völk, 1978; Everett & Zweibel, 2011; Morlino & Gabici, 2015; Schlickeiser et al., 2016; Dogiel et al., 2015; Ivlev et al., 2018; Phan et al., 2018).
Skilling & Strong (1976) predicted from a qualitative analysis of the problem a depletion of CR density inside the clouds. They concluded that Alfven waves, generated by streaming CRs outside the clouds, suppress penetration of CRs with energies below a few hundred of MeV. They mentioned also that GeV CRs could also be excluded, especially if their density near the clouds is increased. This statement was confirmed by our analytical and numerical calculations (Paper I). Our investigations showed also that the flux penetrating into very dense clouds (where CRs are fully absorbed) has a universal energy dependence – it is exclusively determined by the densities of ionized and neutral components of the cloud envelopes. Furthermore, in Paper I we provided a detailed analysis of the CR-induced MHD turbulence near the clouds and determined the region where the turbulence is excited. We showed that the turbulence leading to the universal flux can be generated either due to CR absorption in a vicinity of dense cloud, or due to energy losses by CRs in the outer part of the envelope. In both cases, the turbulence makes the spectrum of low-energy CRs harder and independent from that in the interstellar medium.
Let us summarize the principal results of Paper I, which are important for the analysis of gamma-ray emission presented in Sections 4 and 5. If the kinetic energy of CRs penetrating into a cloud exceeds a certain excitation threshold , their flux is not modulated, i.e., the propagation of such CRs through the cloud envelope occurs in a free-streaming regime. For , the CR propagation is diffusive – due to efficient pitch-angle scattering on the self-excited MHD turbulence, the mean free path of CRs is smaller than the relevant spatial scale, and their pitch-angle distribution becomes quasi-isotropic. The resulting CR flux is usually strongly modulated.
The threshold for CR protons can be derived from the balance of the growth rate of MHD waves (calculated in the free-streaming regime of CR propagation) and the damping rate due to ion-neutral collisions (Paper I):
| (1) |
where is the dimensionless kinetic energy normalized by the proton rest-mass energy, and is the dimensionless energy spectrum of interstellar CRs, normalized by its characteristic value . The threshold is determined by two dimensionless numbers, the damping rate and small parameter (ratio of the Alfven velocity to the speed of light). The scaling dependence of and on the physical parameters of the envelope is given by the following general expressions:111We note that in Paper I, Equation (23), there is a misprint in the normalization factor of .
| (2) | ||||
| (3) | ||||
where is the average mass of gas particles, and is the density of gas particles and ions, respectively, and is the magnetic field strength.
The modulated CR flux (per unit area and unit energy interval), propagating through the envelope and entering the dense interior of the cloud, is given by
| (4) |
where is the differential density of interstellar CRs and is a measure of the relative importance of diffusion and advection in the modulated flux: For the flux is dominated by diffusion, while for large the interstellar CR density is advected with the Alfven velocity . As we showed in Paper I, the value of in Equation (4) can be approximately presented as
| (5) |
valid as long as (otherwise, its value is unimportant for calculating the flux).
All results presented in sections below are obtained for the following energy spectrum of interstellar CR:
| (6) |
where corresponds to the local spectrum of CR protons. Equation (6) was derived from the local gamma-ray emissivity using the pp cross section from Kafexhiu et al. (2014) and Kafexhiu (2016), with the emissivity estimated by Casandjian (2015) from high-latitude Galactic gamma-ray emission (see also Strong, 2015).
3.1 Effect of finite cloud size and heavier CR species
First, we need to take into account that dense clouds have finite sizes, and therefore most of the penetrating CRs cross the clouds without absorption. The flux velocity of these CRs, which are assume to stream freely through the cloud, is not equal to their physical velocity , but to a certain smaller value determined by the cloud size. One can easily evaluate for relativistic protons, where the pion production losses dominate (for lower energies, also ionization losses can be added, see Appendix A): The flux of CRs entering a cloud from either size (along the local magnetic field lines) is approximately equal to , where is the local density of incident CRs. The density of CRs that crossed the cloud is attenuated due to pp collisions, ; it is determined by the product of the pion production cross section, , and the effective column density of the cloud, . Then the flux velocity at the cloud edge is
| (7) |
where we took into account that the product is typically a small number. Since the growth rate of MHD waves excited by free-streaming CRs is proportional to their flux, we immediately conclude that the left-hand side (lhs) of Equation (1) should be multiplied by a small factor of . Hence, the excitation threshold is reduced for a finite cloud size (i.e., is a certain increasing function of , its form is determined by the interstellar CR spectrum).
Next, we consider the effect of finite cloud size on the flux in the diffusive regime, , where CRs are self-modulated while propagate through an envelope toward a dense cloud. For a perfectly absorbing wall studied in Paper I (see Figure 1 of of that paper), is described by Equation (4); the local CR density gradually decreases as particles approach the wall located at , and therefore the local flux velocity increases. For a finite cloud size, the latter cannot exceed the velocity in the free-streaming regime, given by Equation (7). Therefore, the problem can be analyzed exactly in the same manner as in Paper I, with the only difference that the boundary condition at the cloud border is given by
| (8) |
This implies that the CR density at is higher than that in the absorbing-wall case (by a factor of for relativistic CRs).222The physical reason for this enhancement is that particles in a finite-size cloud have to be trapped for their attenuation time. The resulting modulated CR flux, corrected for the “inner” boundary condition (8), is
| (9) |
As in Equation (4), tends to the advection asymptote for , whereas for the flux has the universal diffusion-dominated form (Equation (42) of Paper I) limited by the maximum value of .
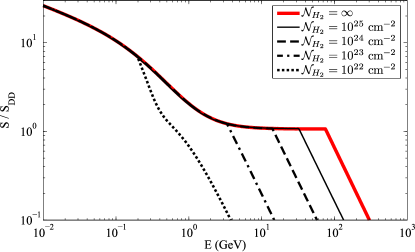
In Figure 2 we show the ratio of the total modulated flux (penetrating into the cloud), , to its universal component, . The solid line represents the case of a perfectly absorbing wall, the other lines show cases of finite-size clouds. One can see that for sufficiently large values of the flux is universal in a rather broad energy range (below , where the curves are practically horizontal), as expected from the excitation-damping balance. For smaller the balance is violated and the flux approaches the advection asymptote.
The excitation threshold for finite values of is derived from the modified Equation (1). For sufficiently large values of , the threshold is in the relativistic energy range, where . In this case, can be determined from a simple scaling dependence,
Instead of the rest-mass energy, we chose GeV as a convenient energy scale for this case, so that the CR spectrum is normalized by . We point out that the effect on the gamma-ray emission is only observable if exceeds a certain value (which, obviously, cannot be smaller than the pion production threshold of MeV). In practice, gamma-ray emission should be modified at MeV, which roughly corresponds to GeV. In Table 1 we present the threshold values of the effective column density, , needed to reach the excitation threshold of GeV for given values of the gas density and the magnetic field in the envelope.
| 0.06 | 0.07 | 0.34 | 1.65 | 11 | |
| 0.15 | 0.14 | 0.36 | 1.65 | 11 | |
| 0.44 | 0.32 | 0.46 | 1.7 | 11 | |
| 1.3 | 0.9 | 0.75 | 1.9 | 11 |
Finally, we notice that about 10% of interstellar CRs are helium nuclei and heavier ions. The rate of wave excitation by nuclei of charge is given by Equation (A1) of Appendix A. The absorption of heavier CR nuclei in a dense cloud is dominated by their spallation, with the cross section
| (11) |
where is the atomic mass number (see e.g. Mannheim & Schlickeiser, 1994). This makes the corresponding flux velocity higher than that of protons. A detailed analysis presented in Appendix A shows that the resulting effect of heavier species on the wave excitation can be substantial.
4 CR modulation and gamma-ray emission in the CMZ region
The density of CRs in the CMZ region is not known, although estimates suggest that it can be a factor of a few larger than the local interstellar spectrum (see Yang et al., 2015; Acero et al., 2016). We assume that the proton spectrum near CMZ is five times the local spectrum given by Equation (6), and use the following reasonable parameters of the CMZ region: the gas density in the envelope cm-3, the magnetic field strength G, and the effective CMZ column density cm-2.
By applying the self-consistent model developed in Paper I, and including the corrections discussed in Section 3.1, we calculate the CR proton spectrum in the CMZ. The solid line in Figure 3 shows the results for the case where effects of heavier CR species is neglected, Equation (9). The effect of heavier CRs is also illustrated: one can see that the peak at becomes smoother, and the position of the excitation threshold shifts to higher energies. The curve representing all elements includes contributions of nuclei whose excitation amplitude exceeds the value of 0.1 (see Appendix A and Table 2 therein).

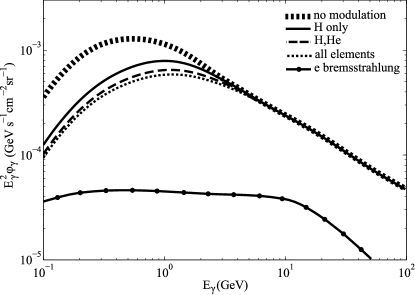
Using the derived spectra of CRs, the expected gamma-ray flux from the CMZ can be calculated as
| (12) | |||||
where the differential cross section of the photon production due to the decay, , is taken from Kafexhiu et al. (2014) and Kafexhiu (2016), the bremsstrahlung cross sections, , are from Blumenthal & Gould (1970) for the electron-nuclear interactions and from Haug (1988) for the electron-electron interactions. Figure 4 shows the calculated . We see that the gamma-ray flux due to the modulated CRs differs significantly from the results derived in the framework of the standard approach (no modulation). The peak of gamma-ray emission shifts to higher energies, and its position depends on the gas density in the envelope and the density of interstellar CRs.
The presented results suggest that the procedure used for calculating the CR contribution to the total gamma-ray flux should be revised for the CMZ region. We point out, however, that the expected effect, shown in Figure 4, cannot be reliably confirmed or discarded with the available data, due to their poor resolution at GeV (see Section 2).
5 Gamma rays from local molecular clouds
The effect of CR modulation discussed above can, in principle, be observed in local molecular clouds. These clouds are located at distances of a few hundreds of pc from the Earth and, therefore, are spatially resolved with the Fermi-LAT telescope. If present, the modulation effect should manifest itself with a decreased gamma-ray emissivity at lower energies inside the cloud, as compared to the interstellar emissivity.
Recent publications on gamma-ray emission from local clouds (see Yang et al., 2014; Neronov et al., 2017; Remy et al., 2017) presented rather controversial conclusions about the density of CRs inside the clouds. While Neronov et al. (2017) and Remy et al. (2017) did not find any difference between the local CR spectrum near the Earth and that inside the clouds below 18 GeV, Yang et al. (2014) claimed a significant modulation of CR density at energies below 10 GeV in several clouds (as identified from the Pamela data).
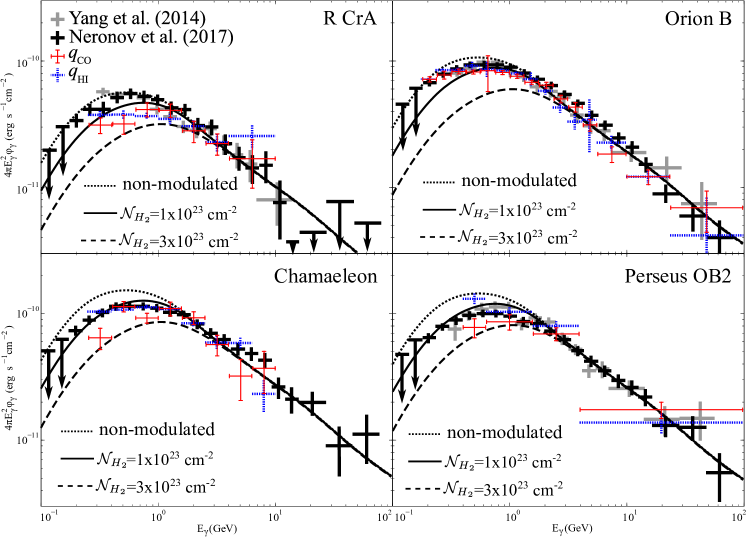
In Figure 5 we plot the gamma-ray fluxes obtained by Yang et al. (2014) for the clouds R CrA, Orion, and Perseus OB2 (thick gray crosses), and compare these with the unmodulated flux calculated for the CR spectrum defined in Equation (6) (dotted lines). We also show the data from Neronov et al. (2017) for these clouds and for the cloud Chamaeleon (thick black crosses), normalized to the unmodulated flux at 10 GeV. One can see that the data for clouds R CrA and Orion do not reveal significant modulation, while for Perseus and Chamaeleon the effect is visible.
For several clouds, measurements of atomic hydrogen emissivity and molecular gas emissivity (traced by CO emission lines) are available (e.g. Ackermann et al., 2012b, 2013; Remy et al., 2017). Since the gas in the outer diffuse regions of the clouds is atomic, while the molecular gas is concentrated in the dense cores, the emissivity characterizes the CR spectrum in the cloud envelopes, and is a measure of the CR spectrum inside the clouds. Comparison of with gives us a direct estimate of the modulation inside a cloud, independent of possible variations of the interstellar spectrum across the Galaxy. In Figure 5 we presented gamma-ray fluxes for clouds R CrA (Ackermann et al., 2012b), Orion (Remy et al., 2017), Chamaeleon (Ackermann et al., 2013), and Perseus (Remy et al., 2017), deduced from (thin blue crosses) and (thin red crosses). Again, we see that R CrA and Orion do not show significant modulation (which is also the case for most of the clouds analyzed in these papers), while for Chamaeleon and Perseus a marginal modulation effect is present at lower energies.
We recall that, according to our model, the excitation threshold is a function of the effective column density , measured along the magnetic field line. In Figure 5 we illustrate the expected modulation effect for cm-2 (solid line) and cm-2 (dashed line). For example, the substantial difference between the modulated and non-modulated fluxes for Chamaeleon and Perseus can be explained if the effective column density is of the order of cm-2. We point out that may significantly exceed the values deduced from the line-of-sight measurements, since the magnetic field lines in molecular clouds can be twisted (see e.g. Dogiel et al., 1987; Padovani et al., 2009), or the clouds can be elongated along the field lines, and the magnetic field can thread multiple molecular clouds (Ade et al., 2015). However, all these effects require separated analysis (see, e.g., Silsbee et al., 2018), which is beyond the scope of our paper.
Thus, there are evidences of the modulation effect in local molecular clouds. Several observations of gamma-ray emission from the clouds indicate the depletion of CR density at lower energy, as suggested in Section 3. We hope that future observations will provide information for more reliable analysis.
6 Conclusions
We investigated the effect of finite-size molecular clouds on the energy spectrum of the penetrating CRs, and on the resulting gamma-ray emission. The conclusions of the paper can be summarized as follows:
-
•
The energy dependence of self-modulated CR flux penetrating into a cloud is exactly the same as in Paper I: For sufficiently high effective column densities, the flux has the universal form , independent of the interstellar CR spectrum. For lower column densities, the nonlinear wave cascade becomes important and the flux velocity approaches the Alfven velocity ;
-
•
The probability of relativistic CRs to be absorbed in a finite-size molecular cloud, characterized by the column density , is typically small and equal to , where is the effective cross section of the pion production. The resulting velocity of the CR flux entering the cloud is . This leads to a significant reduction of the increment of MHD wave excitation, and therefore makes the value of the excitation threshold energy (below which the CR flux is modulated) smaller than in the case of a perfectly absorbing wall (Paper I);
-
•
The density of modulated CRs inside a finite-size central core, between the two turbulent regions self-generated in a diffuse envelope, is . Typically, this is much larger than the CR density in a perfectly absorbing core, , though in both cases these values are still significantly smaller than the interstellar density ;
-
•
For typical parameters of the CMZ, the self-modulation of penetrating CRs is expected in the energy range below GeV. The resulting modulation of gamma-ray flux occurs at energies below GeV;
-
•
The phenomenon of self-modulation should be taken into account when evaluating the GeV excess in the total gamma-ray emission produced in the GC. We showed that the emission due to self-modulated CRs may substantially deviate from predictions of the standard model of CR propagation in the Galaxy (e.g., GALPROP, Vladimirov et al., 2011). This implies that both the value and the form of the “GeV excess” – obtained after subtracting different components (including that generated by CRs) from the observed emission – may be quite different from what is currently believed;
-
•
The worsening spatial and energy resolution of the Fermi-LAT telescope at energies below GeV does not allow us to draw reliable conclusions about the intensity and spectrum of gamma-ray emission from the CMZ region. Furthermore, disentangling of the emission due to the interaction of CR protons and CMZ gas from other gamma-ray sources in the GC, including Sgr A∗, is a challenging task with the available resolution. We note that the GC environment is unique, and it is currently difficult to definitively determine the interplay between CR modulation and several additional complexities in the GC (see Section 2);
-
•
The effect of CR self-modulation in the gamma-ray emission can possibly be detected by observing nearby molecular clouds, located at distances of a few hundred pc from Earth and, therefore, resolvable with the Fermi-LAT telescope. While there are indications of this effect for several nearby clouds, observable depletion of the emission is predicted to occur only for as high as cm-2. This is much larger than typical line-of-sight column densities of less than cm-2, as derived from CO observations. On the other hand, the effective column density is likely to significantly exceed the values deduced from the line-of-sight measurements and, hence, to reach the values needed for observable depletion of the emission.
Acknowledgments
The authors are grateful to Wim de Boer for fruitful discussions, and to Isabelle Grenier, Tsunefumi Mizuno, and Luigi Tibaldo for helpful comments on measurements of gamma-ray emission in molecular clouds. VAD and DOC are supported by the grant RFBR 18-02-00075. DOC is supported in parts by foundation for the advancement of theoretical physics “BASIS”. KSC is supported by the GRF Grant under HKU 17310916. The authors also would like to thank the anonymous referee for constructive comments.
.
Appendix A A. Modulation of CR flux with multiple nuclei
The spectra of CRs include different nuclei. Although the proton abundance is about 90%, the effect of heavier nuclei on the excitation of MHD-waves should also be taken into account. The rate of the wave excitation by CR species with the charge is (see, e.g. Kulsrud & Pearce, 1969)
| (A1) |
Here, is the flux of nuclei in the diffusive regime of CR propagation, and is the magnetic rigidity, which is proportional to the momentum of a nucleus. The use of the rigidity in Equation (A1) is convenient, since it is related to the resonant wave number via (independent of ). Furthermore, this allows us to utilize CR databases (presented in units of ), assuming that the spectra of protons and heavier nuclei have the same dependence on .
The modulated CR flux , given by Equation (9), depends on two parameters, and . By using the definition of from Paper I (see Equation (27) of that paper) and expressing it through , we obtain that , where and correspond to protons and is the velocity of nucleus :
| (A2) |
where and is the atomic mass number. Thus, we can write , where
| (A3) |
is a numerical factor, varying between for and for .
The density is related to the corresponding energy spectrum via , while the relation between the spectra per unit energy and rigidity is (in the ultra-relativistic case). This yields
| (A4) |
where is the dimensionless interstellar spectrum and has to be expressed in terms of . We assume that the energy spectra for all CR species are given by Equation (6), where should be replaced by the effective dimensionless energy . The abundances of CR nuclei from the CRDB database (Maurin et al., 2014) are summarized in Table 2, where we list the species important for the wave excitation, as explained below.
If we include contributions of all CR species into the process of MHD-wave excitation, the excitation-damping balance at the outer bound of the diffusion zone (cf. rhs of Equation (29) in Paper I) becomes
| (A5) |
where and the relation is taken into account. The flux velocity of species is determined by a combination of the catastrophic and continuous energy losses,
| (A6) |
where is the total cross section of catastrophic (spallation) collisions, related to the pp cross section by Equation (11), and is the continuous (ionization) loss function; the factor is determined by the form of the local CR spectrum at the cloud edge. In the relativistic case, where the catastrophic losses dominate, the flux velocities are
| (A7) | |||||
| (A8) |
where . Equation (A5) can be resolved for as a function of rigidity, which allows us to calculate the CR spectra from Equation (9). For very dense clouds, the flux velocities are about the respective physical velocities and hence . Then, for small values of , one can expand the exponentials in the denominator of Equation (A5) (and set them equal to unity in the numerator). This leads to an analytical expression for , which is a straightforward generalization of Equation (5) for multiple CR species (taking into account the above relation between and ).
| Element | at GV, | |||
| (m2 s sr)-1 | ||||
| H | 1 | 1 | 78 | 1 |
| He | 2 | 4 | 15 | 1.5 |
| C | 6 | 12 | 0.49 | 0.32 |
| O | 8 | 16 | 0.48 | 0.5 |
| Mg | 12 | 24 | 0.08 | 0.17 |
| Si | 14 | 28 | 0.07 | 0.19 |
| Fe | 26 | 56 | 0.07 | 0.59 |
Equation (A5) with the condition yields the excitation threshold expressed in terms of the rigidity (which then can be converted into the energy excitation thresholds for each CR species). The resulting equation for is
| (A9) |
where is the partial “excitation amplitude”. For protons , while for heavier nuclei it is
| (A10) |
The value of characterizes the relative contribution of CR species to the wave excitation, in Table 2 we list all species with . Again, for very dense clouds we have and , and then Equation (A9) leads to a simple generalization of Equation (1) for multiple species.
References
- Abazajian & Kaplinghat (2012) Abazajian, K. N., & Kaplinghat, M. 2012, PhRvD, 86, 083511
- Abdalla et al. (2017) Abdalla, H., Abramowski, A., Aharonian, F. et al. [H.E.S.S. Collaboration] 2018, A&A, 612, A9
- Abramowski et al. (2016) Abramowski, A., et al. [H.E.S.S. Collaboration] 2016, Nature, 531, 476
- Acero et al. (2015) Acero, F., Ackermann, M., Ajello, M. et al. 2015, ApJS, 218, 23
- Acero et al. (2016) Acero, F., Ackermann, M., Ajello, M. et al. 2016, ApJS, 223, 26
- Ackermann et al. (2012a) Ackermann, M., Ajello, M., Atwood, W. B. A. et al. 2012a, ApJ, 750, 3
- Ackermann et al. (2012b) Ackermann, M., Ajello, M., Allafort, A. et al. 2012b, ApJ, 755, 22
- Ackermann et al. (2013) Ackermann, M., Ajello, M., Allafort, A. et al. 2013, ApJ, 778, 82
- Ackermann et al. (2014) Ackermann, M., Albert, A., Atwood, W. B. et al. 2014, ApJ, 793, 64
- Ackermann et al. (2017) Ackermann, M., Ajello, M., Albert, A. et al. 2017, ApJ, 840, 43
- Ajello et al. (2016) Ajello, M., Albert, A., Atwood, W. B. et al. 2016, ApJ, 819, 44
- Ade et al. (2015) Ade, P. A. R., Aghanim, N., Alina, D. et al. [Planck Collaboration] 2015, A&A, 576, A106
- Arca-Sedda et al. (2017) Arca-Sedda, M., Kocsis, B., & Brandt, T. 2017, arXiv:1709.03119
- Bartels et al. (2018) Bartels, R., Calore, F., Storm, E., & Weniger, C. 2018, arXiv:1803.04370
- Berezinskii et al. (1990) Berezinskii, V. S., Bulanov, S. V., Dogiel, V. A., Ginzburg, V. L., & Ptuskin, V. S. 1990, Astrophysics of Cosmic Rays, ed. V.L.Ginzburg, (Norht-Holland, Amsterdam)
- Berezinskii et al. (1992) Berezinsky, V. S., Gurevich, A. V., & Zybin, K. P. 1992, PhLB, 294, 221
- Bergström (2012) Bergström, L. 2012, AnP, 524,479
- Blumenthal & Gould (1970) Blumenthal, G. R., & Gould, R. J. 1970, Reviews of Modern Physics, 42, 237
- Calore et al. (2015) Calore, F., Cholis, I., & Weniger, C. 2015, JCAP, 3, 038
- Campbell et al. (2017) Campbell, S. S., Kwa, A., & Kaplinghat, M. 2017, arXiv:1709.04014
- Carlson et al. (2016) Carlson, E., Linden, T., & Profumo, S. 2016, PhRvD, 94, id3504
- Casandjian (2015) Casandjian, J.-M. 2015, ApJ, 806, 240
- Cesarsky & Völk (1978) Cesarsky, C. J., & Völk, H. J. 1978, A&A, 70, 367
- Cheng et al. (2011) Cheng, K.-S., Chernyshov, D. O., Dogiel, V. A., Ko, C. M., & Ip, W. H. 2011, ApJL, 731, L17
- Chernyshov et al. (2017) Chernyshov, D. O., Cheng, K. S., Dogiel, V. A., & Ko, C.-M. 2017, ApJ, 835, 194
- Crocker & Aharonian (2011) Crocker, R. M., & Aharonian, F. 2011, PRL, 106, 101102
- Crocker et al. (2011) Crocker, R. M., Jones, D. I., Aharonian, F., Law, C. J., Melia, F., Oka, T., & Ott, J. 2011, MNRAS, 413, 763
- Daylan et al. (2016) Daylan, T., Finkbeiner, D. P., Hooper, D., Linden, T., Portillo, S. K. N., Rodd, N. L., & Slatyer, T. R. 2016, Physics of the Dark Universe, 12, 1
- De Angelis et al. (2017) De Angelis, A., Tatischeff, V., Grenier, I. A. et al. 2017, arXiv: 171101265
- de Boer et al. (2017) de Boer, W., Bosse, L., Gebauer, I., Neumann, A., Biermann, P. 2017, PhRvD, 96, id.043012
- Dogiel et al. (1987) Dogiel, V. A., Gurevich, A. V., Istomin, Ia. N., & Zybin, K. P. 1987, MNRAS, 228, 843
- Dogel′ & Sharov (1990) Dogel′ [Dogiel], V. A. & Sharov, G. S. 1990, A&A, 229, 259
- Dogiel et al. (2015) Dogiel, V. A., Chernyshov, D. O., Kiselev, A. M. et al. 2015, ApJ, 809, 48
- Everett & Zweibel (2011) Everett, J. E., & Zweibel, E. G. 2011, ApJ, 739, 60
- Ferrière et al. (2007) Ferrière, K., Gillard, W., & Jean, P. 2007, A&A, 467, 611
- Fragione et al. (2018) Fragione, G., Antonini, F., & Gnedin, O. Y. 2018, MNRAS, 475, 5313
- Gabici et al. (2007) Gabici, S., Aharonian, F. A., & Blasi, P. 2007, Ap&SS, 309, 365
- Gaggero et al. (2015) Gaggero, D., Urbano, A., Valli, M., & Ullio, P. 2015, PhysRevD, 91, 083012
- Gherghetta et al. (2015) Gherghetta, T., von Harling, B., Medina, A. D., Schmidt, M. A., & Trott, T. 2015, PhRvD, 91, id.105004
- Ginsburg et al. (2016) Ginsburg, A., Henkel, C., Ao, Y. et al. 2016, A&A, 586, A50
- Goodenough & Hooper (2009) Goodenough, L., & Hooper, D. 2009, arXiv:0910.2998G
- Gordon, & Macías (2013) Gordon, C., & Macías, O. 2013, PhRvD, 88, id.083521
- Górski et al. (2005) Górski, K. M., Hivon, E., Banday, A. J., et al. 2005, ApJ, 622, 759
- Hartmann (2018) Hartmann, D. 2018, AAS, 231, id.419.02
- Haug (1988) Haug, E. 1998, SoPh, 178, 341
- Hooper & Goodenough (2011) Hooper, D., & Goodenough, L. 2011, PhLB, 697, 412
- Hooper & Slatyer (2013) Hooper, D., & Slatyer, T. R. 2013, Physics of the Dark Universe, 2, 118
- Hooper & Linden (2018) Hooper, D., & Linden, T. 2018, arXiv: 1803.08046
- Hunter (2007) Hunter, J. D. 2007, Computing in Science and Engineering, 9, 90
- Ivlev et al. (2018) Ivlev, A. V., Dogiel, V. A., Chernyshov, D. O., Caselli, P., Ko C.-M., & Cheng, K. S. 2018, ApJ, 855, 23 (Paper I)
- Kafexhiu et al. (2014) Kafexhiu, E., Aharonian, F., Taylor, A.M., Vila, G.S. 2014, PhRvD, 90, 123014
- Kafexhiu (2016) Kafexhiu, E. 2016, PhRvC, 94, 064603
- Kaplinghat et al. (2015) Kaplinghat, M., Linden, T., & Yu, H.-B. 2015, PhRvL, 114, id.211303
- Kauffmann et al. (2017) Kauffmann, J., Pillai, T., Zhang, Q. et al. 2017, A&A, 603, A90
- Karim et al. (2018) Karim, M. T., Fox, A. J., Jenkins, E. B., et al. 2018, ApJ, 860, 98
- Kulsrud & Pearce (1969) Kulsrud, R. & Pearce, W. P. 1969, ApJ, 156, 445
- Launhardt et al. (2002) Launhardt, R., Zylka, R., & Mezger, P. G. 2002, A&A, 384, 112
- Le Petit et al. (2016) Le Petit, F., Ruaud, M., Bron, E. et al. 2016, A&A, 585, A105
- Malyshev et al. (2015) Malyshev, D., Chernyakova, M., Neronov, A., & Walter, R. 2015, A&A, 582, A11
- Mannheim & Schlickeiser (1994) Mannheim, K., & Schlickeiser, R. 1994, A&A, 286, 983
- Maurin et al. (2014) Maurin, D., Melot, F., & Taillet, R. 2014, A&A, 569, A32
- Morfill (1982a) Morfill, G. E. 1982a, MNRAS, 198, 583
- Morfill (1982b) Morfill, G. E. 1982b, ApJ, 262, 749
- Morlino & Gabici (2015) Morlino, G., & Gabici, S. 2015, MNRAS, 451, L100
- Navarro et al. (1996) Navarro, J. F., Frenk, C. S., & White, S. D. ApJ, 1996, 462, 563
- Neronov et al. (2017) Neronov, A., Malyshev, D., & Semikoz, D. V. 2017, A&A, 606, A22
- Oka et al. (2005) Oka, T., Geballe, Th. R., Goto, M. et al. 2005, ApJ, 632, 882
- Padovani et al. (2009) Padovani, M., Hennebelle, P., & Galli, D. 2013, A&A, 560, A114
- Padovani et al. (2016) Padovani, M., Marcowith, A., Hennebelle, P., & Ferrière, K. 2016, A&A, 590, A8
- Padovani et al. (2018) Padovani, M., Ivlev, A. V., Galli, D., & Caselli, P. 2018, A&A, 614, A111
- Phan et al. (2018) Phan, V. H. M., Morlino, G., & Gabici S. 2018, arXiv:1804.10106
- Remy et al. (2017) Remy, Q., Grenier, I. A., Marshall, D. J., & Casandjian, J. M. 2017, A&A, 601, A78
- Riquelme et al. (2018) Riquelme, D., Bronfman, L., Mauersberger, R. et al. 2018, A&A, 610, A43
- Schlickeiser et al. (2016) Schlickeiser, R., Caglar, M., & Lazarian, A. 2016, ApJ, 824, 89
- Silsbee et al. (2018) Silsbee, K., Ivlev, A. V., Padovani, M., & Caselli, P. 2018, ApJ, 863, 188
- Skilling (1975) Skilling, J. 1975, MNRAS, 173, 255
- Skilling & Strong (1976) Skilling, J., & Strong, A. W. 1976, A&A, 53, 253
- Strong et al. (2004) Strong, A. W., Moskalenko, I. V., & Reimer, O. 2004, ApJ, 613, 962
- Strong (2015) Strong, A. W. [for the Fermi/LAT Collaboration] 2015, arXiv:1507.05006
- Su et al. (2010) Su, M., Slatyer, T. R., & Finkbeiner, D. P. 2010, ApJ, 724, 1044
- Vitale (2009) Vitale, V., & Morselli, A. [for the Fermi/LAT Collaboration] 2009, ArXiv:0912.3828
- Vladimirov et al. (2011) Vladimirov, A. E., Digel, S. W., Johannesson, G. et al. 2011, CoPhC, 182, 1156
- Uchiyama et al. (2010) Uchiyama, Y., Blandford, R. D., Funk, S. et al. 2010, ApJ, 723, L122
- Yang et al. (2014) Yang, R.-z., de O´na Wilhelmi, E., & Aharonian, F. 2014, A&A, 566, A142
- Yang et al. (2015) Yang, R.-z., Jones, D. I., & Aharonian, F. 2015, A&A, 580, 90
- Yang & Aharonian (2016) Yang, R.-z., & Aharonian, F. 2016, A&A, 589, A117
- Yang et al. (2018) Yang, H.-Y., Ruszkowski, M., & Zweibel, E. 2018, Galaxies, 6, 29
- Zhou et al. (2015) Zhou, B., Liang, Y.-F., Huang, X., Li, X., Fan, Y.-Z., Feng, L., & Chang, J. 2015, PhRvD, 91, 123010