1Department of Physics, Bangalore University, Bangalore, 560 056, India
\affilTwo2Indian Institute of Astrophysics, Block II,
Koramangala, Bangalore, 560034, India.
\affilThree3Department of Physics & Astronomy,
Seoul National University, Seoul, 08826, Republic of Korea
\affilFour4Physics Department, Amrita School of Engineering, Bangalore 560 035, India
Long term Ultra-Violet Variability of Seyfert galaxies
Abstract
Flux variability is one of the defining characteristics of Seyfert galaxies, a class of active galactic nuclei (AGN). Though these variations are observed over a wide range of wavelengths, results on their flux variability characteristics in the ultra-violet (UV) band are very limited. We present here the long term UV flux variability characteristics of a sample of fourteen Seyfert galaxies using data from the International Ultraviolet Explorer acquired between 1978 and 1995. We found that all the sources showed flux variations with no statistically significant difference in the amplitude of UV flux variation between shorter and longer wavelengths. Also, the flux variations between different near-UV (NUV, 1850 3300 Å) and far-UV (FUV, 1150 2000 Å) passbands in the rest frames of the objects are correlated with no time lag. The data show indications of (i) a mild negative correlation of UV variability with bolometric luminosity and (ii) weak positive correlation between UV variability and black hole mass. At FUV, about 50% of the sources show a strong correlation between spectral indices and flux variations with a hardening when brightening behaviour, while for the remaining sources the correlation is moderate. In NUV, the sources do show a harder when brighter trend, however, the correlation is either weak or moderate.
keywords:
active galaxies—Seyferts; Variabilityramkrishnadamle@bub.ernet.in
#### 2018 \pgrange1–14 \lp14
1 Introduction
Active galactic nuclei (AGN) with observed bolometric luminosities of around 1011 1014 L⊙, and that include Seyfert galaxies amongst its class, are believed to be powered by accretion of matter onto super massive black holes residing at the centres of galaxies (Lynden-Bell 1969, Rees 1984). According to the standard picture, accretion leads to the formation of accretion disk that emits black body radiation. The observed ultra-violet (UV)/optical radiation in AGN is well represented by the superposition of several multi-temperature black body components (Frank et al. 2002) and the observed big blue bump (BBB) in AGN spectra is often attributed to the accretion disk.
AGN are known to show flux variations since their discovery and is now considered one of their defining characteristics. (Ulrich et al. 1997, Wagner & Witzel 1995). Such flux variations are seen on a range of time scales from a fraction of hours to years over the complete electromagnetic spectrum from low energy radio to high energy -rays (Wagner & Witzel 1995, Ulrich et al. 1997, Zhang et al. 2017, Giveon et al. 1999). In spite of having a wealth of monitoring data on large samples of AGN with varying time resolutions through time domain surveys as well as dedicated monitoring programs, the physical mechanisms that cause AGN flux variations are still not well understood. Though different physical processes contribute to the emission at different wavebands, the UV-optical emission is believed to be emitted from an optically thick and geometrically thin accretion disk (Frank et al. 2002). Therefore, study of flux variations in the UV/optical bands can enable one to understand the processes happening in the accretion disk of AGN in particular in the non-blazar category of AGN.
Earlier efforts on the study of UV variations in AGN, were by Paltani & Courvoisier (1994) who carried out a systematic analysis of the flux variations in the UV of different classes of AGN using data from the international Ultraviolet Explorer (IUE) covering the period 1978 1991. Also, UV variability of blazars has been studied using IUE data (Edelson et al. 1991, Edelson 1992). According to their analysis, blazars show stronger variability at shorter wavelengths than at longer wavelengths. Subsequent to the work of Paltani & Courvoisier (1994), Welsh et al. (2011) carried out a systematic study of the UV variability of a large number of AGN using data from the Galaxy Evolution Explorer (GALEX) data base. According to Welsh et al. (2011), the UV variability of quasars is much more than their optical fluctuations and among the UV bands, the variability observed in the far-UV (FUV; 13441786 Å) band is larger than the variability in the near-UV (NUV; 17712831 Å) band with is also similar to that found by Paltani & Courvoisier (1994). The analysis of Paltani & courvoisier (1994) failed to find any significant differences between the UV properties of radio-loud and radio-quiet quasars prompting the authors to suggest that the UV emission from AGN is independent of the radio emission properties. Studies of optical flux variations in different categories of AGN indicate, blazars tend to show large amplitude and high duty cycle of variability within a night compared to other radio-loud and radio-quiet AGN (Stalin et al. 2004). On year like time scales, among Seyfert galaxies in the optical band, radio-loud sources are more variable than their radio-quiet counterparts (Rakshit & Stalin 2017).
Short time scale UV flux variations of the order of 1000 to 10000 seconds were found in the Seyfert 1 galaxy NGC 7469 by Welsh et al. (1998), using the Faint Object Spectrograph on the Hubble Space Telescope as well as Fairall 9 (Lohfink et al. 2017). Most of the studies on the UV flux variability of AGN (Sakata et al. 2011, Paltani & Courvoisier 1994) either using spectroscopy or broad band photometry indicate that the UV flux variability characteristics of AGN can be well described by accretion disk models. Vanden Berk et al. (2004) based on two epochs of observations on a large number of quasars found a spectral hardening of the UV continuum emission with increasing flux values. Similar results were also found by Wilhite et al. (2005) using spectroscopic observations. Paltani & Walter (1996) using IUE observations observed that the spectra of Seyfert galaxies vary with time and they become flatter when the source brightens. To explain the observations, they proposed a two component model wherein the UV flux variations consist of a variable component with a constant spectral shape and a non-variable component from the small blue bump (SBB). Also, there are reports that claim the constancy of UV spectral shape during flux variations of AGN (D. Alloin et al. 1995, Rodrigues-Pascual et al. 1997). As we have limited studies on the UV flux variability characteristics of AGN both in long term as well as short term, it is of great importance to expand the studies on the already known UV flux variability nature of AGN to a larger sample of sources, and having data for a longer duration of time than that analysed before by Paltani & Walter (1996). Towards this, we have carried out a statistical analysis of the UV variability of a sample of Seyfert galaxies, a category of AGN for which sufficient data is available and focussed mainly on the FUV (11502000 Å) and NUV (18503200 Å) flux variations.
2 Sample and Data
Our sample of Seyfert 1 galaxies was taken from Dunn et al. (2006) who have provided continuum light curves in different wavebands for a sample of 175 Seyfert galaxies as part of the Program in Extra Galactic Astronomy (PEGA) 111http://www.astro.gsu.edu/PEGA/IUE. The data towards this compilation were taken from the observations carried by IUE between the period 1978 to 1995. In this database, Dunn et al. (2006) have provided continuum flux measurements at three line free regions in the spectra of each of the Seyfert galaxies. In IUE spectra, the NUV and FUV cover the wavelength regions 18503200 Å and 11502000 Å respectively. For most of the sources, flux measurements are available in three NUV passbands (2200, 2400 and 2740 Å) with bin sizes of 50, 60 and 30 Å and three FUV passbands (1355, 1720 and 1810 Å) with bin sizes of 30, 30 and 50 Å. For this study, we have downloaded the light curves for all the Seyfert galaxies that are available in the PEGA database and we applied the following conditions to select the light curves for further analysis:
-
1.
The sources must have data from the two cameras of IUE namely the short wavelength prime (SWP) and long-wavelength prime (LWP).
-
2.
The total number of points (that includes all the three continuum passbands in FUV and NUV) must be larger than 50
The above two conditions lead us to a final sample of 14 Seyfert galaxies spanning the redshift range 0.002 0.07. Of the 14 selected Seyfert galaxies, one galaxy (NGC 1068) belongs to the Seyfert 2 category (having narrow permitted and forbidden lines), while the remaining 13 sources belong to the Seyfert 1 category with broad permitted lines and narrow forbidden lines. The details of the objects selected for this study are given in Table 1. In this table, the total in column 7 refers to the total number of photometric points for a source in all the six passbands together. The entries against , and in SWP and LWP columns refer to the central wavelength used for the photometry and NNUV and NFUV give the number of points in each of the NUV and FUV passbands.
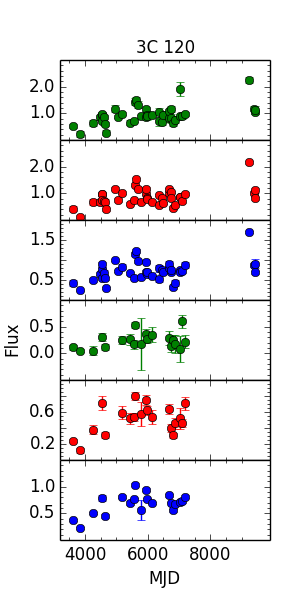
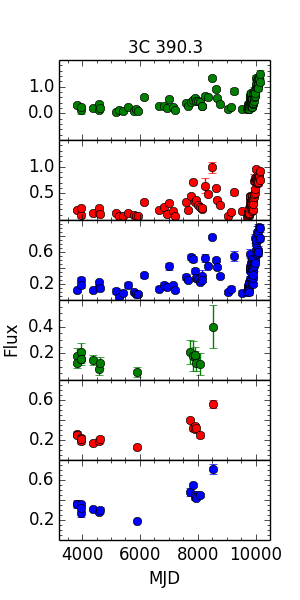
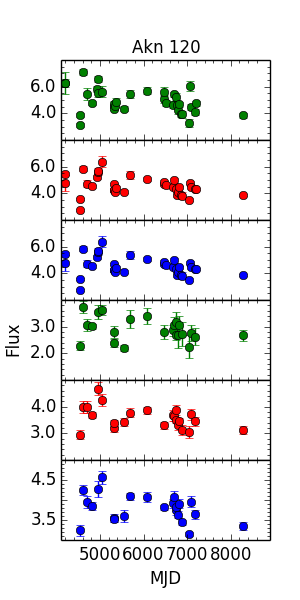
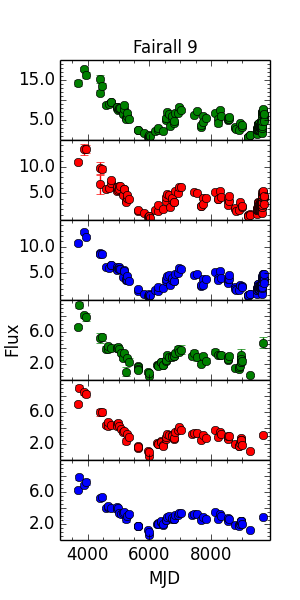
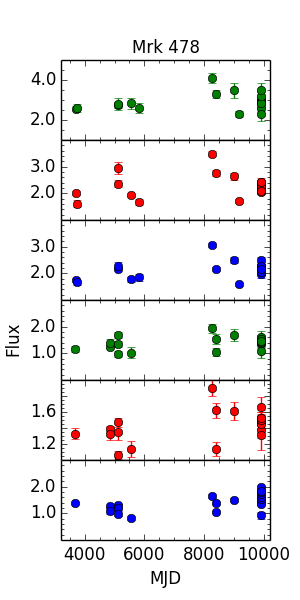
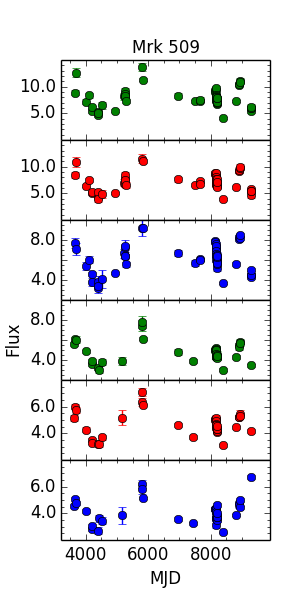
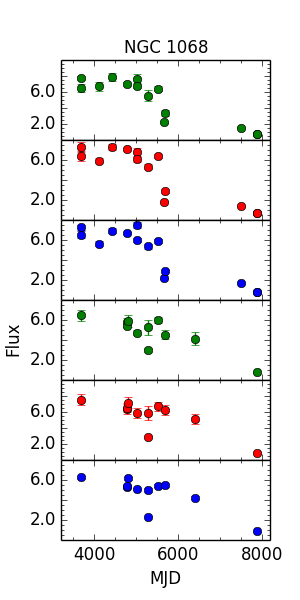
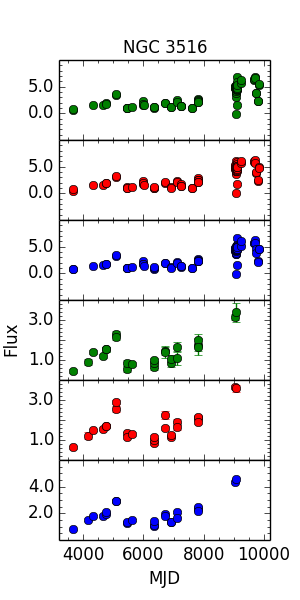
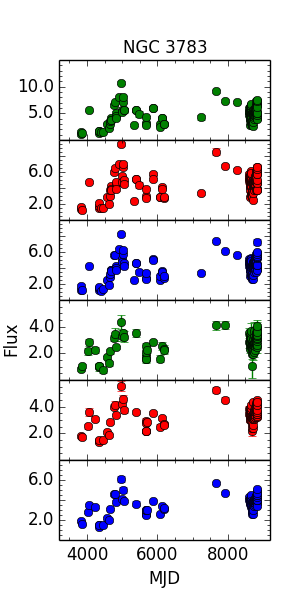
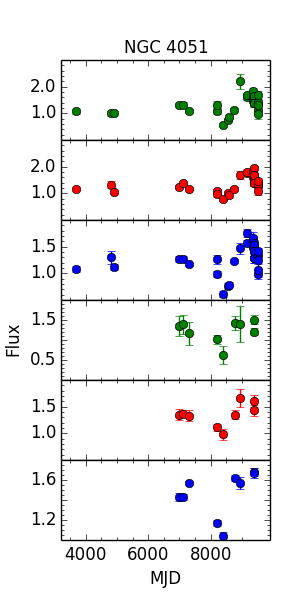
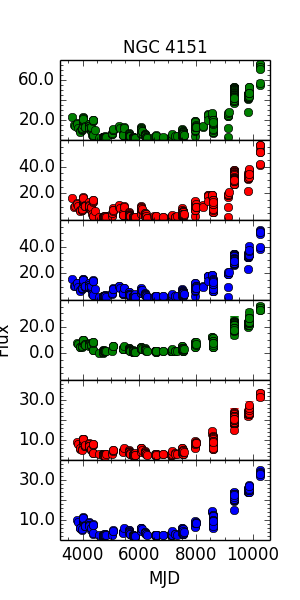
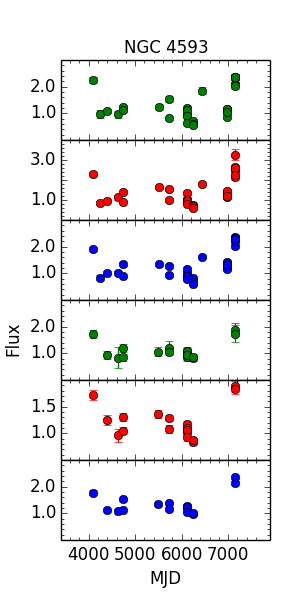
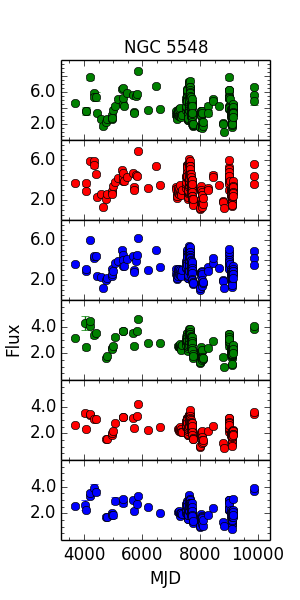
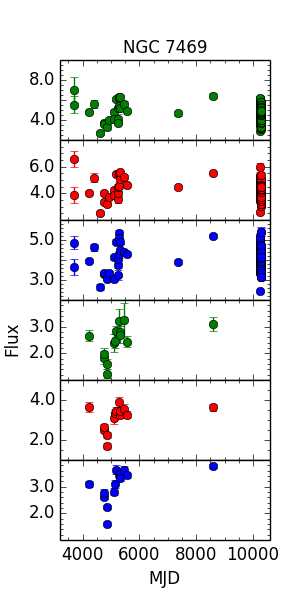
The observed flux values in all the six passbands were corrected for galactic extinction using the values taken from NED 222ned.ipac. caltech.edu which uses Schlafly et al. (2011) and the extinction law evaluated in the UV range using the formalism given by Cardelli et al. (1989). The galactic extinction corrected flux values were then subjected to further analysis. We note here that the measured flux values were not corrected for extinction due to the host galaxies of the sources. The light curves in all the FUV and NUV passbands for the sources are given in Fig. 1 through Fig. 5. In these figures, the quoted wavelengths are in the observed frame of the sources. The present sample analysed here has some overlap with that reported by Paltani & Walter (1996). The sample analysed by Paltani & Walter (1996) has 15 sources that includes Seyfert galaxies, radio-loud as well as radio-quiet quasars. Their analysis was based on IUE data collected upto 1991. Our sample analysed here contains 14 Seyfert galaxies using data from IUE upto 1995. Though there are 10 sources in common to the sample reported here and that of Paltani & Walter (1996), the data analysed here is more extended in terms of the number of epochs and the total duration (19781995) compared to Paltani & Walter (1996) who have analysed data from IUE until 1991.
2.1 Flux variability
For all the 14 sources selected based on the criteria outlined above, we carried out analysis to characterise their variability. This was done by calculating their normalized excess variance defined in Vaughan et al. (2003) as
| (1) |
where and are the sample variance and average error defined as
| (2) |
| (3) |
The error in was calculated again using Vaughan et al. (2003) and is defined as
| (4) |
| Name | RA(2000) | Dec (2000) | Redshift | log (MBH) | Lbol | NTotal | SWP | LWP | ||||||
|---|---|---|---|---|---|---|---|---|---|---|---|---|---|---|
| (erg/sec) | NFUV | NNUV | ||||||||||||
| Fairall 9 | 01:23:45.8 | -58:48:20.5 | 0.047 | 8.299 | 44.78 | 693 | 1418 | 1800 | 1895 | 156 | 2303 | 2512 | 2868 | 75 |
| NGC 1068 | 02:42:40.7 | -00:00:47.8 | 0.004 | 7.176 | 44.60 | 75 | 1360 | 1726 | 1816 | 14 | 2208 | 2409 | 2750 | 11 |
| 3C 120 | 04:33:11.1 | +05:21:15.6 | 0.033 | 7.745 | 43.98 | 186 | 1399 | 1776 | 1869 | 42 | 2272 | 2479 | 2830 | 20 |
| Akn 120 | 05:16:11.4 | -00:08:59.4 | 0.032 | 8.068 | 44.40 | 177 | 1398 | 1775 | 1868 | 36 | 2271 | 2471 | 2828 | 23 |
| NGC 3516 | 11:06:47.5 | +72:34:06.9 | 0.009 | 7.395 | 43.89 | 330 | 1366 | 1735 | 1826 | 85 | 2219 | 2421 | 2764 | 25 |
| NGC 3783 | 11:39:01.8 | -37:44:18.7 | 0.010 | 7.371 | 43.57 | 834 | 1368 | 1736 | 1827 | 164 | 2221 | 2423 | 2726 | 114 |
| NGC 4051 | 12:03:09.6 | +44:31:52.8 | 0.002 | 6.130 | 42.38 | 117 | 1358 | 1724 | 1814 | 30 | 2205 | 2405 | 2746 | 9 |
| NGC 4151 | 12:10:32.6 | +39:24:20.6 | 0.003 | 7.555 | 43.30 | 2904 | 1359 | 1725 | 1816 | 542 | 2207 | 2407 | 2749 | 426 |
| NGC 4593 | 12:39:39.4 | -05:20:39.3 | 0.009 | 6.882 | 43.45 | 138 | 1367 | 1735 | 1826 | 29 | 2219 | 2421 | 2764 | 17 |
| NGC 5548 | 14:17:59.5 | +25:08:12.4 | 0.017 | 7.718 | 43.92 | 1104 | 1378 | 1749 | 1841 | 214 | 2237 | 2441 | 2787 | 154 |
| Mrk 478 | 14:42:07.5 | +35:26:22.9 | 0.079 | 7.330 | 44.95 | 117 | 1462 | 1855 | 1953 | 19 | 2373 | 2589 | 2956 | 20 |
| 3C 390.3 | 18:42:09.0 | +79:46:17.1 | 0.056 | 8.638 | 44.32 | 330 | 1431 | 1816 | 1911 | 94 | 2323 | 2534 | 2893 | 16 |
| Mrk 509 | 20:44:09.7 | -10:43:04.5 | 0.034 | 8.049 | 44.78 | 288 | 1401 | 1779 | 1872 | 55 | 2275 | 2482 | 2834 | 41 |
| NGC 7469 | 23:03:15.6 | +08:52:26.4 | 0.016 | 6.956 | 44.42 | 750 | 1377 | 1748 | 1839 | 236 | 2235 | 2439 | 2784 | 14 |
| Name | F | (SWP) | (LWP) | ||||||
|---|---|---|---|---|---|---|---|---|---|
| SWP | LWP | ||||||||
| Fairall 9 | 0.586 0.012 | 0.574 0.012 | 0.562 0.006 | 0.515 0.022 | 0.499 0.012 | 0.440 0.009 | 0.92 0.04 | 1.68 0.05 | 0.9 |
| NGC 1068 | 0.529 0.052 | 0.548 0.036 | 0.522 0.028 | 0.335 0.073 | 0.339 0.086 | 0.351 0.022 | 1.68 0.10 | 1.28 0.15 | — |
| 3C 120 | 0.321 0.058 | 0.327 0.030 | 0.297 0.026 | 0.414 0.157 | 0.336 0.052 | 0.282 0.017 | 0.80 0.09 | 2.46 0.20 | 1.9 |
| Akn 120 | 0.174 0.035 | 0.154 0.022 | 0.154 0.022 | 0.109 0.057 | 0.104 0.029 | 0.086 0.017 | 1.41 0.04 | 1.60 0.07 | 1.5 |
| NGC 3516 | 0.600 0.013 | 0.596 0.012 | 0.590 0.008 | 0.495 0.044 | 0.435 0.019 | 0.461 0.011 | 1.75 0.03 | 2.81 0.10 | 2.2 |
| NGC 3783 | 0.305 0.013 | 0.278 0.010 | 0.269 0.008 | 0.225 0.035 | 0.217 0.014 | 0.221 0.007 | 1.15 0.02 | 1.67 0.04 | 1.5 |
| NGC 4051 | 0.240 0.021 | 0.215 0.016 | 0.206 0.012 | 0.109 0.076 | 0.137 0.031 | 0.151 0.011 | 1.91 0.11 | 2.52 0.13 | — |
| NGC 4151 | 0.749 0.011 | 0.728 0.008 | 0.708 0.006 | 0.681 0.030 | 0.629 0.016 | 0.650 0.006 | 0.99 0.02 | 2.25 0.03 | 1.2 |
| NGC 4593 | 0.440 0.016 | 0.462 0.018 | 0.407 0.011 | 0.246 0.048 | 0.254 0.019 | 0.284 0.012 | 2.03 0.08 | 2.53 0.07 | 2.0 |
| NGC 5548 | 0.362 0.008 | 0.337 0.006 | 0.315 0.004 | 0.253 0.008 | 0.262 0.004 | 0.271 0.006 | 1.22 0.02 | 1.06 0.04 | 1.3 |
| Mrk 478 | 0.119 0.039 | 0.196 0.018 | 0.153 0.016 | 0.134 0.032 | 0.119 0.019 | 0.226 0.012 | 1.00 0.13 | 1.88 0.08 | — |
| 3C 390.3 | 0.712 0.027 | 0.780 0.018 | 0.645 0.014 | 0.144 0.056 | 0.367 0.016 | 0.309 0.015 | 1.57 0.15 | 4.43 0.18 | — |
| Mrk 509 | 0.234 0.024 | 0.230 0.027 | 0.226 0.021 | 0.209 0.024 | 0.183 0.016 | 0.207 0.018 | 1.13 0.04 | 0.80 0.04 | 1.2 |
| NGC 7469 | 0.215 0.047 | 0.204 0.029 | 0.183 0.020 | 0.213 0.068 | 0.189 0.037 | 0.195 0.021 | 1.31 0.02 | 1.73 0.16 | 1.4 |
 .
.
| Mean wavelength | Mean Fvar |
|---|---|
| 1389 30 | 0.399 0.198 |
| 1762 38 | 0.402 0.203 |
| 1855 40 | 0.374 0.188 |
| 2255 49 | 0.292 0.168 |
| 2460 53 | 0.291 0.148 |
| 2806 64 | 0.295 0.139 |
| Name | SWP | LWP | ||||||
|---|---|---|---|---|---|---|---|---|
| Slope | Intercept | r | P | slope | Intercept | r | P | |
| Fairall 9 | -0.100 0.012 | 1.425 0.083 | 0.405 | 0.000 | -0.393 0.033 | 2.965 0.105 | 0.601 | 0.000 |
| NGC 1068 | -0.065 0.038 | 2.188 0.353 | 0.530 | 0.052 | 0.009 0.078 | 1.075 0.489 | -0.109 | 0.751 |
| 3C 120 | -0.178 0.038 | 2.268 0.326 | 0.455 | 0.044 | -0.622 0.116 | 4.131 0.345 | 0.760 | 0.002 |
| Akn 120 | -0.131 0.026 | 3.097 0.301 | 0.530 | 0.001 | -0.291 0.071 | 3.866 0.556 | 0.653 | 0.001 |
| NGC 3516 | -0.079 0.007 | 2.157 0.036 | 0.286 | 0.008 | 0.074 0.026 | 2.577 0.098 | -0.101 | 0.637 |
| NGC 3783 | -0.088 0.006 | 2.204 0.068 | 0.683 | 0.000 | -0.262 0.030 | 3.634 0.217 | 0.329 | 0.000 |
| NGC 4051 | -1.140 0.223 | 3.653 0.326 | 0.596 | 0.001 | -1.525 0.873 | 4.472 1.199 | 0.285 | 0.457 |
| NGC 4151 | -0.019 0.001 | 1.310 0.027 | 0.720 | 0.000 | -0.058 0.006 | 2.951 0.090 | 0.380 | 0.000 |
| NGC 4593 | -0.002 0.007 | 2.302 0.018 | 0.378 | 0.043 | -1.798 0.626 | 4.939 0.802 | 0.010 | 0.971 |
| NGC 5548 | -0.234 0.019 | 2.280 0.085 | 0.547 | 0.000 | -0.547 0.075 | 2.533 0.250 | 0.179 | 0.050 |
| Mrk 478 | -1.201 0.621 | 4.474 1.896 | 0.181 | 0.518 | -5.171 2.293 | 9.716 3.427 | 0.177 | 0.483 |
| 3C 390.3 | -1.043 0.142 | 2.160 0.172 | 0.609 | 0.000 | -12.695 4.974 | 7.483 1.222 | 0.445 | 0.084 |
| Mrk 509 | -0.038 0.017 | 1.653 0.191 | 0.097 | 0.485 | -0.318 0.098 | 2.956 0.722 | 0.388 | 0.031 |
| NGC 7469 | -0.221 0.009 | 2.982 0.067 | 0.786 | 0.000 | -0.211 0.093 | 2.846 0.460 | 0.360 | 0.206 |
 .
.
 .
.
 .
.
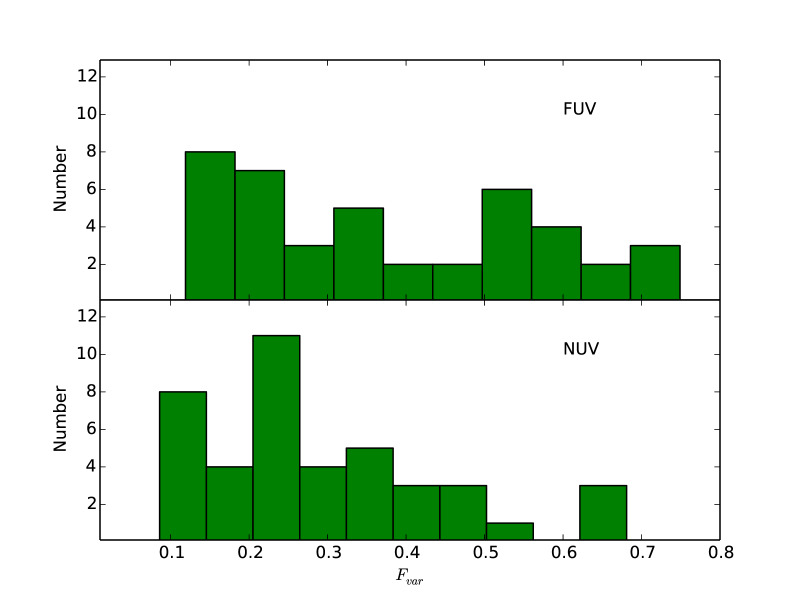
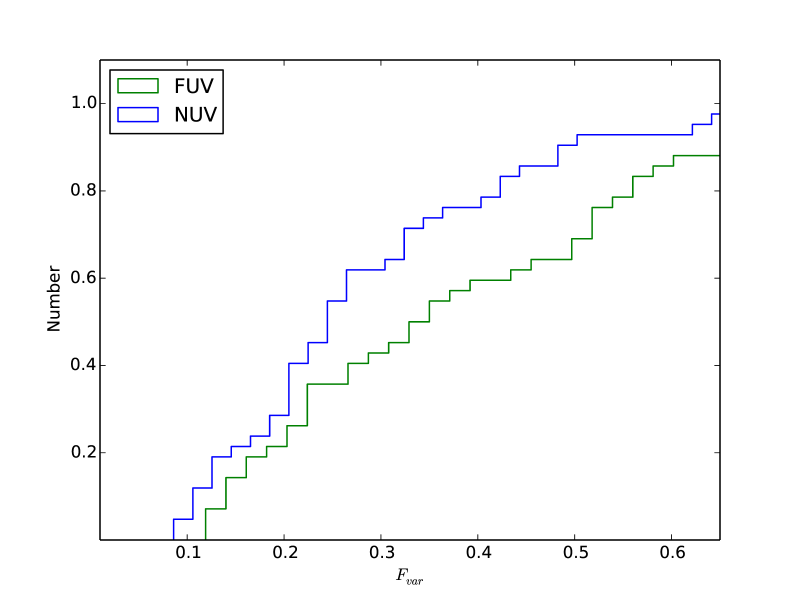
Majority of the sources in our sample, have overlapping coverage in FUV and NUV passbands except for five sources, namely, 3C 120, 3C 390.3, NGC 3516, NGC 7469 and NGC 4051. This is evident in the light curves of these sources shown in Figs. 1, 3 and 5. Because of this, for calculating Fvar, we have considered only those duration of the light curves that have overlapping coverage in both FUV and NUV passbands. The calculated Fvar values for all the sources in each of the six continuum passbands are given in Table 2. A source is considered variable if its Fvar is greater than zero, and it is significant at the one sigma level. In all instances in our sample, Fvar is many times greater than their associated errors except in four cases where it is less than three times their associated errors. Among these four too, in two cases Fvar is more than two times their associated errors and in the remaining two cases it is between one and two sigma. We therefore argue that all the sources in the sample analysed here are highly variable in all the six passbands, except in four instances where the variability is less significant. The mean Fvar values in all the six passbands for all the sources studied here is shown in Table 3. There is an indication that the variations at the shorter wavelengths are larger than those at the longer wavelengths, but the larger error bars preclude us to draw any firm conclusion on the differences in variability between different wavelengths. Clubbing the Fvar values in the three SWP passbands together as SWP and the three LWP passbands together as LWP, we obtained simple average values of Fvar as 0.392 0.196 and 0.293 0.152 for SWP and LWP respectively. The total number of Fvar values are thus 42, in each of the SWP and LWP passbands. The distributions of Fvar for SWP and LWP and their cumulative distributions are given in Fig. 6 and Fig. 7 respectively. The average value of Fvar is larger in SWP than in LWP, however, as the error bars are larger we carried out a two sample KS test. The null hypothesis that was tested was that the two independent Fvar values pertaining to SWP and LWP were drawn from the same distribution. This null hypothesis was accepted as D was lesser than the critical value of D (D. We obtained values of 0.286 and 0.356 for D and Dcrit respectively for a significance level of 0.01. This statistically points to no difference in the Fvar values between SWP and LWP bands. Available studies do indicate that in UV, AGN show wavelength dependent variability with the shorter wavelengths showing large amplitude of variability compared to the longer wavelengths (Sakata et al. 2011, Vanden Berk et al. 2004, Welsh et al. 2011). Data analysed here do indicate that variations at the shorter wavelengths are larger than that at longer wavelengths, however, due to the quality of the data, the error bars are too large to draw any conclusion on variation of amplitude of variability with wavelength.
.
.
.
.
3 Correlation between variability and other physical properties
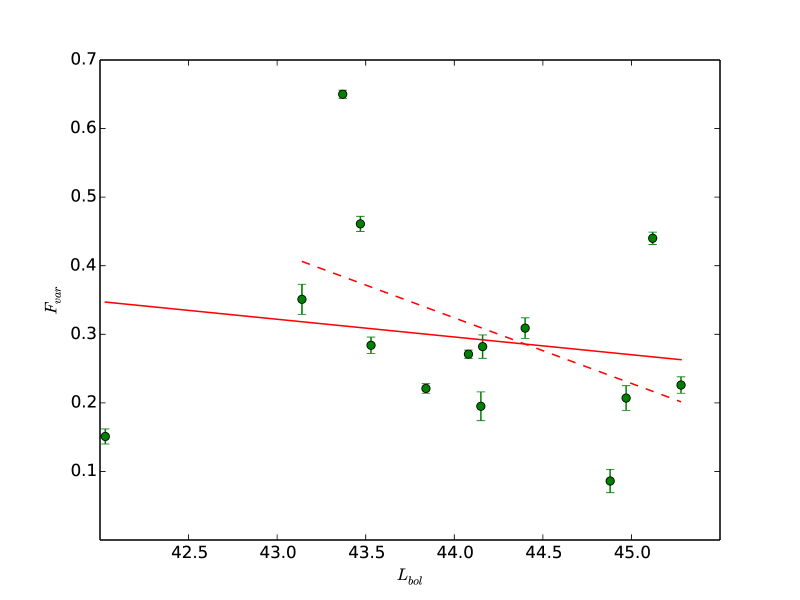
3.1 Fvar and Lbol
To find for the presence of any correlation between Fvar and bolometric luminosity (Lbol), we plot in Fig. 8 the variation of Fvar with Lbol . The Fvar values used in this correlation analysis is for the NUV band for the passband 2806 64 Å. We used the relation given by Elvis et al. (1994). Here, is the luminosity in the V-band which was derived using the V-band magnitude of the sources taken from SIMBAD333http://simbad.u-strasbg.fr/simbad/, the zero-points taken from Bessel (1979) and the luminosity distance taken from NED444http://www.astro.ucla.edu/wright/CosmoCalc.html. Using all the Fvar values, we found indication of no correlation between Fvar and with a low correlation coefficient of 0.08 and a probability of no correlation of P = 0.79. This trend for no correlation between Fvar and Lbol is due to one low luminosity source NGC 4051. Neglecting this source and doing a linear least squares fit to the data gave evidence for a mild negative correlation between Fvar and Lbol. The linear least square fit is shown as a dashed line in Fig. 8. Correlation analysis indicates a mild negative correlation with a correlation coefficient of 0.39 with a probability of no correlation of P = 0.19. This is in agreement with what is known in literature. Using IUE data, Paltani & Courvoisier (1997) found an anti-correlation between quasar variability and luminosity with high luminosity quasars showing low amplitude of variability. This anti-correlation is also seen in the optical bands (Vanden Berk et al. 2004, Meusinger & Weiss 2013). Analysing large sample of quasars for UV variability using data from GALEX Welsh et al. (2011) found two different correlations between variability and luminosity. For time lags greater than 100 days, variability is negatively correlated with luminosity, while for time lags lesser than 100 days, variability is positively correlated with luminosity. The data analysed here too reveal a negative correlation between UV variability and luminosity. However, quality UV data (with similar time resolution and uniform coverage in both FUV and NUV) on a larger sample of sources are needed to firmly establish this finding.
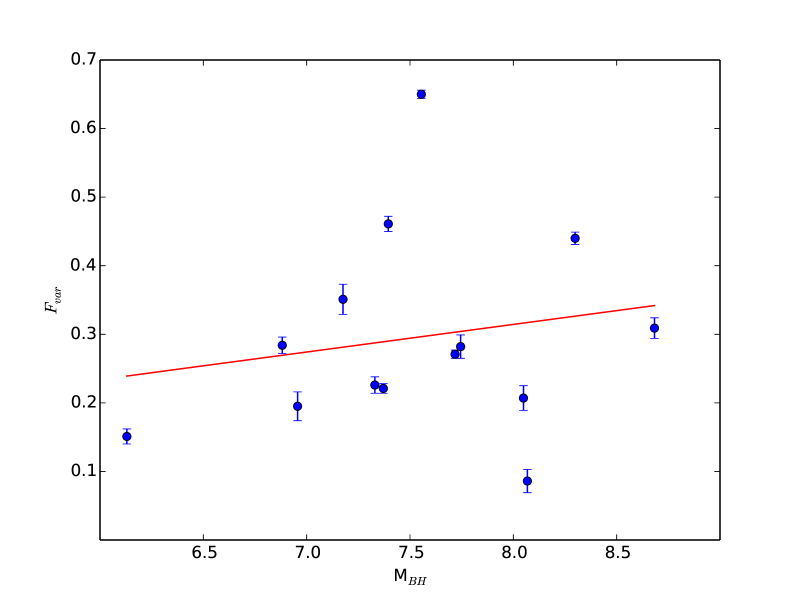
3.2 Fvar and MBH
Correlation between optical variability and black hole (BH) mass has been widely studied in the optical with no clear consensus. From an analysis of the long term optical variability of quasars, Wold et al. (2007) found a correlation between variability and BH mass with sources with large BH mass showing larger amplitude of variability. Such a correlation was also noticed by Wilhite et al. (2008), however, Meusinger & Weiss (2013) and Zuo et al. (2012) could not find any correlation between optical variability and BH mass. From the data set analysed here, we looked for the existence of any correlation between UV variability and BH mass. In Fig. 9 we show the correlation between Fvar and MBH where we found hint for a positive correlation between Fvar and MBH. Correlation analysis gave a Pearson rank correlation coefficient of 0.18 with a probability for no correlation of 0.54. The Fvar values used in this correlation analysis too is in NUV for the passband 2806 64 Å.
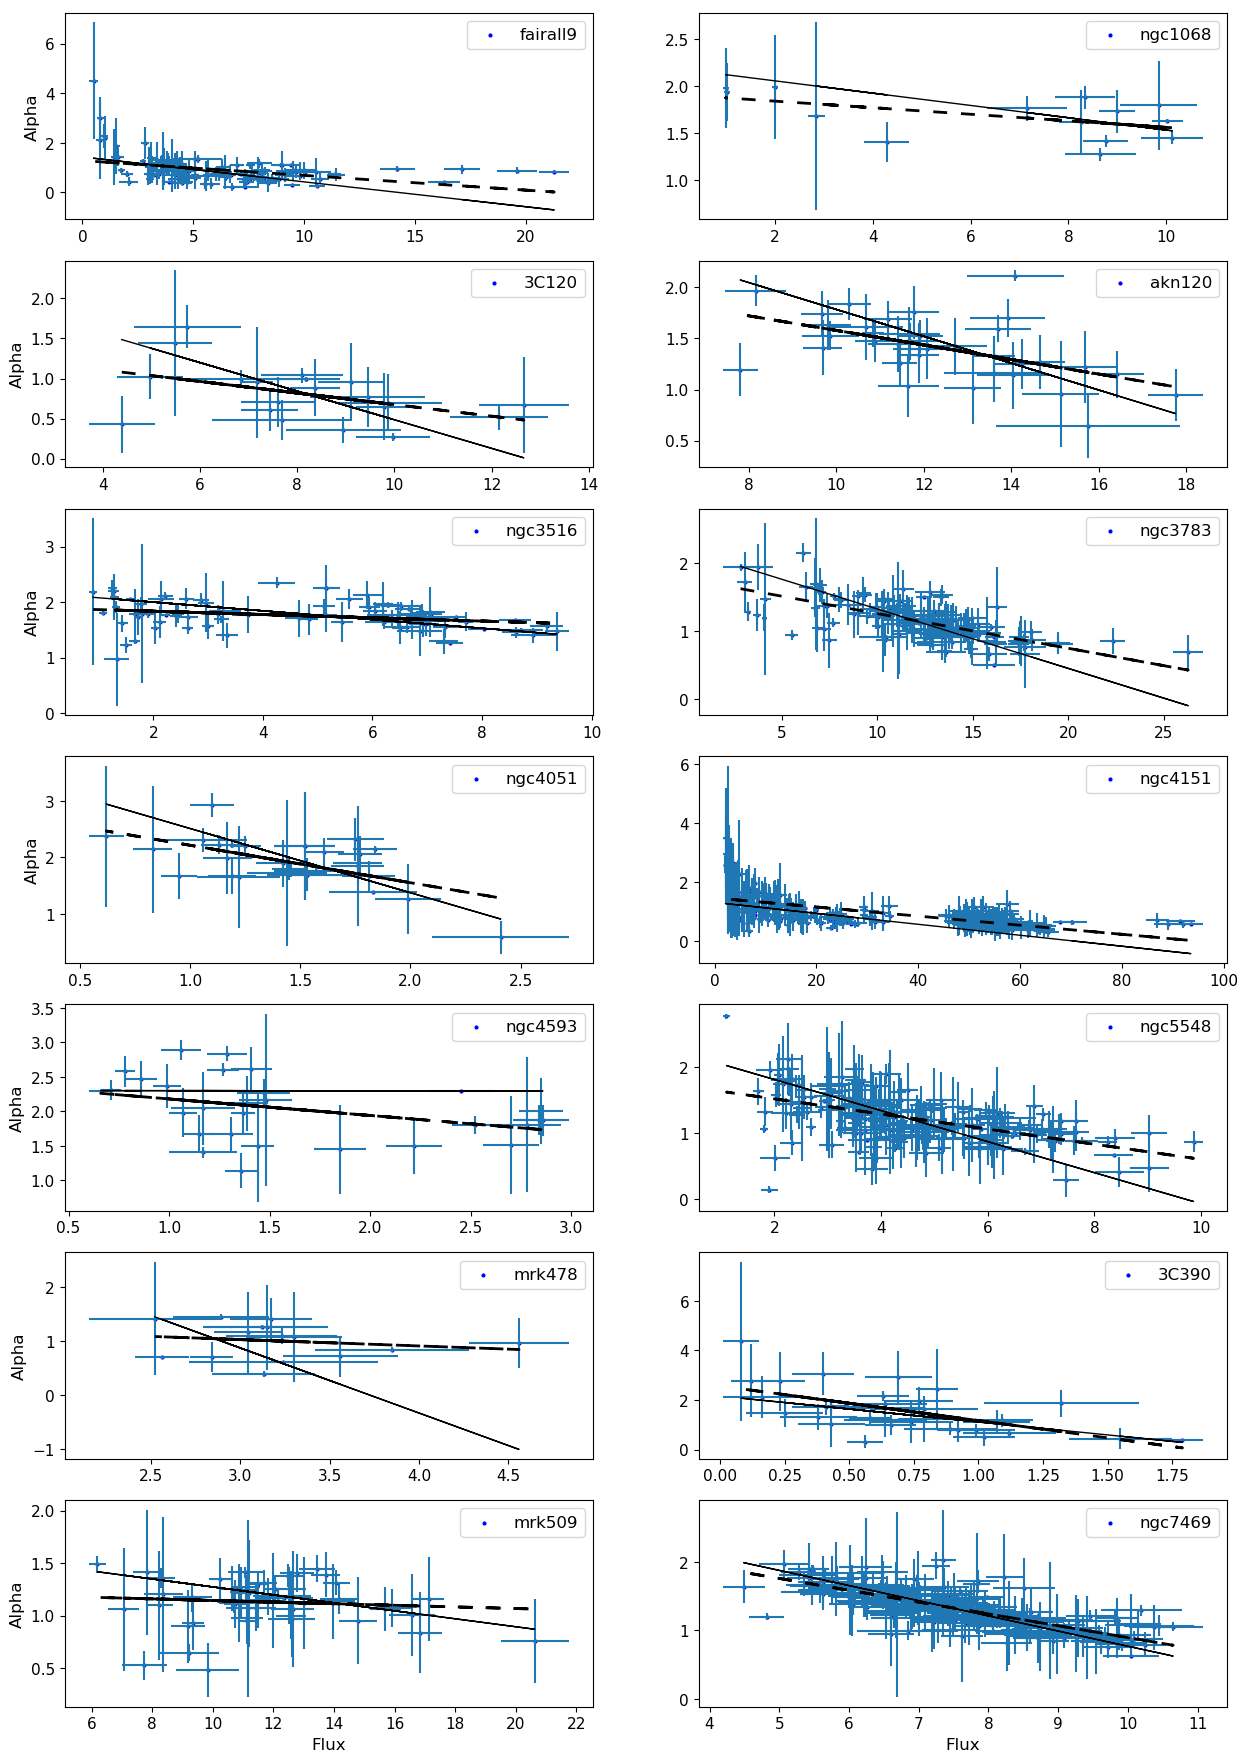
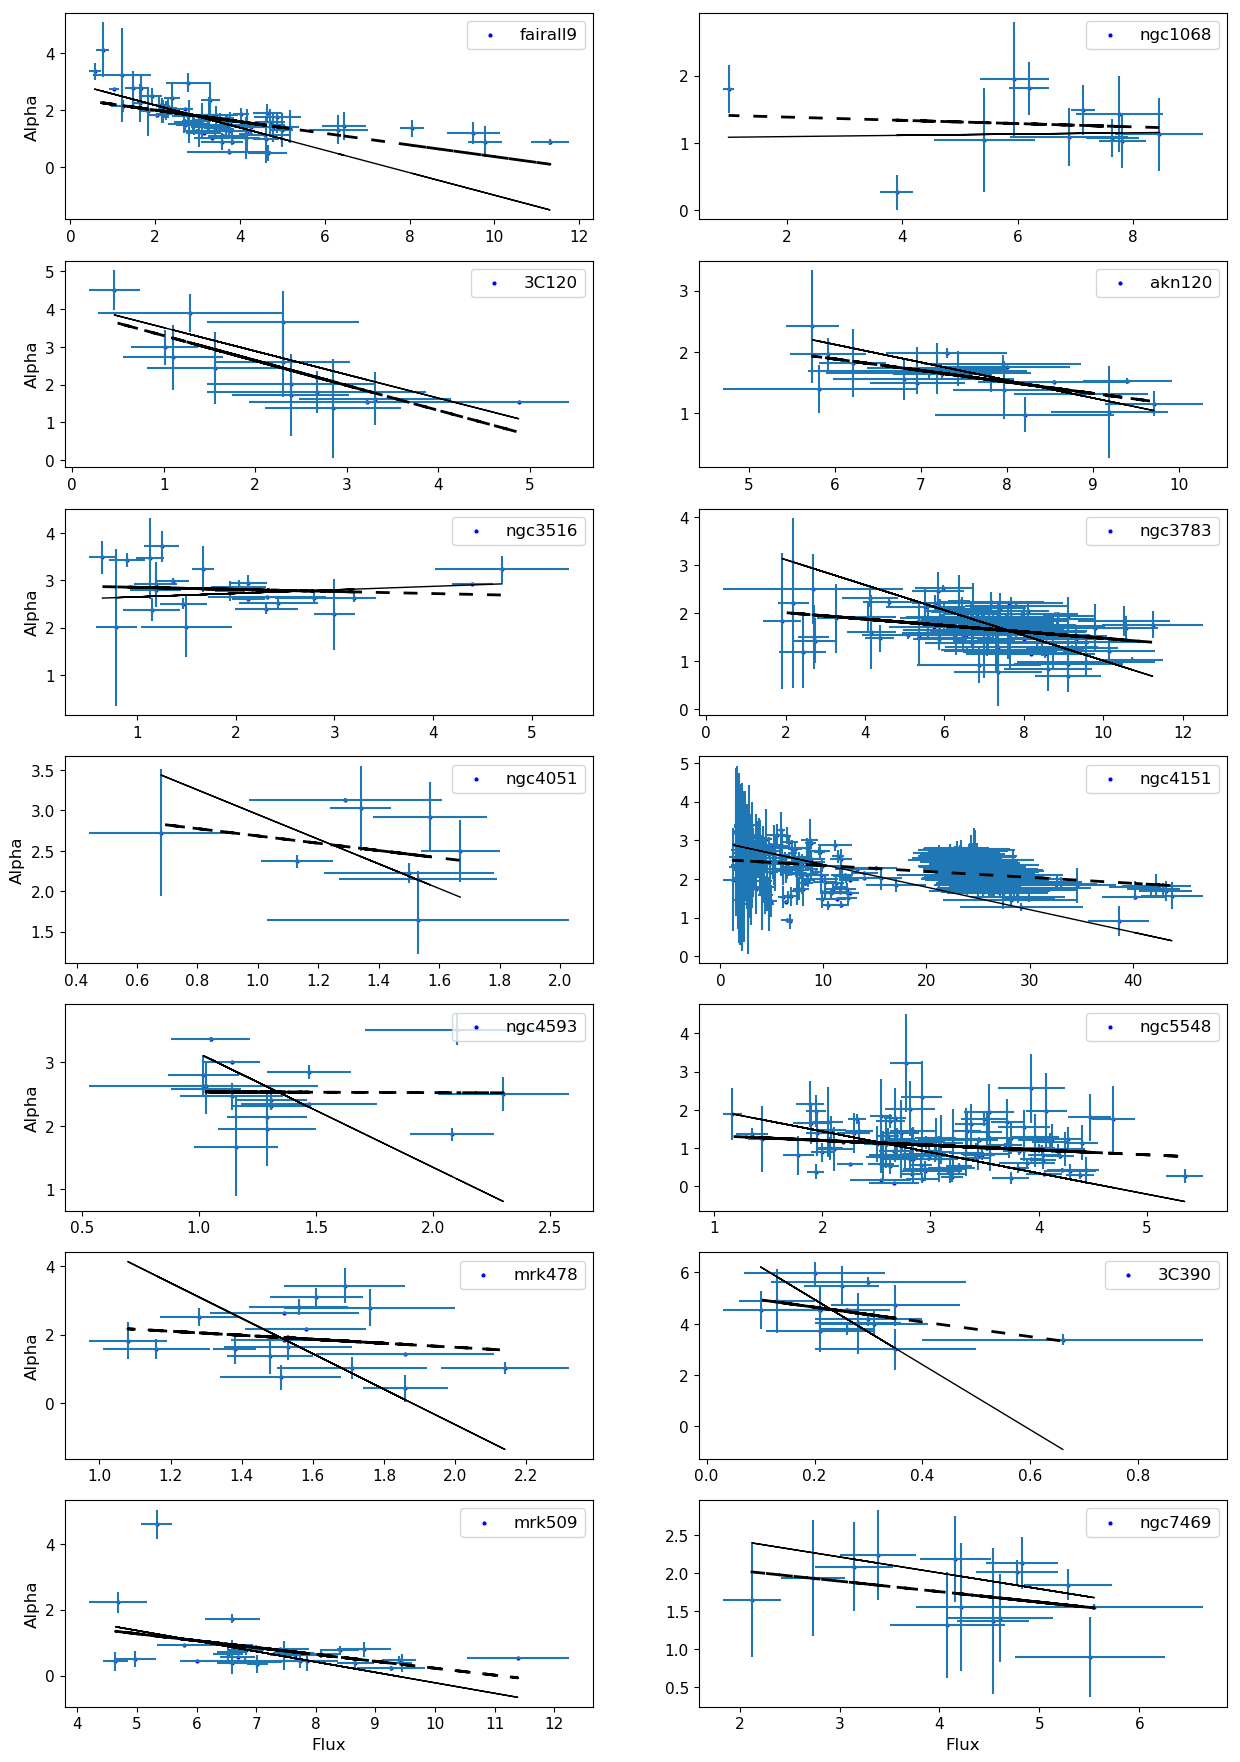
4 Spectral variability
To know the spectral variability nature of the sources studied here, we examined the change in the spectral index relative to the flux of the sources. The optical to UV continuum slope of an AGN can be well represented as a power law, , where is the observed flux density and is the spectral index. For each of the sources studied here, we have observations in six UV passbands. We therefore calculated the spectral index by fitting a power law of the form
| (5) |
For NUV, was determined using the above power law fit to three measurements and for FUV again three measurements were used to derive . The variation of thus deduced against the flux of the sources in both SWP and LWP are shown in Fig.10 and Fig.11 respectively. For SWP, we selected the shortest wavelength of three and for LWP too, we selected the shortest wavelength of the three observations. This is only for the purpose of defining the flux values. For the analysis of correlation between and flux, we considered only those points where the error in and flux values are lower than the associated values of and fluxes. The data were fit with a straight line by (i) assigning equal weight to all the points and (ii) taking into account the errors in both and flux values. The un-weighted linear least squares fits are shown by dashed lines in Fig. 10 and Fig. 11, while the weighted linear least squares fits are shown by solid lines. From weighted linear least squares fit to the data we find that, for most of the sources, their spectra do not show any significant changes during the flux variations, however, for few sources, we found clear evidence of a hardening of the spectra with increase in flux. For some sources, we see structures in the variation of with flux. The spectrum is found to harden with increasing flux, however, limited to certain moderate flux values, beyond which the spectrum is nearly steady showing no change with flux. This is seen in the sources NGC 3783, NGC 4151, NGC 4593 and Fairall 9 in SWP. In LWP, this is evident in the sources NGC 4151 and Fairall 9. The results of the linear least squares fit to the variation in with flux is shown in Table 4 . In FUV about 50% of the sources showed a harder when brighter trend. The remaining sources too showed a harder when brighter behaviour but the correlation is moderate. The weighted and un-weighted linear least squares fit show similar trend for most of the sources, with the largest mismatch seen in Mrk 478. In the NUV band there is moderate correlation between and the flux with a trend for a harder when brighter behaviour. Here too, large discrepancy between weighted and un-weighted linear least squares fits is seen in sources such as Mrk 478, NGC 4593 and 3C 390.3. These results to a large extent agree with the analysis of the UV continuum emission in AGN by Sakata et al. (2011) who too found a bluer when brighter trend in their sample. Similar conclusion was also arrived at by Wilhite et al. (2005) and Vanden Berk et al. (2004) in the optical band. Our results for a majority of the sources are also consistent with the observations of Paltani & Walter (1996) who found that the UV spectra of Seyfert galaxies becomes flatter with increased brightness of the sources. To explain these observations, Paltani & Walter (1996) proposed the two component model. According to this model, the observed flux is a superposition of two distinct spectral components, with constant spectral shapes. One component is flux variable while the other one is stable and the observed continuum variation is driven by the amplitude of the varying component. For some sources in our sample such as NGC 3783, NGC 4151, NGC 4593 and Fairall 9, we in fact observed a constancy of the spectral index with increasing flux, however, only beyond certain flux levels in them. This points to the complex nature of UV flux variations in AGN (cf. Paltani & Walter (1996). The mean values of for the sources in SWP and LWP are given in Table 2. Also, given in the same table are the mean values reported by Paltani & Walter (1996) estimated using IUE spectra covering the wavelength range of 1150 3200 Å. For the sources that are in common between this study and that of Paltani & Walter (1996) the mean values are similar, though the data analysed here is much more than that of Paltani & Walter (1996).
.
5 Lag between different wavebands
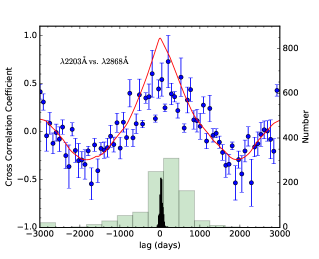
To check for inter-band time lags we used the discrete correlation function (DCF) technique of Edelson & Krolik (1988). The cross-correlation analysis was done between the light curves of the shortest and longest wavelengths in both FUV and NUV for all the sources. We show in Fig.12 the results on one correlation analysis for the object Fairall 9 carried out between the light curves at 2203 and 2868 Å. Here, the filled circles are those evaluated using the DCF method and the solid line is that obtained using the interpolated cross correlation function (ICCF) described in detail in Gaskell & Sparke (1986) and Gaskell & Peterson (1987). To evaluate the uncertainty in the derived lag, we followed a model independent Monte Carlo approach that incorporated both flux randomization (FR) and random subset sampling (RSS) described in Peterson et al. (1998). For each Monte Carlo iteration we found the lag using the centroid of the CCF utilizing all points within 60% of the peak of the CCF in the case of DCF. However, for ICCF the peak of the CCF was considered as a representation of the lag between the light curves. This was repeated for 10,000 times and the distribution of the CCF lags were obtained for both DCF and ICCF methods. The mean of the distributions were taken to represent the lag between the light curves and the spread in the distributions was used to estimate the error in the lag. The distributions obtained using both using DCF (green histogram) and ICCF (black histogram) are given in Fig. 12 for the source Fairall 9. We found no noticeable time lag between flux variations in NUV and FUV bands, though the flux variations between different NUV and FUV bands were correlated. This analysis repeated for all the sources studied here, yielded no measurable lags in any of them.
6 Conclusion
In the present work, we report the variability of fourteen Seyfert galaxies in the UV band using data from IUE acquired over a period of about 17 years. The flux values for the sources studied here in different NUV and FUV bands were taken from Dunn et al. (2006). Various analysis were performed to characterize the flux variability of the sources. The summary of the work is given below
.
-
1.
All sources were found to show flux variations in the UV band. No statistically significant difference in the amplitude of flux variations between shorter and longer wavelengths was noticed.
-
2.
No time lag between flux variations in different NUV and FUV bands was observed
-
3.
We found a mild negative correlation of variability with bolometric luminosity with high luminous sources showing low variability than their less luminous counterparts. Also, a hint for a positive correlation is found between variability and black hole mass. These results are consistent with what is known in literature.
-
4.
Majority of source showed a bluer when brighter trend in the FUV data, however, such trend if any in NUV band is seen only in a minority of the sources that too moderately. Some sources showed a hardening of the spectrum with flux, however, the spectrum remained non-variable beyond certain flux level. The observed spectral variations are thus complex.
Acknowledgement
We thank the anonymous referee for his/her critical comments that helped to improve the manuscript
References
- [1] Bentz, M. C., Katz, S., 2015, PASP, 2015, 127, 67
- [2] Bessel M.S., 1979, PASP, 91, 589
- [3] Cardelli, J. A., Clayton, G. C., & Mathis, J. S. 1989, ApJ, 345, 245
- [4] Dunn, J. P., Jackson, B., Deo, R. P., et al. 2006, PASP, 118, 572
- [5] D. Alloin et al. 1995, A&A, 293, 293A
- [6] Edelson, R. 1992, ApJ, 401, 516
- [7] Edelson, R. A., Saken, J., Pike, G., et al. 1991, ApJL, 372, L9
- [8] Edelson, R. A., & Krolik, J. H. 1988, ApJ, 333, 646
- [9] Frank, J., King, A., & Raine, D. J. 2002, Accretion Power in Astrophysics, by Juhan Frank and Andrew King and Derek Raine, pp. 398. ISBN 0521620538. Cambridge, UK: Cambridge University Press, February 2002., 398
- [10] Gaskell C. M., Peterson B. M., 1987, ApJS, 65, 1
- [11] Gaskell C. M., Sparke L. S., 1986, ApJ, 305, 175
- [12] Giveon U., Maoz D, Kapsi S., Netzer H., Smith P.S., 1999, MNRAS, 306, 637
- [13] Greenhill L. J., Gwinn, C. R., 1997, Ap&SS, 248, 261
- [14] Lohfink, A. M., Reynolds, C. S., Vasudevan, R., Mushotzky, R. F., & Miller, N. A. 2014, Apj, 788, 10
- [15] Lynden-Bell, D. 1969, Nature, 223, 690
- [16] Meusinge H., Weiss V., 2013, A&A, 560, A104
- [17] Paltani, S., & Courvoisier, T. J.-L. 1994, A&A, 291, 74
- [18] Paltani S., Walter R., 1996, A&A, 312, 55
- [19] Paltani S., Courvoisier T., 1997, A&A, 323, 717
- [20] Bradley M. Peterson, Ignaz Wanders, Keith Horne, Stefan Collier, Tal Alexander, Shai Kaspi and Dan Maoz
- [21] Rakshit S., Stalin C.S., 2017, ApJ, 842, 96
- [22] Rees, M. J. 1984, ARAA, 22, 471
- [23] Rodriguez-Pascual et al., A&A, 72, 327
- [24] Sakata, Y., Morokuma, T., Minezaki, T., et al. 2011, ApJ, 731, 50
- [25] Schlafly, E. F., & Finkbeiner, D. P. 2011, ApJ, 737, 103
- [26] Stalin, C. S., Gopal Krishna, Sagar, R., & Wiita, P. J. 2004, Journal of Astrophysics and Astronomy, 25, 1
- [27] Ulrich, M.-H., Maraschi, L., & Urry, C. M. 1997, ARAA, 35, 445
- [28] Daniel E. Vanden Berk, Brian C. Wilhite, Richard G. Kron, Scott F. Anderson, Robert J. Brunner, Patrick B. Hall, Željko Ivezić, Gordon T. Richards, Donald P. Schneider, Donald G. York, 2004, ApJ, 601, 692
- [29] Vaughan, S., Edelson, R., Warwick, R. S., & Uttley, P. 2003, MNRAS, 345, 1271
- [30] Wagner, S. J., & Witzel, A. 1995, ARAA, 33, 163
- [31] Wang, X. Y.; Dai, Z. G.; Lu, T. 2001 ApJ, 556, 1010
- [32] Welsh, B. Y., Wheatley, J. M., & Neil, J. D. 2011, A&A, 527, A15
- [33] Welsh, W. F., Peterson, B. M., Koratkar, A. P., & Korista, K. T. 1998, ApJ, 509, 118
- [34] Wilhite, Brian C.; Vanden Berk, Daniel E.; Kron, Richard G.; Schneider, Donald P.; Pereyra, Nicholas; Brunner, Robert J.; Richards, Gordon T.; Brinkmann, Jonathan V. 2005, ApJ, 633, 638
- [35] Wilhite, Brian C.; Brunner, Robert J.; Grier, Catherine J.; Schneider, Donald P.; vanden Berk, Daniel E., 2008, MNRAS, 383, 1232
- [36] Wold M., Brotherton M.S., Shang Z., 2007, MNRAS, 375, 989
- [37] Zhang Xue-Guang, Feng, L, 2017, MNRAS, 464, 2203
- [38] Zuo, Wenwen; Wu, Xue-Bing; Liu, Yi-Qing; Jiao, Cheng-Liang, 2012, ApJ, 758, 104