Characterization of Electro-Optical Devices with Low Jitter Single Photon Detectors – Towards an Optical Sampling Oscilloscope Beyond
1 Introduction
Single photon counting 1 has found broad applications within quantum technologies, such as quantum sensing 2, quantum information 3 and quantum communication 4. More recently it was proposed 5 that low jitter single photon detectors could be used to realize optical random sampling scopes with a bandwidth well beyond , a range not accessible with existing measurement instrumentation. Such instrumentation is suitable to support research on next generation electro-optical devices such as EOMs and VCSELs. In this demo session paper, we showcase a proof of principle measurement and characterize commercial SFP+ modules using both Single Photon Avalanche Detectors (SPADs) and Superconducting Nanowire Single Photon Detectors (SNSPDs) with down to jitter (FWHM). Both detectors are capable of detecting signals in the femtowatt regime. The SPAD provides an effective measurement bandwidth of about . The SNSPD provides a measurement that is free of typical detector artefacts, such as ringing and non-linearity. With the jitter of current SNSPDs reaching into the few picosecond regime 5 the method holds promise to enable a measurement bandwidth well beyond . This research is timely and innovative and will appeal to the audience. All data shown below will be measured live at the demo session setup. Visitors will have access to a modern graphical touch interface that will enable them to control all measurement parameters and experience the single photon optical sampling technique on site.
2 Measurement Setup
a)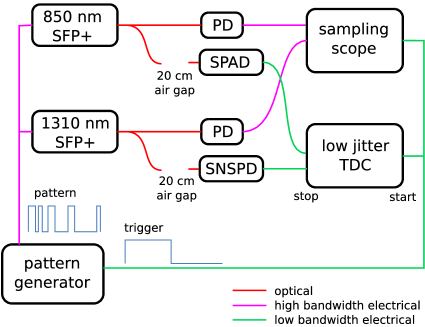
b)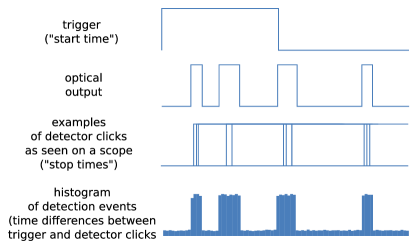
Fig.1 illustrates the measurement setup as presented in the ECOC demo session. The setup measures the modulation response and eye diagram of an MMF (FINISAR FTLX8574D3BCL, 10 Gbit/s) and a SMF (Juniper EX-SFP-10GE-LR-C-UL, 10 Gbit/s) SFP+ module, simultaneously with the single photon counting approach exploited herein and with a state-of-the-art test system ( InGaAs photodiode, Thorlabs DXM30BF, and oscilloscope, Keysight Infiniium). Each optical output of the SFP+ modules is split with fiber splitters. One arm of each output is directed to a photodiode (PD) and oscilloscope. The second arm is left open and the light is allowed to travel through about air gap after which a fraction of the intensity is picked up with an optical fiber again and directed to the SPAD (Silicon APD, IDQ 100) and SNSPD (Scontel) for and , respectively. The air gap provides an attenuation on the order of 100 dB and the distance and coupling efficiency of the gap is used to adjust the photon count rates on the detectors under CW illumination to about 1 Mcounts/s. This count rate ensures that the average time between two photon detection events is much larger than the detector dead times (about ) such that the single photon detectors are operated in the linear range well below saturation. The outputs from the single photon counters are connected to two independent channels of a multichannel time-to-digital converter (TDC), that is implemented in a Kintex 7 FPGA by exploiting carry chains of the dedicated adders as tapped delay lines 6. A low jitter pattern generator delivers two synchronous output patterns: one output generates the 10 Gbit/s pattern that is applied to the SFP+ modules. A second output generates a trigger pulse for each bit pattern that is applied to the oscilloscope and to a third channel of the TDC. The random sampling measurements proceeds as follows (see Fig. 1b). The optical pattern and the trigger pulses are generated repeatedly with a rate on the order of 10 MHz. The triggers are used as ”start” clicks and detected photons are used as ”stop” clicks. Note that with the given photon count rates (imposed by the detector dead times), on average less than one photon is detected per cycle. The TDC measures the time differences between ”start” clicks and ”stop” clicks and accumulates them in a histogram, thereby providing a random sampled representation of the optical intensity. It is instructive to consider the analog bandwidth of distinct signal paths of the system (see also Fig. 1a). The photodiodes are connected to the oscilloscope via suitable 2.92 mm coaxial lines that provide analog bandwidth. By contrast, the analog bandwidth of the electrical pulses that are output by the single photon detectors is only a few GHz. Thus, simple RG 316 SMA cables and input discriminators with moderate bandwidth (Texas Instruments LMH7322, maximum toggle rate , jitter ) are enough to deliver the detector signals to the TDC. This aspect is important: in an optical sampling scope based on single photon detectors, the measurement bandwidth is determined by the jitter of the single photon detectors and not by the analog bandwidth of the receiver. This enables us to conceive an optical sampling scope with a bandwidth that could reach into the THz regime without the need of handling high frequency electrical signals.
3 Results
a)b)
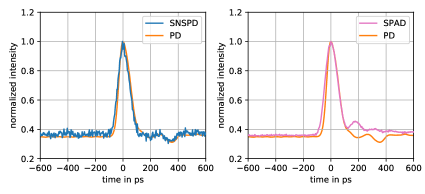
We first characterize the pulse response of both single photon detectors by applying isolated 1 bit pulses to the SFP+ modules, providing nominally long optical output pulses. Fig. 2 shows the measured optical pulses. The results obtained with single photon counting are compared to the measurements with the photodiodes and they are generally in good agreement. At the same time, distinct measurement artefacts are apparent. In case of the photo diode the main peak is slightly skewed and weak ringing is observed, seen as a shoulder at about +. The single photon counting measurements provide an ideal Gaussian pulse shape and are free of ringing and electrical reflections. On the other hand, the SPAD is subject to afterpulsing7, which unfolds as a weak exponential tail with a time constant of about , here modulated with weak oscillations from the VCSEL itself. The response function of the SNSPD is artefact free: an ideal symmetric pulse response is obtained that is only limited by the Gaussian broadening induced by the detector jitter. Please note that the weak dip at about + is a true intensity dip that is present in the optical signal.
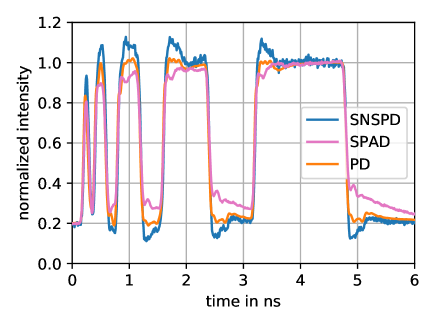
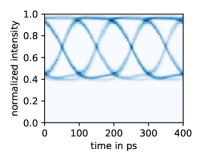
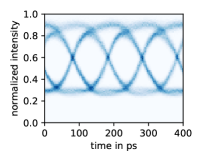
To better illustrate the effects of the afterpulsing present with the SPAD, we proceed to measure optical square pulses with increasing period (see Fig. 3). The afterpulsing tails are now more apparent. Since the detector pulse response enters the measurement via a convolution, for pulses with longer period, the afterpulsing tail, respectively ringing is accumulated over a longer range and distorts the signal more strongly. For the SNSPD, an artefact free measurement is obtained. Note that the noise on the single photon counting measurements are purely due to shot noise and can be improved to the desired precision by averaging for a longer time. For the present proof of principle demonstration, we proceed and measure the eye diagrams of the SFP+ modules (see Fig. 4). For this measurement, we apply random 8b10b symbols to the SFP+ modules. To acquire this data with single photon counting, one histogram is accumulated for each 8b10b symbol and the data is combined to a two-dimensional histogram. With this measurement, the effect of the skewed pulse response of the photodiode becomes apparent. It unfolds as a distortion of the respective eye diagrams. By contrast, the single photon counting measurements are free of distortions due to their inherent Gaussian pulse responses.
SPAD,
 SNSPD,
 PD,
PD,
 PD,
PD,
4 Conclusions
We have demonstrated a proof-of-principle optical sampling scope based on low jitter single photon detectors and have applied it to measure the pulse response and eye diagram of two commercial SFP+ modules. Thereby, we have studied the performance of two types of modern single photon counting detectors, one, a Si-SPAD, that is operated at room temperature and useable in the visible wavelength range, and a second one, an SNSPD, that requires cryogenic operation and that is optimized for the and telecom bands and useable over an extended optical wavelength range. We observed that both detectors provide accurate and undistorted eye diagram measurements, which we explained with their nearly ideal Gaussian pulse responses. We found that the SPAD results in significant distortion when measuring a step response, which we attributed to the afterpulsing tail. The SNSPD, which does not suffer from afterpulsing, provided an ideal step response measurement. The measurement scheme allows for the detection of very low optical powers down to the femtowatt regime and can provide very high optical measurement bandwidth without requiring high bandwidth electrical signals. The measurements presented herein are limited by the jitter of the photodetectors, which is (FWHM) for the SPAD and (FWHM) for the SNSPD, respectively. This translates into an effective measurement bandwidth of , respectively . Recently SNSPDs with jitter (FWHM) were reported5, translating into an effective measurement bandwidth of about . At present, there is no technical limit known for the jitter achievable with single photon detectors and it is expected that it will be significantly further reduced within the next few years. This opens the perspective for optical sampling scopes with a bandwidth well beyond . The TDC used in the present study has an RMS jitter of and will be the limiting factor in future optical sampling scopes. This calls for the implementation of low jitter multichannel TDCs with short dead times (no more than few ns) that will enable a novel class of single photon based optical sampling scopes.
5 Acknowledgements
We thank Matthew Shaw and Boris Korzh from JPL and Vikas Anant from Photon Spot for fruitful discussions.
References
- 1 W. Becker, “Advanced Time-Correlated Single Photon Counting Techniques,” Springer, Berlin (2005).
- 2 C. L. Degen, F. Reinhard, and P. Cappellaro, “Quantum Sensing,” Rev. Mod. Phys. 89, 035002 (2017).
- 3 C. H. Bennett and D. P. DiVincenzo “Quantum information and computation,” nature 404, 247-255 (2000)
- 4 N. Gisin and R. Thew “Quantum communication,” nat. phot. 1, 165-171 (2007)
- 5 B. A. Korz et al. “Demonstrating sub-3 ps temporal resolution in a superconducting nanowire single-photon detector,” arXiv:1804.06839 (2018).
- 6 C. Favi and E. Charbon “A 17ps time-to-digital converter implemented in 65nm FPGA technology,” Proc. ACM/SIGDA intern. symp. on FPGAs, ACM, 113-120 (2009).
- 7 A. W. Ziarkash, S. K. Joshi, M. Stipčević, and R. Ursin “Comparative study of afterpulsing behavior and models in single photon counting avalanche photo diode detectors,” arXiv:1701.03783 (2017)