The intrinsic Baldwin effect in NLSy 1 galaxies
Abstract:
The intrinsic Baldwin effect is an anti-correlation between the line equivalent width and the flux of the underlying continuum detected in a single variable active galactic nucleus (AGN). This effect, in spite of the extensive research, is still not well understood, and might give us more information about the physical properties of the line and continuum emission regions in AGNs. Here we present preliminary results of our investigation of the intrinsic Baldwin effect of the broad H line in several Narrow-line Seyfert 1 (NLSy 1) galaxies, for which data were taken from the long-term monitoring campaigns and from the Sloan Digital Sky Survey Reverberation Mapping project.
1 Introduction
Broad line region (BLR) of active galactic nuclei (AGNs) is found relatively near to the energetic source of ionization that comes from the accretion disk, thus the conditions of the BLR gas are such that it is hard to compare them with those in other well studied astrophysical objects. As a consequence many of the standard techniques, previously derived to probe the physics of e.g. photoionized nebulae, are often unable to give reliable results when applied to the BLR. The intrinsic Baldwin effect (Beff) is an anti-correlation between the emission line equivalent width and the flux of the underlying continuum detected in a single variable AGN [1]. Recently, we studied intrinsic Beff on sample of six type 1 AGNs, including two Seyfert 1, two AGNs with very broad double-peaked lines, one NLSy1 galaxy and one high-luminosity quasar [2]. We found that all six galaxies exhibit intrinsic Beff, including the NLSy1 Ark 564, and that this effect is probably not caused by the geometry of the broad line region (BLR). Additionally, we showed that there is no connection between global and intrinsic Beff [2].
Taking into account our first small sample of only 6 objects (with only one NLSy1), our findings should be tested on a larger number of different AGNs. Therefore, we aim to study the intrinsic Beff on a sample of type 1 AGN taken from the Sloan Digital Sky Survey Reverberation Mapping project (SDSS-RM). Here we present our preliminary results of our study of the intrinsic Beff of broad H line in five NLSy1 galaxies from SDSS-RM, compared to the findings in Ark 564 from [2].
2 Data and Methods
We selected objects from SDSS-RM explained in [3] with and we cross-matched with NLSy 1 catalog of [4]. Additionally, we used the data of long-term monitored NLSy1 galaxy Ark 564 published in [2, 5]. The information on selected objects is given in Table 1.
| Name | RA | DEC | z | Period | No. of Spectra | S/N | Our notation |
|---|---|---|---|---|---|---|---|
| (1) | (2) | (3) | (4) | (5) | (6) | (7) | (8) |
| J141308.10+515210.3 | 213.28377 | 51.86955 | 0.288 | 56660–57518 | 48 | 13 | N1 |
| J141721.80+534102.6 | 214.34082 | 53.68406 | 0.193 | 56660–57518 | 48 | 33 | N2 |
| J141427.88+535309.6 | 213.6162 | 53.88602 | 0.242 | 56660–57518 | 48 | 10 | N3 |
| J141419.84+533815.3 | 213.58268 | 53.6376 | 0.164 | 56660–57518 | 48 | 45 | N4 |
| J141408.76+533938.2 | 213.5365 | 53.66063 | 0.191 | 56660–57518 | 48 | 23 | N5 |
| Ark 564 | 340.6625 | 29.72530 | 0.025 | 51424–54414 | 92 | ¿50 | – |
We rescale spectra taking that the flux of [OIII] remained constant within the monitored period [6]. To remove the host galaxy contribution we used Simple Stellar Population method (SSP) [4, 7]. With this method observed spectrum (where we used median smoothing to mask emission lines) can be approximated with:
The left part of the previous equation represents the host galaxy contribution, where is the amplitude of individual SSP template (), which is broadened with Gaussian broadening function ( being stellar velocity dispersion), while, on the right side, AGN is represented as in the form of the power law .
In order to subtract narrow and satellite lines and extract the broad component, we simultaneously fitted emission lines including the local continuum, in the wavelength region from 4200 Å to 5500 Å. Lines included in the fit were: H (two components: broad and narrow), HeII (broad and narrow), H (broad and narrow), forbidden lines [OIII]4363,4959,5007 Å and the FeII template111Fe II template is available on http://servo.aob.rs/FeII_AGN/ from [8] and [5]. For further investigation of the intrinsic Beff we followed methods from [2].
3 Results and Discussion
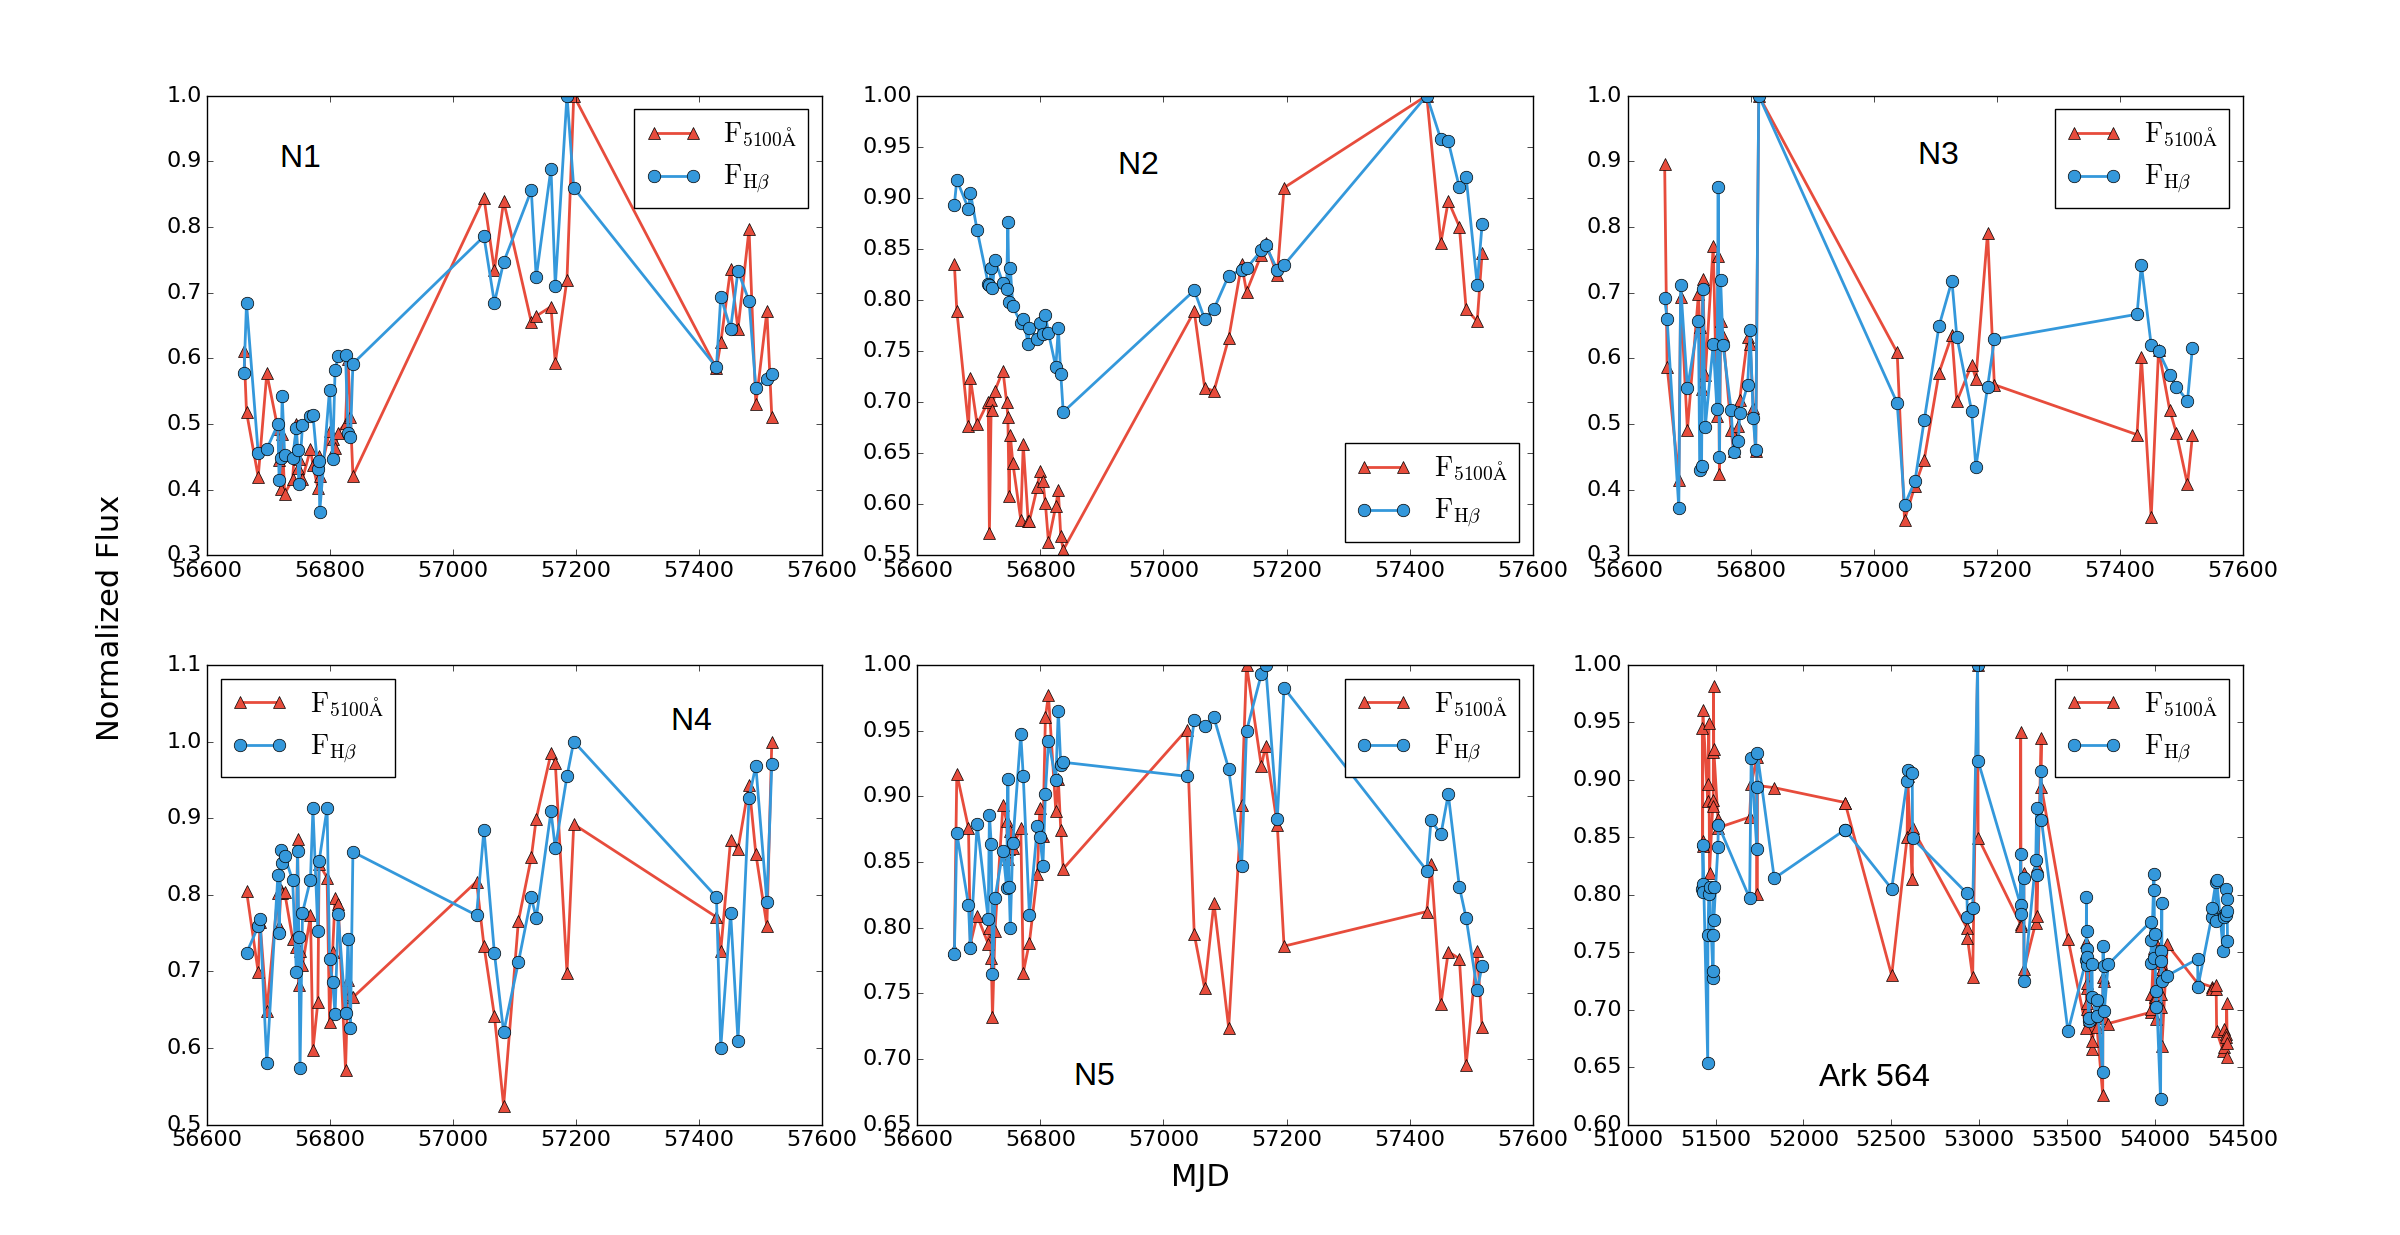
In Fig. 1 the light curves of the continuum and H fluxes of the five NLSy1 galaxies selected from SDSS-RM are shown together with the light curves of Ark 564 [2]. In order to compare changes in the light curve of with corresponding changes in light curves of we show fluxes normalized to the maximum value. It is straightforward to see that the flux of H is not strictly following the changes in the continuum flux, e.g. where we have local minimum in we have a local maximum in (see for e.g. light curve of N5 in Fig. 1) and vice versa. This might suggest the existence of an additional continuum emission, which we previously discussed in [2].
In Fig. 2 we showed relationship between continuum flux at 5100 Å and flux of the H. The strongest correlation (0.782) is found in N1 object, while weakest in N5 object (0.442). In case of all objects there is the linear correlation between the line and continuum flux.

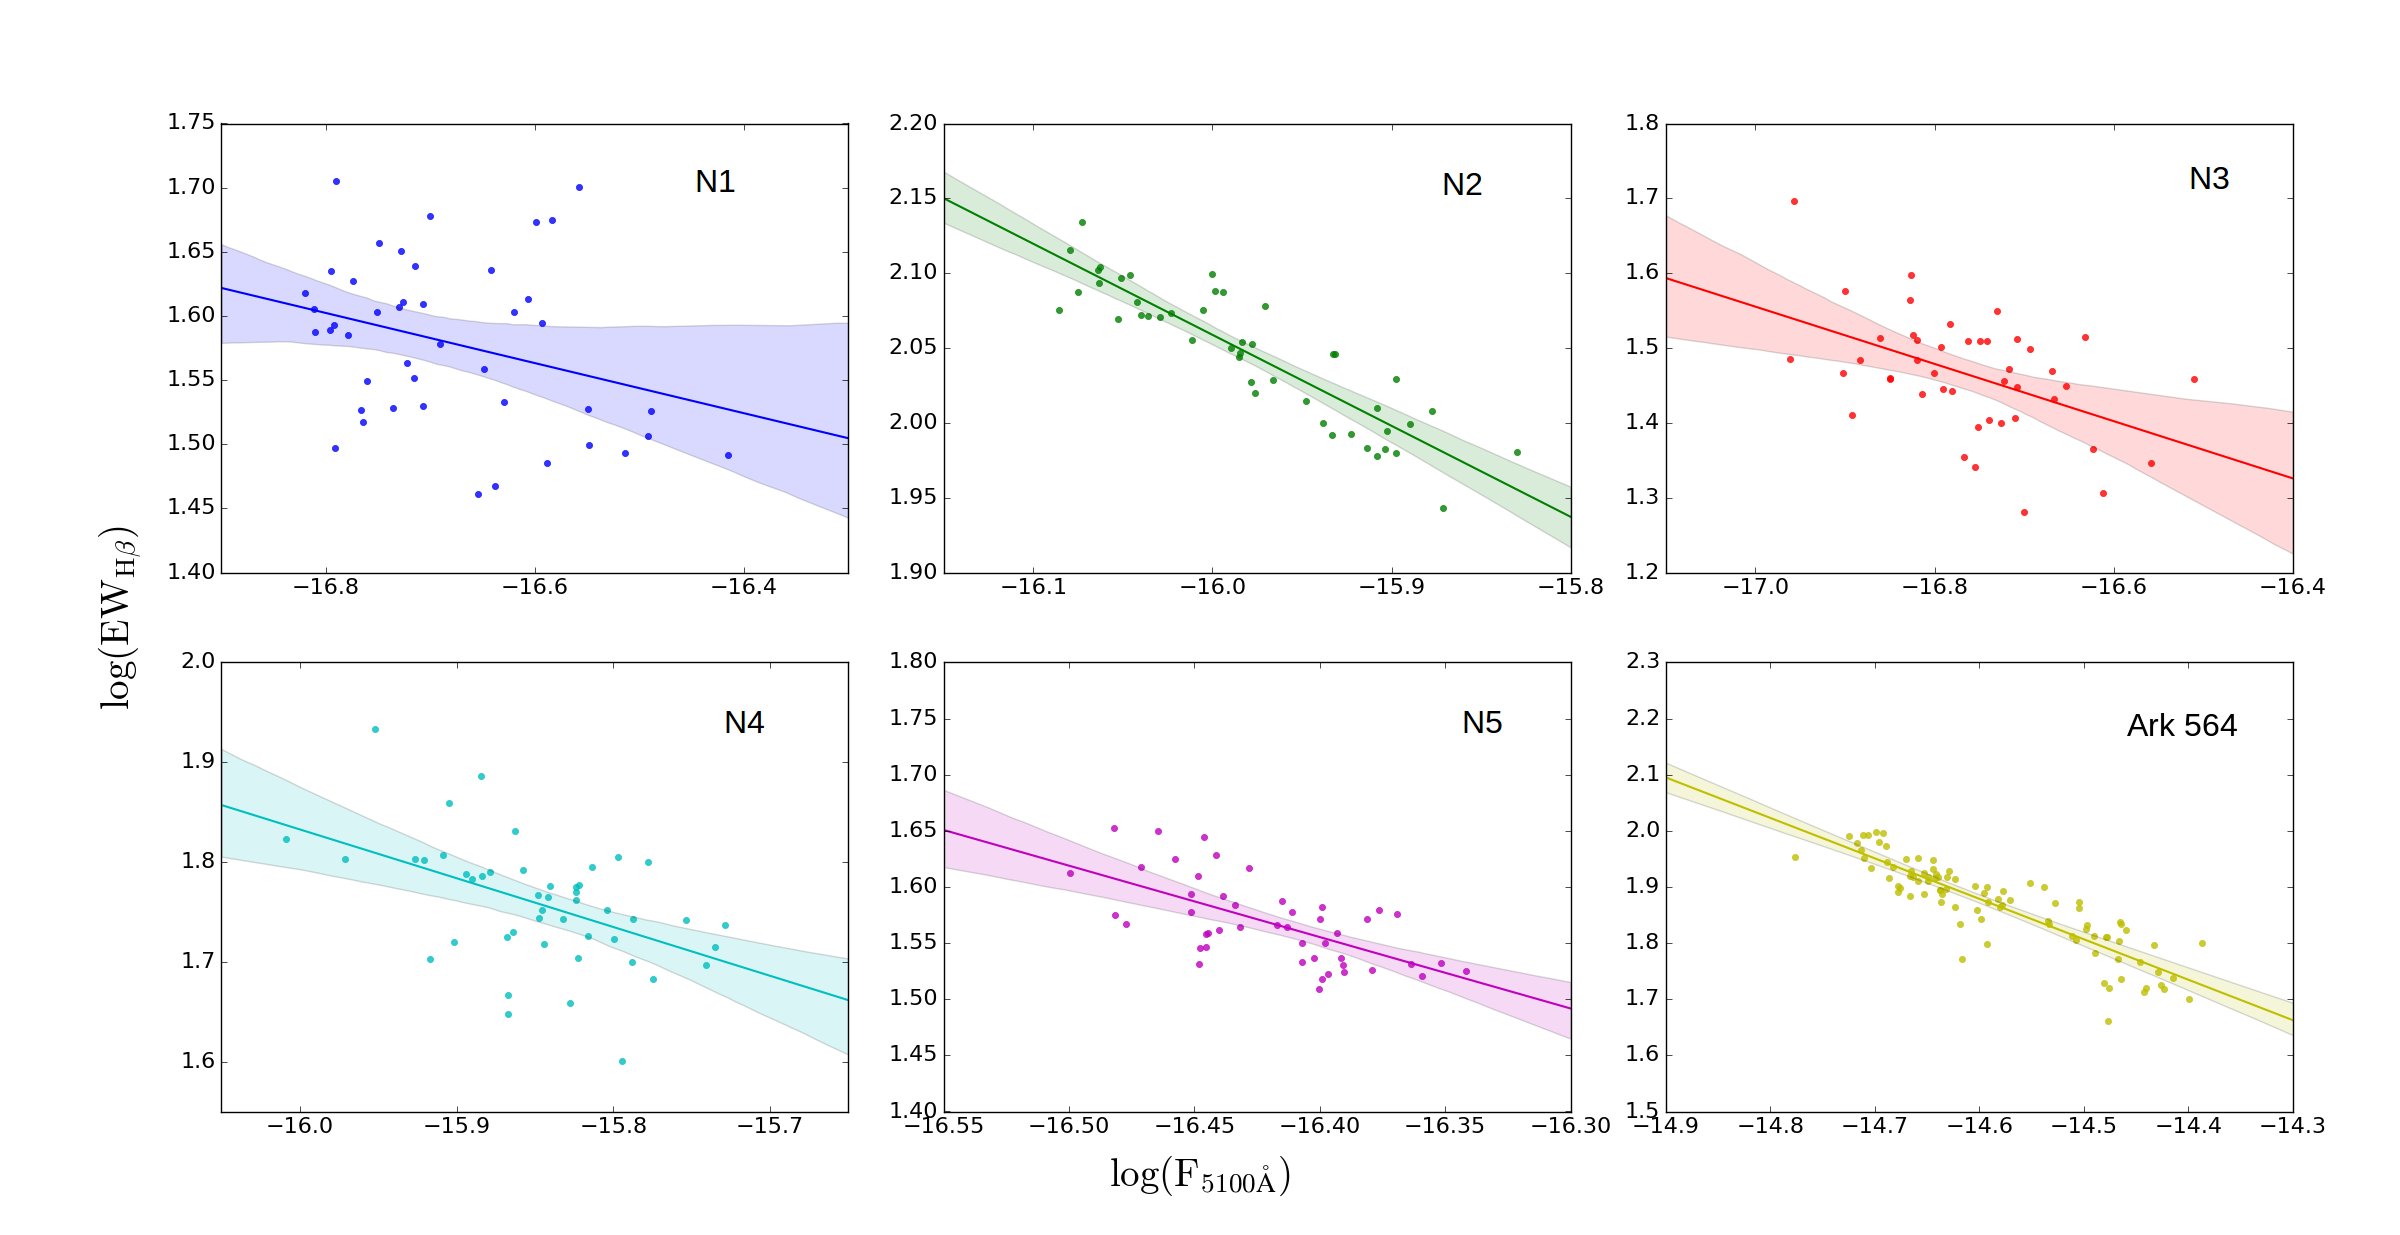
In Fig. 3 we present the intrinsic Beff of selected galaxies together with Ark 564. We found that all galaxies except N1 are exhibiting intrinsic Beff. Calculated Pearson correlation of line flux versus continuum flux and parameters of linear fit together with the calculated Pearson correlation for the intrinsic Beff for all considered objects are given in the Table 2. Interestingly, in Ark 564 there is a weak correlation between line and continuum flux, but there is the strongest intrinsic Beff present. We note that Ark 564 has been monitored for 11 years, while SDSS galaxies for only about 2.5 years, this might be the reason behind weaker correlation found in SDSS galaxies.It is also important to emphasize that in the case of SDSS objects, line fluxes are not corrected for the time delay with respect to the continuum. However, we do not expect this will have significant impact on the Baldwin effect results, since in NLSy1 the time delay is small and the variability is weak, e.g. we tested this effect in case of Ark 564 which has the time delay of 5 days and weak variability of 10% [5], and there is no difference in the result. But in general, it is necessary to determine EW so that it represents the real emission line response to the continuum that actually hit the BLR at time when the line was emitted (see [2, 9, 10]). We notice that objects showing weaker correlation between line and continuum flux, are on the other hand having stronger intrinsic Beff. It may be that the stronger intrinsic Beff is explained with the presence of an additional continuum emission, as previously discussed in [2].
| Object | Line flux vs. cnt. flux | Intrinsic Beff | ||||||
|---|---|---|---|---|---|---|---|---|
| Name | Pearson correlation | Linear fit | Pearson correlation | Linear fit | ||||
| r | P | slope | intercept | r | P | A | ||
| J141308.10+515210.3 | 0.782 | 29.0 | 2 | -0.309 | -0.195 | -1.677 | ||
| J141721.80+534102.6 | 0.781 | 43.1 | 7 | -0.891 | -0.608 | -7.671 | ||
| J141427.88+535309.6 | 0.697 | 18.6 | 2 | -0.483 | -0.382 | -4.946 | ||
| J141419.84+533815.3 | 0.5158 | 29.9 | 4 | -0.484 | -0.498 | -5.990 | ||
| J141408.76+533938.2 | 0.442 | 13.3 | 9 | -0.635 | -0.636 | -8.875 | ||
| Ark 564 | 0.592 | 20.1 | -0.879 | -0.721 | -8.642 | |||
Acknowledgements
This conference has been organized with the support of the Department of Physics and Astronomy “Galileo Galilei”, the University of Padova, the National Institute of Astrophysics INAF, the Padova Planetarium, and the RadioNet consortium. RadioNet has received funding from the European Union’s Horizon 2020 research and innovation programme under grant agreement No 730562. This paper is based upon work from COST Action CA16104 ”GWverse”, supported by COST (European cooperation in Science and Technology). This work is a part of the project (176001) ”Astrophysical Spectroscopy of Extragalactic Objects”, supported by the Ministry of Education, Science and Technological Development of Serbia and the project ”Investigation of super-massive binary black holes in the optical and X-ray spectra” supported by the Ministry of Science and Technology of R. Srpska.
References
- [1] J. A. Baldwin, Luminosity Indicators in the Spectra of Quasi-Stellar Objects, ApJ 214 (1977) 679.
- [2] N. Rakić, G. La Mura, D. Ilić, A. I. Shapovalova, W. Kollatschny, P. Rafanelli et al., The intrinsic Baldwin effect in broad Balmer lines of six long-term monitored AGNs, A&A 603 (2017) A49 [1703.06188].
- [3] Y. Shen, W. N. Brandt, K. S. Dawson, P. B. Hall, I. D. McGreer, S. F. Anderson et al., The Sloan Digital Sky Survey Reverberation Mapping Project: Technical Overview, ApJS 216 (2015) 4 [1408.5970].
- [4] S. Rakshit, C. S. Stalin, H. Chand and X.-G. Zhang, A Catalog of Narrow Line Seyfert 1 Galaxies from the Sloan Digital Sky Survey Data Release 12, ApJS 229 (2017) 39 [1704.07700].
- [5] A. I. Shapovalova, L. Č. Popović, A. N. Burenkov, V. H. Chavushyan, D. Ilić, A. Kovačević et al., Spectral Optical Monitoring of the Narrow-line Seyfert 1 Galaxy Ark 564, ApJS 202 (2012) 10 [1207.1782].
- [6] B. M. Peterson, Reverberation mapping of active galactic nuclei, PASP 105 (1993) 247.
- [7] X.-G. Zhang, Optically selected BLR-less active galactic nuclei from the SDSS Stripe82 Database - I. The sample, MNRAS 438 (2014) 557 [1311.4399].
- [8] J. Kovačević, L. Č. Popović and M. S. Dimitrijević, Analysis of Optical Fe II Emission in a Sample of Active Galactic Nucleus Spectra, ApJS 189 (2010) 15 [1004.2212].
- [9] K. M. Gilbert and B. M. Peterson, An Intrinsic Baldwin Effect in the H Broad Emission Line in the Spectrum of NGC 5548, ApJ 587 (2003) 123 [astro-ph/0212379].
- [10] M. R. Goad and K. T. Korista, Interpreting broad emission-line variations - I. Factors influencing the emission-line response, MNRAS 444 (2014) 43 [1407.5004].