First principles modeling of the structural, electronic, and vibrational properties of Ni40Pd40P20 bulk metallic glass
Abstract
The structural, vibrational, and electronic properties of Ni40Pd40P20 bulk metallic glass have been studied using ab initio molecular-dynamics simulations and total-energy optimization. Structural analyses of the resulting ab initio models show the presence of a few to no P-P bonds and two main building blocks, consisting of tricapped trigonal prism (TTP) and capped square anti-prism (CSAP) with P as the center of these blocks. The computed Pd and Ni K-edge spectra of extended x-ray absorption fine structure (EXAFS) are found to be in good agreement with experimental data. The configurational averaged static structure factor and the generalized vibrational density of states are also observed to be in good agreement with experimental data.
I Introduction
Metallic glasses (MG) are a class of amorphous metallic alloys that are produced by rapid quenching from a molten state at a sufficiently fast cooling rate so that crystal nucleation and growth can be avoided. The ability of a metal alloy to form a glass – the so called glass forming ability (GFA) – depends on the critical cooling rate, which is defined as the slowest cooling rate at which the melt can be quenched into a glassy state. The smaller the critical cooling rate, the higher the GFA of a metallic alloy.Jafary-Zadeh et al. (2018) Another measure for the GFA of an alloy is the Turnbull criterion.Turnbull and Fisher (1949); Turnbull (1969) The latter predicts that glass formation should occur if the reduced glass transition temperature, , satisfies the condition , where is defined as , with and being the glass transition and melting temperatures of the alloy, respectively. The formation of metallic glasses is a difficult process in comparison with non-metallic glasses, such as silicates, ceramic, and polymeric glasses, because pure metals and ordinary metallic alloys readily crystallize when quenched from a molten state. The first metallic glass, Au75Si25, was reported to be obtained by rapid quenching from the liquid state at a very high cooling rate of 105–106 K/s, with a critical thickness of 50 .Klement Jun et al. (1960) In general, metallic glasses formed via very high cooling rates (105–1010 K/s) have thicknesses in the sub-millimeter range; such metallic glasses are known as conventional metallic glasses (MG). By contrast, a bulk metallic glass (BMG) is defined to be one with a critical thickness of at least a millimeter – the word “bulk” being indicative of the millimeter length scale.Wang et al. (2004) The first BMG was produced from a Pd-Cu-Si alloy by quenching from the melt at a relatively lower cooling rate of 103 K/s.
In comparison to their crystalline metallic counterparts, BMGs possess unique properties such as higher strength, lower Young’s modulus, improved wear resistance, good fatigue endurance, and excellent corrosion resistance, due mainly to the combination of metallic bonding and amorphous structure.Ashby and Greer (2006) As a result, they are extensively employed in biomaterials research and they have potential uses for improved corrosion resistance, biocompatibility, strength, and longevity of biomedical implants, which make BMGs as promising candidates for cardiovascular applications.Jafary-Zadeh et al. (2018); Wang et al. (2004); Schroers et al. (2009); Li and Zheng (2016); Huang et al. (2015) Bulk metallic glasses also find applications in the manufacture of electromagnetic instruments, cell-phone cases, optical mirrors, striking face plate in golf clubs, connecting parts for optical fibers, soft magnetic high-frequency power coils, etc.Inoue et al. (2008) Currently, a wide range of multi-component BMG alloys Wang et al. (2004); Inoue (2000) exists; however, the industrial production of BMGs remains a difficult problem due to the requirement of high cooling rates to produce a metallic glass with a thickness on the macroscopic length scale.
Ni40Pd40P20 was first prepared by Turnbull and co-workers, Drehman et al. (1982); Kui et al. (1984) who employed a critical cooling rate of about 1.4 K/s and the application of B2O3 fluxing method to purify the melt and avoid heterogeneous nucleation. The study indicates that a value of close to 2/3 was achieved in their experiments. In a later work, He et al. He et al. (1996) produced Ni40Pd40P20 BMG using a critical cooling rate of 10-3 K/s.
The computational modeling of BMGs presents a significant challenge due to high atomic coordination and the presence of strong chemical order in the system. This is further compounded by the heavy constituent atoms of BMGs, often involving and electrons, which exacerbate the problem by increasing the computational complexity of density-functional calculations. Furthermore, the quantum-mechanical computations of the energies and forces are hampered by the existence of finite electronic density of states at the Fermi level, which requires extra care for computation of the density matrix and a sophisticated mixing scheme for self-consistent field calculations of energies and forces.
In this paper, we address the structural, electronic, and vibrational properties of Ni40Pd40P20 bulk metallic glass using ab initio molecular-dynamics simulations based on density-functional theory by employing a bigger system size and relatively longer cooling rates. Thus far, only a few ab initio studies on the electronic and structural properties of Ni40Pd40P20 have been reported in literature. Takeuchi et al. (2007); Kumar et al. (2011); Guan et al. (2012); Reyes-Retana and Naumis (2015) The scope of the present study goes much further by addressing the vibrational properties of glassy Ni40Pd40P20, starting with a notably larger model and a relatively slower cooling rate than the ones that were used in earlier studies. This was addressed by examining the phonon/vibrational density of states of the constituent atoms and it was further validated by making comparisons with available experimental data. Since the vibrational properties of a solid are more sensitive to the local structure and composition than their electronic counterpart, it is of crucial importance in the glass-structure determination. The degree of distortion of the local structural motif(s) can readily manifest in the vibrational excitation spectra, given the miniscule amount of energy (with a few tens of meV) needed to excite vibrational motion. More importantly, unlike earlier studies where the results are solely based on a single atomic configuration, the present study is the first of its kind where the effects of configuration averaging on the physical observables have been discussed at length. Given the importance of configuration fluctuations in small multi-component glassy/disordered systems, which are characterized by several distinctly different bonding environments, an averaging over independent configurations is essential to yield statistically reproducible results on structural, electronic, and vibrational properties of glassy systems. To this end, the results presented here were averaged over ten (10) independent structural configurations to minimize the effects of configuration fluctuations.
The layout of the paper is as follows. In sec. II, we present the computational methodology that involves density functional theory based ab initio molecular-dynamics simulations, followed by total-energy relaxation. The results and associated discussions from our simulations are presented in sec. III, with an emphasis on the electronic, structural, and vibrational properties of the glass. Finally the summary and conclusions of our work are presented in sec. IV.
II Computational Methodology
Ab initio molecular-dynamics (AIMD) simulations and subsequent geometry relaxations were performed using the density functional theory code Siesta. Soler et al. (2002) Siesta employs local basis sets, and the electron-ion interactions were described using norm-conserving Troullier-Martins pseudopotentials,Troullier and Martins (1991) factorized in the Kleinman-Bylander form.Kleinman and Bylander (1982) The Perdew-Zunger parameterizationCeperley and Alder (1980); Perdew and Zunger (1981) of the local density approximation (LDA) to the exchange-correlation energy was employed. Single- (SZ) basis functions were used for the finite temperature molecular-dynamics simulation, while double- with polarization (DZP) basis functions were used for geometry relaxations (i.e., total-energy minimizations). Only the -point, =0, was used to perform the Brillouin zone integration.
The Ni40Pd40P20 simulations commenced with the generation of ten (10) independent initial random configurations, each comprising atoms (120 Ni atoms, 120 Pd atoms, and 60 P atoms) placed in a cubic supercell at the experimental density Haruyama (2007) of 9.4 g/cm3. Each configuration was subjected to independent NVT runs by integrating the equations of motion using the velocity-Verlet algorithm, with a time step of fs. The temperature of the system was controlled by a chain of Nosé-Hoover thermostats. Martyna et al. (1996); Hoover (1985); Nosé (1984) The AIMD simulations commenced by equilibrating each system at 2400 K for 20 ps. After equilibration, each system was quenched to 300 K over a period of 200 ps; this corresponds to an average cooling rate of 10.5 K/ps (or 1.05 K/s). The geometry at the end of the 300 K dynamics was optimized by minimizing the total energy using a conjugate-gradient algorithm. The final relaxed geometry was used for structural analysis. The convergence criterion for the geometry optimization was set to a maximum force of 0.01 eV/Å on each atom.
The vibrational density of states of each of the ten (10) geometrically-relaxed configurations was computed within the harmonic approximation. Small atomic displacements of 0.005 Å along six coordinate directions (, , ) were applied to compute the total force on each atom. This corresponds to a total of 6 force computations, where is the number of atoms. The dynamical matrix was constructed from the numerical derivatives of the forces with respect to the atomic displacement and diagonalized to obtain the vibrational eigenfrequencies and eigenvectors. The procedure was repeated for each of ten (10) configurations. All the properties presented in the sections to follow were averaged over the ten (10) independent configurations.
III Results and Discussion
III.1 Structural Properties
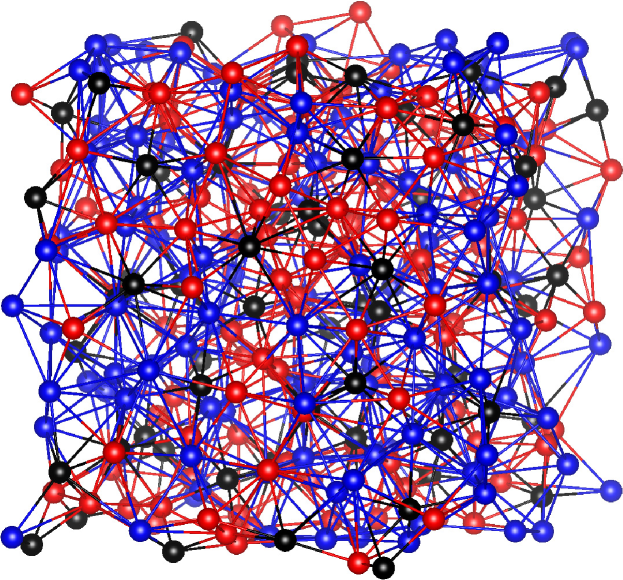
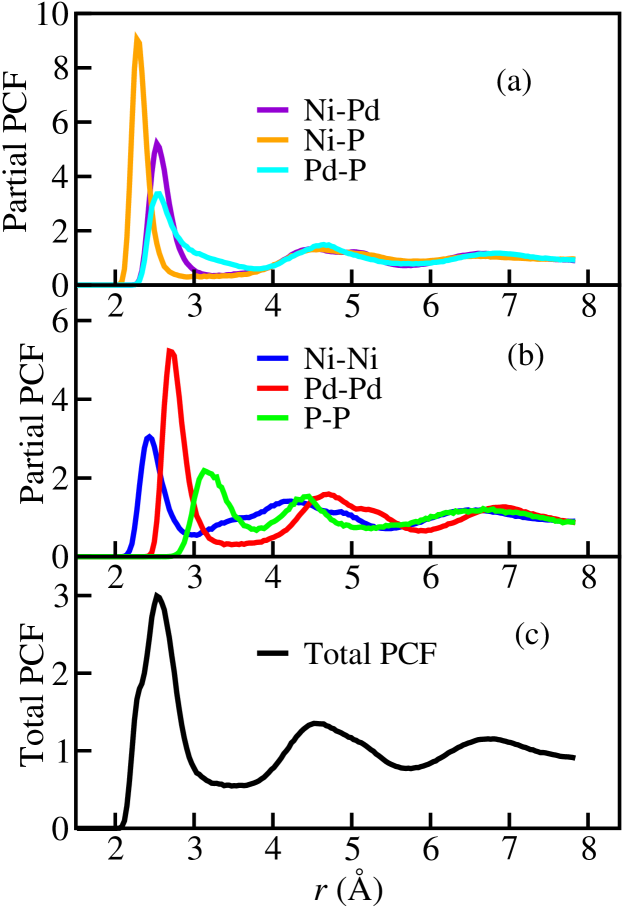
Figure 1 depicts a ball-and-stick model of the optimized atomic structure of Ni40Pd40P20. The continuous-random nature of the network is evident from the distribution of atoms in the network. Due to the dense random nature of the network, atoms can form bonds with a high number of neighboring atoms, resulting in a high coordination number in the range of 7-17 (cf. the values of in Table 2). The configurationally averaged total and partial pair-correlation functions (PCF) are shown in Fig. 2.
While the total PCF exhibits a first minimum near 3.5 Å, the partial PCFs show varying first shell minima, from 2.3 Å for Ni–P to 3.8 Å for Pd–P and P–P. A direct implication of this variation is that there are virtually no or very little P–P bonds in the network. This is evident from the pair-correlation data in Fig. 2(b); the P–P correlation begins from just under 3.0 Å but a significant number of P atoms form a bond with Ni atoms within a distance of 3.0 Å. Table 1 lists the average coordination number, , of each atom, as well as the average number , , and of Ni, Pd, and P, respectively. An examination of Figs. 2(b) and 2(c) suggests that Pd and P has the highest and lowest coordination numbers, respectively. Of all the different bonds formed by Pd, the Pd–Pd bond is the most dominant, followed by Pd–Ni, and Pd–P. In the presence of virtually no P–P bonds, P atoms are segregated in the network from each other. This observation has been noted by Kumar et al.Kumar et al. (2011)
| Atom type | ||||
|---|---|---|---|---|
| Ni | 11.27 | 3.71 | 5.20 | 2.36 |
| Pd | 13.57 | 5.20 | 6.19 | 2.18 |
| P | 9.06 | 4.71 | 4.35 | 0.03 |
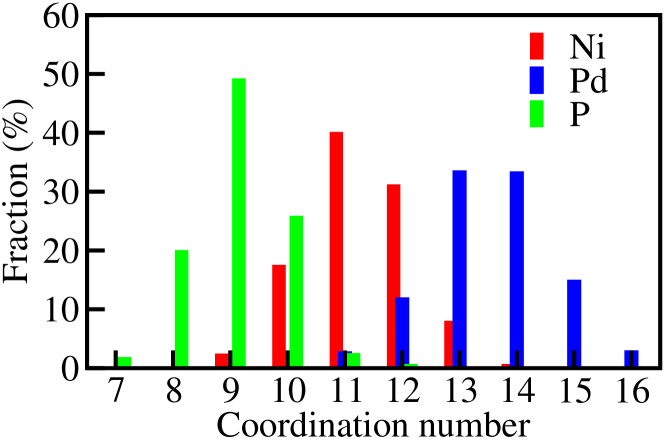
Figure 3 shows the distribution of the average coordination numbers for each atomic species. A further breakdown of the nuances of the coordination numbers is presented in Table 2. From Fig. 3, we see that the coordination numbers for Ni lies in the range from 9 to 15 with 40% of the Ni atoms are 11-fold coordinated and 31% are 12-fold coordinated. A breakdown of 11-fold and 12-fold coordinated atoms for Ni in Table 2 (top) suggests Ni mostly forms bonds with Pd (45%-47%) – an observation that agrees with =5.2 being the largest coordination number for Ni in Table 2. Likewise, the results for Pd in Fig. 3 indicates that the coordination numbers for Pd ranges from 10 to 17, with the dominant coordination numbers being 13 and 14. Pd atoms largely form bonds with another Pd atoms. A similar analysis confirms that nearly 50% of P atoms are 9-fold coordinated, with the remainder being 8 and 10-fold coordinated. An examination of these 8-, 9-, and 10-fold coordinated P atoms in Table 2 shows that P atoms prefers to bond with Pd and Ni atoms (approximately 50% and 46–49%, respectively). Table 2 for P atoms show only 0.3% P-P bonds have been realized in the network. In summary, the bonding trend between atom types observed in this study is consistent with the results from previous ab initio studies based on small models.Kumar et al. (2011); Reyes-Retana and Naumis (2015)
| Ni | ||||
|---|---|---|---|---|
| bonded to Ni | bonded to Pd | bonded to P | ||
| (%) | (%) | (%) | (%) | |
| 9 | 2.4 | 22.6 | 56.3 | 21.1 |
| 10 | 17.5 | 28.3 | 50.4 | 21.3 |
| 11 | 40.1 | 32.1 | 47.0 | 20.9 |
| 12 | 31.2 | 34.4 | 45.1 | 20.5 |
| 13 | 8.0 | 40.4 | 38.3 | 21.3 |
| 14 | 0.7 | 42.9 | 33.9 | 23.2 |
| 15 | 0.1 | 46.7 | 26.7 | 26.7 |
| all | 100 | 33.0 | 46.1 | 20.9 |
| Pd | ||||
| N | bonded to Ni | bonded to Pd | bonded to P | |
| (%) | (%) | (%) | (%) | |
| 10 | 0.2 | 10.0 | 80.0 | 21.1 |
| 11 | 2.8 | 30.0 | 57.6 | 21.3 |
| 12 | 11.9 | 34.6 | 51.0 | 20.9 |
| 13 | 33.5 | 35.7 | 48.7 | 20.5 |
| 14 | 33.3 | 39.6 | 44.5 | 21.3 |
| 15 | 14.9 | 42.0 | 40.2 | 23.2 |
| 16 | 2.9 | 47.7 | 32.7 | 26.7 |
| 17 | 0.5 | 54.9 | 23.5 | 26.7 |
| all | 100 | 38.3 | 45.6 | 16.1 |
| P | ||||
| N | bonded to Ni | bonded to Pd | bonded to P | |
| (%) | (%) | (%) | (%) | |
| 7 | 1.8 | 57.1 | 42.7 | 0 |
| 8 | 20.0 | 50.9 | 49.1 | 0 |
| 9 | 49.2 | 50.6 | 49.3 | 0.2 |
| 10 | 25.8 | 53.4 | 45.9 | 0.7 |
| 11 | 2.5 | 60.0 | 38.2 | 1.8 |
| 12 | 0.7 | 52.1 | 47.9 | 0 |
| all | 100 | 51.8 | 47.9 | 0.3 |
Figure 4 presents the atom-centered bond-angle distributions for Ni, Pd, and P. The distributions show a bi-modal character with peaks in the vicinity of 60∘10∘ and 120∘10∘. The peak positions for the P-centered bond-angle distribution are particularly noteworthy because they bear close resemblance to the angular distribution of water molecules around +3 lanthanide and actinide metal ions.Atta-Fynn et al. (2011) In +3 lanthanide and actinide ions, the geometry of water molecules with an angular distribution similar to the P-centered bond-angle distribution takes the form of tricapped trigonal prism (TTP) and capped square anti-prism (CSAP), both correspond to a metal coordination of 9. The bond-angle distributions of ideal TTP and CSAP geometries are shown in Fig. 4 as a palisade of -functions. It is evident that the peaks in the P-centered bond-angle distribution closely follow the center of the -functions from ideal TTP and CSAP structures, indicating the presence of distorted TTP and CSAP structural units in Ni40Pd40P20 glass. To examine this further, we performed a search for approximate TTP and CSAP structural units, centered on P, in the network and found multiple occurrences of such units.
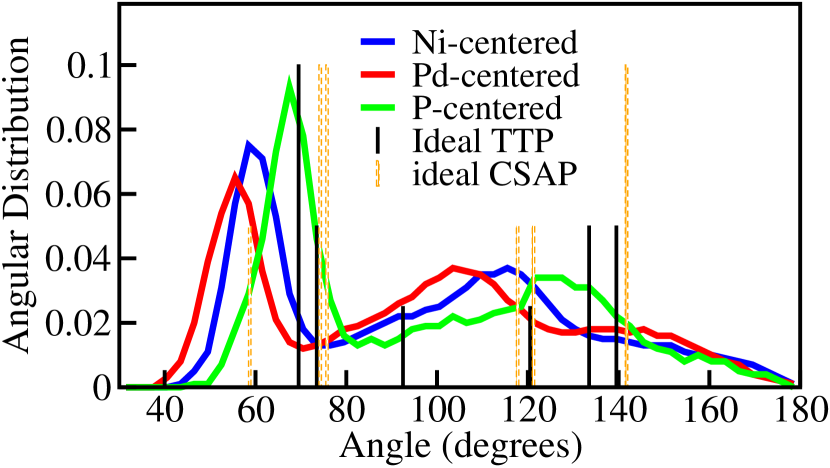
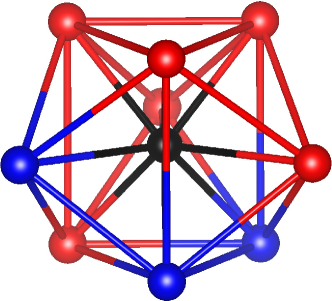
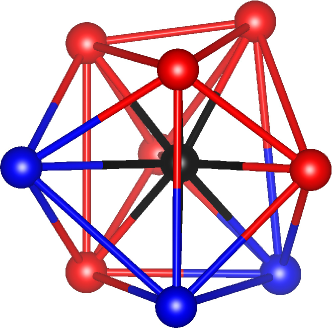
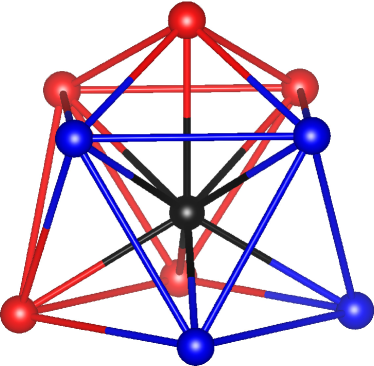
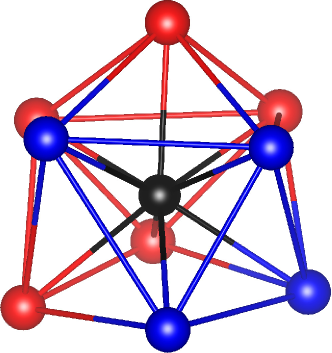
In Fig. 5, we have shown examples of TTP and CSAP clusters found within Ni40Pd40P20 networks along with their ideal counterparts. A description of ideal TTP and CSAP clusters can be found in Ref. Atta-Fynn et al., 2011. Although the clusters found in Ni40Pd40P20 glassy networks exhibit noticeable distortions, the resemblance to the ideal TTP and CSAP structures is clearly visible in Fig. 5. These distortions can be largely attributed to the broadening of the angular distributions in glassy Ni40Pd40P20 environment but contributions from finite-temperature effects are also expected to play a part. The existence of such structural units was reported by Kumar et al. Kumar et al. (2011) in ab initio studies of Ni40Pd40P20 glass and by Rainer et al. Pöttgen et al. (2006) and in phosphide-based metal clusters calculations. A characteristic feature of TTP and CSAP structures is that they can easily transform from one to other under the influence of temperature. It has been observed that an array of coordination structures exists that are closely related to the TTP and CSAP structures. For example, an 8-fold coordinated atom is usually a TTP or a CSAP structure with a missing capping atom; a 10-fold coordinated atom could be a bicapped square anti-prism (CSAP structure plus an additional capping atom); a 12-fold coordinated atom is a quadruple-capped square anti-prism (CSAP structure plus three additional capping atoms). TTP, CSAP, and their low and high coordination geometric derivatives are expected be the building blocks of on the nanometer-scale structural order in this BMG. However, given the size of the supercell of about 8 Å containing only 300 atoms, it is difficult for the system to form structural order on the nanometer length scale.
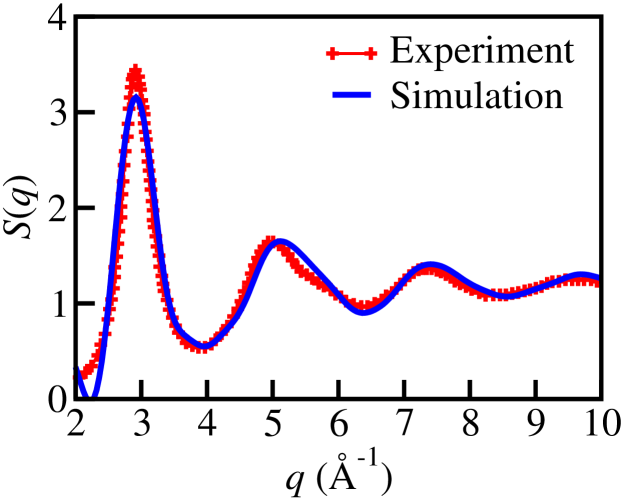
Figure 6 depicts the simulated static structure factor, averaged over 10 configurations, along with the experimental structure-factor data from a recent differential scanning calorimetry (DSC) experiments, due to Lan et al.Lan et al. (2017) The static structure factor, , can be obtained directly from the position of the atoms in the network:
| (1) |
where is the vector from the position of the -th atom to the position of the -th atom (with periodic boundary conditions taken into account to mimic bulk effects), is the atomic form factor of the -th atom, is wave-vector transfer of magnitude and symbol indicates the rotational averaging of of magnitude over a solid angle of ave and averaging over all 10 configurations. The atomic form factor was computed using the Gaussian representation:
| (2) |
where , , and are atom-type specific empirical constants taken from Ref. Brown et al., 2004. The match between the simulated structure factor with experiment in Fig. 6 is very good, further validating the accuracy of the structural models. The simulated data is also in good agreement with the experimental data by Egami et al.Egami et al. (1998)
III.2 Comparison of Simulated and Experimental XAFS Spectra
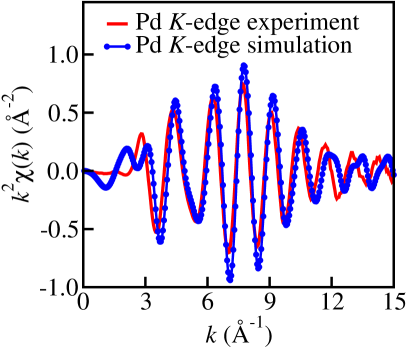
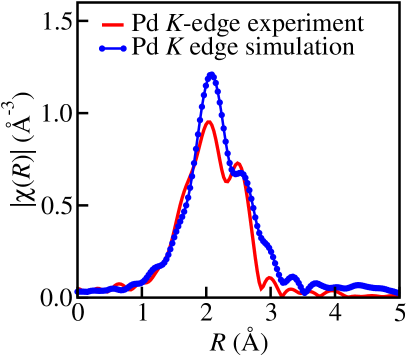
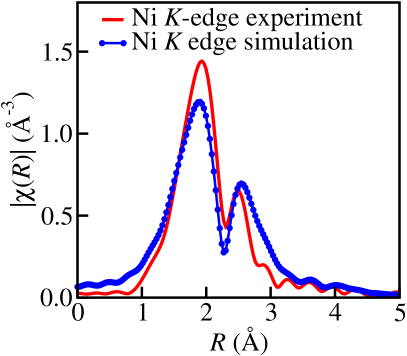
To further verify the credibility of the models presented in this work, we compare a key structural property, namely the extended X-ray absorption fine-structure spectroscopy (EXAFS), of our simulated atomistic configurations to available experimental data. For a given configuration, 6 Å clusters centered on the absorber (that is the Pd or K atom) are carved out used as input to the FEFF9 ab initio multiple scattering code,Rehr and Albers (2000); Rehr et al. (2009) which produces an edge EXAFS spectrum for each cluster. The separate spectra for the individual clusters are then averaged to yield EXAFS spectrum for that configuration. The EXAFS spectra for the ten (10) atomistic configurations was then averaged to obtain to representative EXAFS spectrum , of Pd and Ni -edges. Depicted in Figures are the EXAFS spectra and its corresponding Fourier transform given by:
| (3) |
where is the Hanning window function.
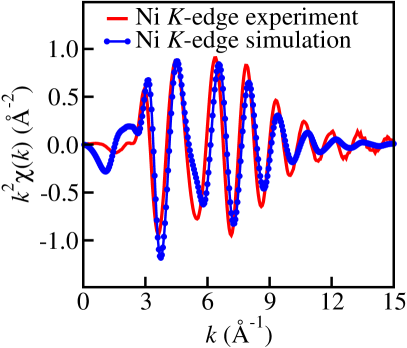
In Figs. 7(a) and 7(b), the simulated -edge EXAFS and the magnitude of its Fourier transform, for Pd are depicted and compared recent experimental data due to Kumar et al. Kumar et al. (2011) In Fig. 7(a), we observe that the frequency of oscillations and amplitude of the simulated spectra matches fairly well with the experimental spectra. The Fourier-transformed data is displayed in the bottom Figure. The Figure does not include the correction for the phase-shift associated with the absorber–scatterer interactions and hence the displayed radial distances are lower than the true radial distances in the partial RDF for Pd. The plots for Ni -edge in Fig. 7(c) shows amplitudes in the simulated data which match fairly well with experimental data. The Fourier-transformed data for the Ni -edge in Fig. 7(d) also correlates well with the experimental data.
III.3 Electronic properties
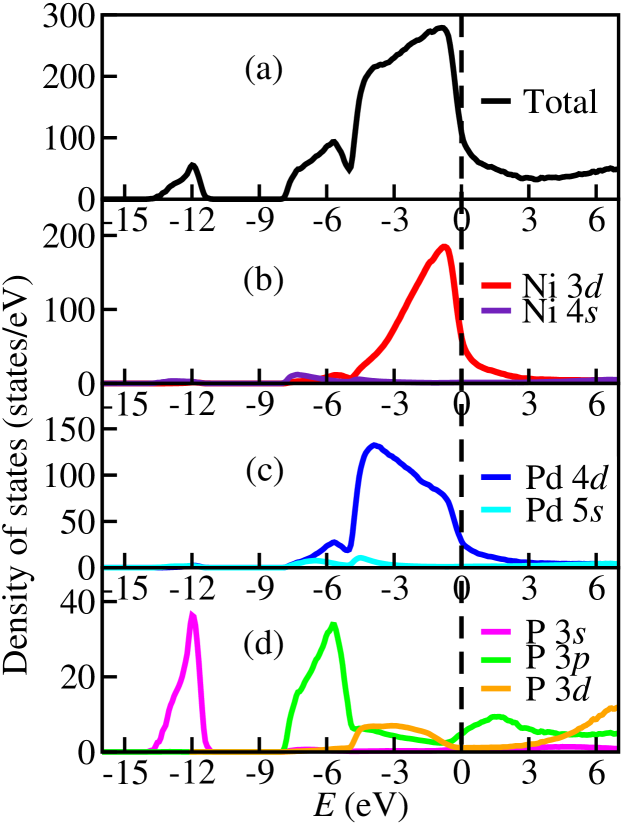
Depicted in Fig. 8 are the total and angular-momentum resolved (for each atom type) electronic density of states (DOS) of the single particle Kohn-Sham energy eigenvalues. The Fermi level was set to =0 (dashed vertical line). The region between eV and eV is dominated by the P 3 states. The P 3 hybridizes with the Ni 4 and Pd 5 electron states corresponding to the Ni and Pd atoms located at the vertices of the TTP and CSAP geometries.Takeuchi et al. (2007); Guan et al. (2012) The region between eV and eV is dominated by the P 3 states, with a small admixture by the Ni and Pd and states; these bands are responsible for the capping bonds between P and the capping Ni and Pd atoms in the TTP and CSAP structures. The strong hybridization between the P electrons states and the Ni and Pd states suggest the formation of P–Ni and P–Pd covalent bonds. The region between eV and the Fermi level is dominated by the Ni 3 and Pd 4 bands, with a small contribution from the P 3 band. This energy region is responsible for the Pd–Pd, Pd–Ni, and Ni–Ni metallic bonding. Overall, the DOS analysis indicate that the P–Ni and P–Pd bonds are much stronger than metallic bonds, and hence the presence of P makes the BMG more cohesive.
III.4 Vibrational properties
The vibrational analysis of our models was based on the vibrational eigenfrequencies and eigenvectors obtained by diagonalizing the dynamical matrix. Specifically, we computed the atom-projected vibrational density of states (VDOS), total VDOS, generalized VDOS, and the inverse participation ratio (IPR).
The vibrational density of states, , projected on atoms of type at frequency is given by
| (4) |
where =Ni, Pd or P, are the phonon eigenfrequencies, is the total number of atoms of type , and is the contribution of atom to the square of the amplitude of the normalized phonon eigenvector corresponding to the phonon eigenfrequency . From the definition of , the total vibrational density of states, , inverse participation ratio, , and generalized vibrational density of states (GVDOS)Suck (2002), , at frequency are given by:
| (5) | ||||
| (6) | ||||
| (7) | ||||
| (8) |
where is the total number of atoms, is the Debye-Waller factor for the atom of type , is the concentration of atoms of type in the system, is the total scattering cross-section of atom and is the atomic mass of atom of type . For this work, the weight factors (in equations 7 and 8) from the experimental work of SuckSuck (2002), namely = 0.768, = 0.102, = 0.13, were employed.
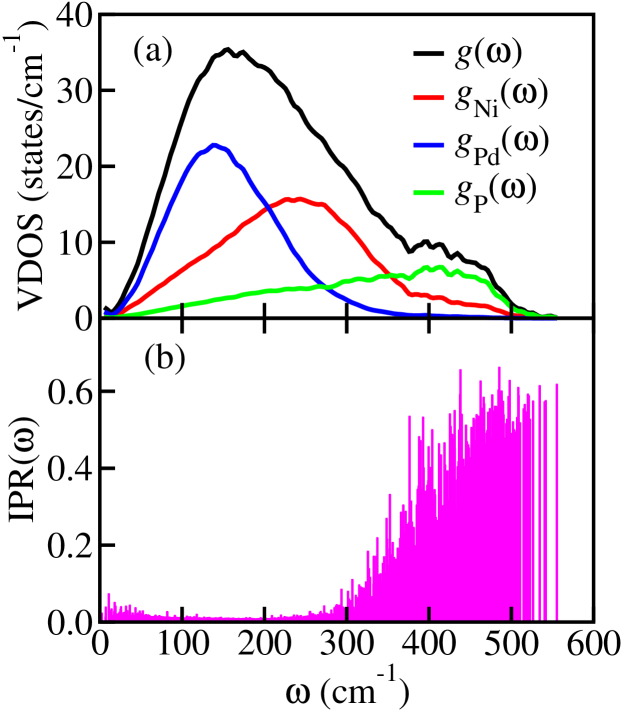
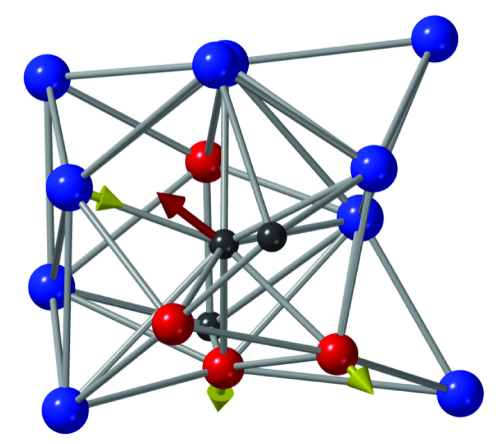
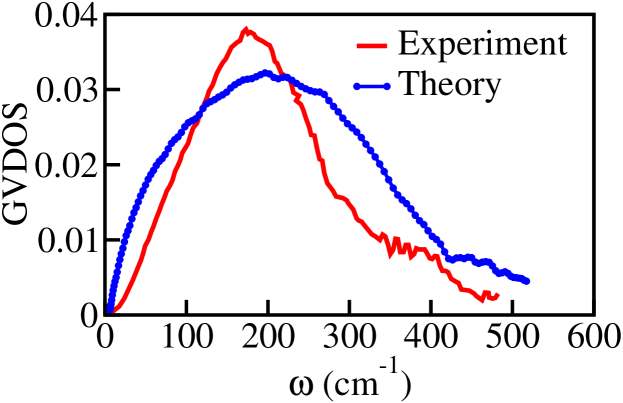
In Fig. 9(a) the atom-resolved and total vibrational density of states are shown. Clearly the low frequency states are dominated by Ni and Pd while the high-frequency states originate from the atomic vibrations of Ni and P. The IPR shown in Fig. 9(b) is measure of the amount eigenmode amplitude localized at the atomic sites. For a perfectly localized eigenmode conjugate to the eigenfrequency , only a single atom gives rise to the vibrational amplitude and hence IPR()=1. For a perfectly delocalized eignemode corresponding to the eigenfrequency , each atomic site makes an equal contribution to the amplitude of the eigenmode, and so IPR()=1/. From the IPR plot in Fig. 9(b), an extended state-to-localized phonon eigenstate transition in the vicinity of can be observed. An analysis of the atomic contribution to the amplitudes of vibration of the phonon eigenmodes indicates that the amplitudes of vibrations of majority of the modes below are delocalized over all the atoms, while the amplitudes of the high-frequency eigenvectors were localized on P and about four or five neighboring Pd and/or Ni atoms. As an example, Fig.10 depicts the magnitude and direction of an atom’s contribution to localized eigenmode amplitude (IPR=0.66, ). The central P atom, shown in black color, makes an 80% contribution to the amplitude, while two Ni atoms (red) and one Pd atom (blue) make contributions of approximately 6% (resulting in a net contribution of approximately 98% by the four atoms). More importantly, the Ni and Pd atoms are within a radius of less than 2.3 Å from the P atom. The nature of the mode in Fig. 10 appears to be an admixture of stretching and bending modes, centered on P, with the stretching modes being dominant. The other localized modes were found to behave in a fashion similar to the one in Fig. 10. The small localization radius (centered on P) is a characteristic feature of all the localized eigenmodes. In Fig. 11, the GVDOS is computed and compared with experimental data. Ni vibrations dominate the lower energy of the GVDOS, while P vibrations dominate the higher energy bands. Apart from the small deviations of the simulated GVDOS from the experimentally measured data, the overall match is good, further validating the reliability of the applied theoretical model.
IV Conclusions
The structural, electronic, and vibrational properties of Ni40Pd40P20 bulk metallic glass have been studied using ab initio molecular-dynamics simulations and total-energy minimizations. Since multi-component BMGs are characterized by a variety of atomic environments, an ensemble of ten (10) independent 300-atom structural configurations were simulated and studied in an effort to take into account the effect of configuration fluctuations on the geometric, electronic, and vibrational properties of glassy Ni40Pd40P20. The average static structure factor obtained from our simulations is found to be in excellent agreement with experimental data. Likewise, the simulated Ni and Pd -edge EXAFS spectra, averaged over 10 independent configurations, are also observed to be in good agreement with experimental measurements. The structural analysis of the resulting 10 configurations shows the absence of P–P bonds, with the segregated P atoms acting as the centers for distorted tricapped trigonal prisms and capped square anti-prism geometries. An analysis of the electronic density of states indicates that P atoms form strong covalent bonds with Ni and P at low energies, while the bonding states near the Fermi level are dominated by metallic Ni–Ni, Ni–Pd, and Pd–Pd bonds. A further analysis of the vibrational spectrum indicates that the low-frequency vibrational modes are dominated by the vibrations of Ni and Pd atoms, while the high-frequency modes primarily arise from the atomic vibrations of P atoms. The amplitudes of the high-frequency eigenmodes are observed to be well-localized on P atoms, which comprise an admixture of P–Ni and P–Pd stretch modes and bending modes. The generalized vibrational density of states is also found to agree fairly closely with the experimental data from inelastic neutron-scattering measurements.
We conclude this section with the following observation. A question of considerable importance that the current study could not address is the role of medium-range order on the nanometer length scale, which has been postulated as one of the qualities that give rise to the unique properties of BMGs. Although the presence of a few structural motifs in the glassy Ni40Pd40P20 environment is indicative of the medium-range order, the limited size of the models does not permit us to address this issue directly from our simulations. Nonetheless, the approach presented here can be employed profitably to simulate larger models on the nanometer length scale by using small high-quality structural configurations as the basic building blocks, which has the correct short-range order and the local chemistry built into it. In future, we shall address this building-block approach by combining the small structural units developed here to form a super structure/unit and annealing the resultant the super structure through a series of temperatures. Such an approach would be computationally efficient and the resulting models should provide an accurate structural basis to address the nanoscale properties of bulk metallic glasses.
Acknowledgements.
The work was supported by U.S. National Science Foundation under grant numbers DMR 1507166, DMR 1507118 and DMR 1507670. We thank Profs. Kumar, Fujita, and Kawazoe for making the experimental EXAFS data available to us. Atta-Fynn acknowledges the Texas Advanced Computing Center (TACC) at The University of Texas at Austin for providing HPC resources that have contributed to the results reported in this work.References
- Jafary-Zadeh et al. (2018) M. Jafary-Zadeh, G. Praveen Kumar, P. S. Branicio, M. Seifi, J. J. Lewandowski, and F. Cui, J. Funct. Biomater. 9, 19 (2018).
- Turnbull and Fisher (1949) D. Turnbull and J. C. Fisher, J. Chem. Phys. 17, 71 (1949).
- Turnbull (1969) D. Turnbull, Contemp. Phys. 10, 473 (1969).
- Klement Jun et al. (1960) W. Klement Jun, R. H. Willens, and P. O. L. Duwez, Nature 187, 869 (1960).
- Wang et al. (2004) W. Wang, C. Dong, and C. Shek, Mater. Sci. Eng. R Rep. 44, 45 (2004).
- Ashby and Greer (2006) M. F. Ashby and A. L. Greer, Scripta Mater. 54, 321 (2006).
- Schroers et al. (2009) J. Schroers, G. Kumar, T. M. Hodges, S. Chan, and T. R. Kyriakides, JOM 61, 21 (2009).
- Li and Zheng (2016) H. Li and Y. Zheng, Acta Biomater. 36, 1 (2016).
- Huang et al. (2015) L. Huang, C. Pu, R. K. Fisher, D. J. Mountain, Y. Gao, P. K. Liaw, W. Zhang, and W. He, Acta Biomater. 25, 356 (2015).
- Inoue et al. (2008) A. Inoue, X. M. Wang, and W. Zhang, Rev. Adv. Mater. Sci. 18, 1 (2008).
- Inoue (2000) A. Inoue, Acta Mater. 48, 279 (2000).
- Drehman et al. (1982) A. J. Drehman, A. L. Greer, and D. Turnbull, Appl. Phys. Lett. 41, 716 (1982).
- Kui et al. (1984) H. W. Kui, A. L. Greer, and D. Turnbull, Appl. Phys. Lett. 45, 615 (1984).
- He et al. (1996) Y. He, R. B. Schwarz, and J. I. Archuleta, Appl. Phys. Lett. 69, 1861 (1996).
- Takeuchi et al. (2007) T. Takeuchi, D. Fukamaki, H. Miyazaki, K. Soda, M. Hasegawa, H. Sato, U. Mizutani, T. Ito, and S. Kimura, Mater. Trans. 48, 1292 (2007).
- Kumar et al. (2011) V. Kumar, T. Fujita, K. Konno, M. Matsuura, M. W. Chen, A. Inoue, and Y. Kawazoe, Phys. Rev. B 84, 134204 (2011).
- Guan et al. (2012) P. F. Guan, T. Fujita, A. Hirata, Y. H. Liu, and M. W. Chen, Phys. Rev. Lett. 108, 175501 (2012).
- Reyes-Retana and Naumis (2015) J. Reyes-Retana and G. Naumis, J. Non-Cryst. Solids 409, 49 (2015).
- Soler et al. (2002) J. M. Soler, E. Artacho, J. D. Gale, A. Garciá, J. Junquera, P. Ordejón, and D. Sánchez-Portal, J. Phys. Condens. Matter 14, 2745 (2002).
- Troullier and Martins (1991) N. Troullier and J. L. Martins, Phys. Rev. B 43, 1993 (1991).
- Kleinman and Bylander (1982) L. Kleinman and D. M. Bylander, Phys. Rev. Lett. 48, 1425 (1982).
- Ceperley and Alder (1980) D. M. Ceperley and B. J. Alder, Phys. Rev. Lett. 45, 566 (1980).
- Perdew and Zunger (1981) J. P. Perdew and A. Zunger, Phys. Rev. B 23, 5048 (1981).
- Haruyama (2007) O. Haruyama, Intermetallics 15, 659 (2007), advanced Intermetallic Alloys and Bulk Metallic Glasses.
- Martyna et al. (1996) G. J. Martyna, M. E. Tuckerman, D. J. Tobias, and M. L. Klein, Mol. Phys. 87, 1117 (1996).
- Hoover (1985) W. G. Hoover, Phys. Rev. A 31, 1695 (1985).
- Nosé (1984) S. Nosé, J. Chem. Phys. 81, 511 (1984).
- Atta-Fynn et al. (2011) R. Atta-Fynn, E. J. Bylaska, G. K. Schenter, and W. A. de Jong, J. Phys. Chem. A 115, 4665 (2011).
- Pöttgen et al. (2006) R. Pöttgen, W. Hönle, and H. G. Schnering, “Phosphides: Solid-state chemistry,” in Encyclopedia of Inorganic Chemistry (American Cancer Society, 2006).
- Lan et al. (2017) S. Lan, Y. Ren, X. Y. Wei, B. Wang, E. P. Gilbert, T. Shibayama, S. Watanabe, M. Ohnuma, and X. L. Wang, Nat. Commun. 8, 14679 (2017).
- (31) For a given wave vector of fixed magnitude , the averaging was performed (in spherical polar coordinates) using 240 divisions along the colatitude in the range and 480 divisions along the longitude in the range . Thus total number of orientations over which was averaged (for a given ) was .
- Brown et al. (2004) P. J. Brown, A. G. Fox, E. N. Maslen, M. A. O’Keefe, and B. T. M. Willis, “Intensity of diffracted intensities,” in International Tables for Crystallography Volume C: Mathematical, physical and chemical tables, edited by E. Prince (Springer Netherlands, Dordrecht, 2004) pp. 554–595.
- Egami et al. (1998) T. Egami, W. Dmowski, Y. He, and R. B. Schwarz, Metall. Mater. Trans. A 29, 1805 (1998).
- Rehr and Albers (2000) J. J. Rehr and R. C. Albers, Rev. Mod. Phys. 72, 621 (2000).
- Rehr et al. (2009) J. J. Rehr, J. J. Kas, M. P. Prange, A. P. Sorini, Y. Takimoto, and F. Vila, Comptes Rendus Phys. 10, 548 (2009), theoretical spectroscopy.
- Suck (2002) J.-B. Suck, “Low energy dynamics in glasses investigated by neutron inelastic scattering,” in Advances in Solid State Physics, edited by B. Kramer (Springer Berlin Heidelberg, Berlin, Heidelberg, 2002) pp. 393–403.